

SUMMARY
It has been posited that anti-tumoral innate activation is driven by derepression of endogenous repeats. We compared RNA sequencing protocols to assess repeat transcriptomes in The Cancer Genome Atlas (TCGA). Although poly(A) selection efficiently detects coding genes, most non-coding genes, and limited subsets of repeats, it fails to capture overall repeat expression and co-expression. Alternatively, total RNA expression reveals distinct repeat co-expression subgroups and delivers greater dynamic changes, implying they may serve as better biomarkers of clinical outcomes. We show that endogenous retrovirus expression predicts immunotherapy response better than conventional immune signatures in one cohort yet is not predictive in another. Moreover, we find that global repeat derepression, including the HSATII satellite repeat, correlates with an immunosuppressive phenotype in colorectal and pancreatic tumors and validate in situ. In conclusion, we stress the importance of analyzing the full spectrum of repeat transcription to decode their role in tumor immunity.
In Brief
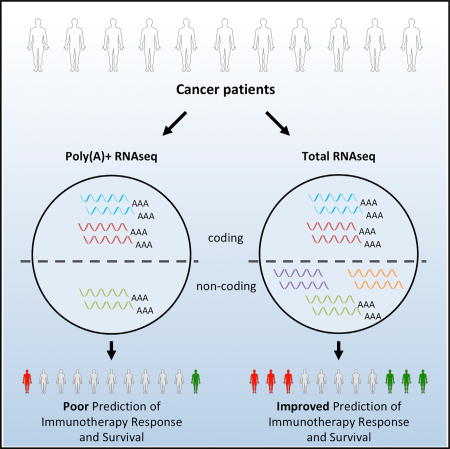
Solovyov et al. compare protocols used in tumor transcriptional profiling. They show the most widely used poly(A) protocol fails to detect several classes of repeat RNAs. In contrast, repeat expression in total RNA sequencing can correlate with the cancer-immune phenotypes and patient responses to immunotherapy.
INTRODUCTION
The transcriptional landscape of a cancer cell extends well beyond protein-coding mRNA and includes numerous non-coding transcripts, some of which play essential roles in modulating malignant transformation (Lin and He, 2017). Among the different classes of non-coding RNA are repetitive elements, which constitute more than half of genomic DNA and undergo increased transcriptional activity during neoplasia (Ting et al., 2011; Criscione et al., 2014). Aberrant transcription of repetitive elements in tumors is likely modulated by epigenetic modifications (Carone and Lawrence, 2013) and loss of tumor suppressor function (Wylie et al., 2016; Levine et al., 2016). Moreover, many repeat RNAs include specific sequence motifs (Tanne et al., 2015) and general RNA structures (Chiappinelli et al., 2015; Roulois et al., 2015) typically found in pathogen rather than human transcripts. Such pathogen “mimicry” can be detected by innate pattern recognition receptors (PRRs) and initiate signaling in the tumor microenvironment relevant for immune and epigenetic therapies (Leonova et al., 2013; Chiappinelli et al., 2015; Roulois et al., 2015; Woo et al., 2015; Desai et al., 2017; Greenbaum, 2017). These direct immunomodulatory features of repetitive elements provide a functional signaling pathway not previously appreciated in human cancers.
Unfortunately, the typical protocols employed in next generation RNA sequencing (RNA-seq) have been a practical barrier to assessing the landscape of aberrantly transcribed immunostimulatory repetitive elements (Zhao et al., 2014). The vast majority of publicly available RNA-seq datasets were biased to sequence polyadenylated RNA and, as we show, often consequently fail to detect many putatively functional non-coding transcripts that can stimulate PRRs. To give a sense of the degree to which assessments are biased in this regard, one need only look at the statistics of The Cancer Genome Atlas (TCGA). Although thousands of solid tumors are sequenced using the poly(A) select approach, only 38 solid tumor samples probe the total RNA. The breadth of aberrant repetitive element transcription and its link to PRR engagement in the tumor microenvironment is therefore severely under-quantified.
In this work, we first examined the 29 samples from TCGA for which both poly(A)-selected and total RNA-seq data are available from the same tumor. We find a large number of missing repetitive element transcripts from tumors sequenced using poly(A) protocols. Second, we show that repetitive elements expressed from these tumors fall into a set of distinct co-expression clusters. We quantify the nature of these clusters, their diversity, and whether the sequences they contain have anomalous motif use (one indicator of their potential to trigger PRRs). Finally, we unravel associations between expression of specific classes of repetitive elements, patient survival rates, and the immune profile of the tumor microenvironment.
RESULTS
Normalization of Total and Poly(A)-Selected Sequencing Shows Widespread Differences in Repetitive Element Detection
We identified 29 patient samples in TCGA that had RNA-seq data prepared using both the poly(A)-selected and total RNA protocols. Gene expression values computed from total RNA and poly(A) sequencing cannot be compared directly, because of gene-specific biases inherent to each protocol. However, we find that by applying trimmed mean of M-values (TMM) normalization (Robinson and Oshlack, 2010) between the 29 paired patient samples—and clustering samples based on protein-coding genes only—the same patient’s samples will mostly cluster together, despite having different sequencing library construction protocols (Figure 1A, black/white color code at the top). The technical difference between the poly(A) and total RNA protocols is therefore less than the biological difference for protein-coding genes in our cohort. A similar picture, to a lesser extent, was observed when we examined the computed expression of annotated non-coding RNAs (Figure 1B). Evaluation of repetitive element expression, however, was markedly different between the total and poly(A) RNA protocols. For most repeats, expression computed using the total RNA protocol exceeded the one computed from the poly(A) protocol (Figure 1C). Hierarchical clustering for repeat expression is therefore completely governed by the protocol used to prepare the RNA-seq library. We evaluated the robustness of the clustering using multiscale bootstrap resampling. Both approximately unbiased (AU) and bootstrap probability (BP) confidence values equal 100% for the cluster containing the 29 total RNA samples (Figure 1C). This partitioning is almost the same as partitioning into the total RNA and poly(A) samples (adjusted Rand index = 0.931).
Figure 1. Technical Comparison of Poly(A) and Total RNA Sequencing Protocols.

(A–C) Hierarchical clustering and expression heatmap based on coding gene expression (A), non-coding gene expression (B), and repeat element expression (C). Color code (top): total and poly(A) aliquots from the same sample are denoted using the same color. Total RNA is denoted in red and poly(A) in blue. The black/ white color (top) indicates whether the total RNA and poly(A) aliquots were direct neighbors in the dendrogram. See also Figures S1A–S1C. The total RNA- and poly(A)-selected aliquots were direct neighbors in the dendrogram for 23 of 29 pairs for coding genes and 18 of 29 pairs for non-coding genes.
(D–F) Volcano plots for the pairwise difference in the computed expression between the poly(A) and total RNA protocols. Positive log(fold change) indicates higher computed expression in the total RNA protocol. Both coding (D) and non-coding (E) genes exhibit different biases (i.e., positive or negative log[fold change]), with a few outliers (shown in red). Mitochondrial genes (shown in orange) are depleted in the total RNA protocol. Computed expression of repeat elements (F) is higher in the total RNA protocol for all but a few elements. Here, satellite repeats are shown in orange. See also Table S1.
(G–I) Hierarchical clustering and expression heatmap based on adjusted coding gene expression (G), non-coding gene expression (H), and repeat element expression (I). Only genes detectable (i.e., having sufficient read numbers) in both protocols are included. See also Figures S1D–S1F. In the absence of technical noise, the computed expression difference between the two protocols would be a gene-specific sample-independent constant.
Assuming that the effects of the preparation protocol are gene specific and sample independent, we compared expression of the same genes computed from RNA-seq data using both protocols. We performed a paired t test for expression values obtained from the total RNA and poly(A) data. This “differential expression” analysis evaluates the technical difference between protocols, not the biological difference between samples. Among 13,740 sufficiently expressed coding genes, 3,600 (26%) had lower and 3,414 (25%) had higher computed expression in the total RNA protocol (FDR < 0.05). Among 893 annotated non-coding genes, 281 (32%) had lower and 220 (25%) had higher computed expression in the total RNA protocol. Among 967 repeat elements, 33 (3%) had lower and 850 (88%) had significantly higher computed expression in the total RNA protocol. Interestingly, some coding genes (75 of 13,740 [0.5%]) form an outlier population with higher computed expression in the total RNA protocol (Figure 1D, Statistical Methods). Those were histone-related genes on chromosome 6. This finding is expected given the lack of polyadenylation of these genes. For non-coding genes, 38 of 893 (4%) were outliers composed mostly of small RNAs (Figure 1E). Finally, in the case of repeats, there is a clear and consistent inability to capture repetitive element expression using the poly(A) protocol (Figure 1F).
Given the possible differences in DNA contamination between sequencing protocols, we computed the average depth of coverage for repeat reads coming from possible DNA using the number of reads mapping to unambiguously sequenced genome loci not annotated as genes or repeat elements. Five hundred sixty-five repeat elements had significantly greater expression difference than expected from pure contamination, and 209 repeat elements had significantly lower expression difference than expected from pure contamination. Fifteen of 20 satellite repeat elements had significantly higher expression difference than expected from pure contamination, and only 3 satellite repeat elements had significantly lower expression. This is consistent with the inability to detect satellite repeats using the poly(A) protocol.
If the effect of preparation on computed gene expression is sample independent, expression computed from paired total RNA and poly(A) samples will differ by a gene-specific constant independent of the sample. We designed an analysis, restricted to genes whose computed median expression among the 29 patients was at least 10 reads per million in both protocols. After computing the gene-specific difference in the expression from the total RNA and the poly(A) counts, we added this difference to the expression computed from the poly(A) counts. Application of such protocol-specific correction improves the clustering accuracy according to expression of coding and annotated non-coding RNAs (Figures 1G and 1H). When clustering according to the coding gene expression, there are 20 robust (AU confidence value > 95%) two-element clusters containing the paired poly(A) and total RNA samples from the same patient each before the application of the correction, and there are 28 such clusters after the application of the correction (p = 0.012, two-tailed Fisher’s exact test). When clustering according to the annotated non-coding gene expression, there are 12 such two-element clusters before the application of the correction and 25 after the application of the correction (p = 0.0008, two-tailed Fisher’s exact test). When clustering according to the repeat element expression, there are no such two-element clusters before the application of the correction and 5 such clusters after the application of correction (Figure 1I), only 3 of them being robust.
Technical Noise for Repeat Expression Is Higher Than for Conventional Coding/Non-coding Genes
We tested whether bias due to technical noise in computing gene expression is protocol specific and gene independent. We performed a chi-square test for the variance of the ratio of the computed expression for each sample. We required that the variance of this ratio across the samples does not exceed the biologically significant expression difference. As a result, 61% of the coding genes, 37% of annotated non-coding RNA, and only 8% of annotated repeats passed the test at the FDR cutoff of 0.05. Genes and repeats that did not pass the test would require a larger sample size to detect the biologically significant effects.
Each sample has only one poly(A) prepared and one total RNA prepared aliquot, and thus two computed values. We computed the rank correlation between expressions of genes and repeat elements according to the poly(A) and the total RNA protocols (Figure 2A). We used only genes and repeat elements that were detectable using both protocols. At the FDR value of 0.05, 99% of coding genes, 95% of annotated non-coding RNA, and 56% of repeats passed the significance test for correlation. Expression values of repetitive elements computed using the poly(A) and total RNA samples exhibit a positive correlation (Figure 2A). However, the value of this correlation is smaller than for coding and annotated non-coding RNA. The reason may be techical noise from polyadenylated repeats having copies lacking a sufficiently long poly(A) tail or the aforementined contamination from genomic DNA.
Figure 2. Landscape of Repeat Elements Detected in RNA Sequencing Protocols.

(A) Rank correlation between expression according to the total RNA and poly(A) data was computed for each gene and repeat element detectable using both protocols. Distribution of the rank correlation for the coding and non-coding genes as well as repeat elements is shown. Rank correlation of repeat expression is typically smaller than that of the coding or non-coding genes because repeats experience higher technical noise (t test, p = 3e-168). Small peaks for the non-coding genes near zero comes from rRNA. See also Table S2.
(B) Regression for rank correlation between repeat expression according to the total RNA and poly(A) data versus length of the integration sites of the repeat element in the genome. Repeats with greater lengths have smaller correlations.
(C) Linear regression for variance of the computed expression difference for each repeat element versus length of the integration sites of the repeat element in the genome. Repeats with greater lengths have higher variance. See also Table S1.
(D) Cluster assignment versus repeat type. See also Table S3 and Figures S2B and S2C.
(E) Consensus (median) expression within the five repeat clusters.
(F) Proportion of different repeat types within repeat reads. Here we have not included the counts for rRNA, pseudogenes, and small nuclear RNA (snRNA). See also Figure S2A.
(G) Detectability of repeat elements of different types in poly(A) RNA-seq. Note that the satellites (SAT) are not detectable, and DNA transposons (DNA) are detectable. Most of the ERV/LINE1/SINE are detectable. See also Figure S2C.
(H) Boxplot for CpG compositional bias computed for the consensus sequence for repeats of different classes as well as coding and non-coding genes.
We investigated the relationship of the rank correlation between poly(A) and total RNA expression and the cumulative length for repeat sequences within the human HG38 genome. These values are negatively correlated (rank correlation rho = −0.42, p = 8e-19). We performed regression between these variables (Figure 2B, p < 2e-16), which predicted that correlation between expression values computed using the two protocols of 0.99 is achieved for a cumulated sequence length of 5 kilobases:
where ρ is the rank correlation and L is the cumulative repeat length in the genome. Regression between the variance of the expression difference between the two protocols and the cumulative length of repeat sequences (Figure 2C, p < 1.3e-12) further support the hypothesis that repeats with a higher length of integration sites within the genome exhibit greater noise. The regression is V = −0.17 + 0.08 log10L, where V is the variance of expression between the two protocols and L is the cumulative repeat length in the genome.
Repetitive Elements Form Distinct Co-expression Clusters
We performed consensus clustering of repetitive elements using the 39 total RNA tumor samples in TCGA. Five clusters of repetitive element co-expression were detected, indicating that many repetitive elements aberrantly expressed in tumors are not expressed independently of one another but rather are co-expressed (Figures 2D and 2E). Such clustering further indicates that different clusters of repeat expression may confer or are associated with distinct phenotypic traits. One cluster is an outlier in terms of its expression and contains most of the satellite repeats (Figures 2D and 2E). This cluster exhibits the highest diversity of expression across tumors, implying that satellite repeats are most likely to have individualized patterns of expression, as observed before (Ting et al., 2011). The other four clusters involve respectively LINEs, SINEs, ERVs, and repetitive DNA plus various repeats labeled “other” (e.g., CR1, hAT, simple repeats) (Figure 2F). Unlike the cluster containing the most SAT repeats, these clusters have similar consensus expression. We compared the detectability of each repetitive element class using the poly(A) protocol (Figure 2G). Strikingly, contrary to ERV, LINE, and SINE, satellite repeats appear almost universally undetectable by the poly(A) protocol, despite studies reporting that a fraction of these transcripts are actively polyadenylated (Criscione et al., 2014).
It was recently shown that the host defense protein ZAP (ZC3HAV1), an antiviral factor that also possesses retroelement restriction activity, specifically targets RNAs that are rich in CpG (Takata et al., 2017). Similarly, in an earlier study, we found that immunostimulatory properties of aberrantly expressed repeats were associated with unusual use of dinucleotide motifs compared with the rest of the human genome (Tanne et al., 2015). We therefore quantified aberrant motif use by the forces on CpG and UpA dinucleotides. The forces measure a sequences deviation from maximum entropy dinucleotide usage. We computed these effective forces for all LINE, SINE, and SAT elements (Figure 2H). Interestingly, satellite elements are the most diverse in terms of the CpG and UpA compositional bias, and consequently we propose that they are more likely to be sensed by innate PRRs as non-self based on motif usage (Vabret et al., 2017).
ERV Expression Can Be Associated with Positive Anti-PD-L1 (CD274) Immunotherapy Response
Pre-existing tumor T cell inflammation can be a strong predictor of response to cancer immunotherapy such as anti-PD-L1 (CD274)/PD-1 (PDCD1) or anti-CTLA-4 antibodies (Chen and Mellman, 2017). Several studies have recently highlighted links between a tumor’s ERV expression, “viral defense genes,” and anti-tumor immune responses (Chiappinelli et al., 2015; Roulois et al., 2015; Badal et al., 2017). It was hypothesized that chemically induced epigenetic dysregulation in tumors leads to expression of ERVs, which in turn stimulate innate immune PRRs and create an anti-tumoral innate immune response. In one study (Chiappinelli et al., 2015), endogenous ERV presence was associated with clinical benefit in patients treated with anti-CTLA-4 therapy. We examined one of the few available tumor immunotherapy RNA-seq datasets from patients treated with PD-L1 blockade (Snyder et al., 2017). In this cohort of patients with urothelial carcinoma, we tested the hypothesis that ERV expression is also associated with clinical benefits from therapy.
We performed hierarchical clustering using expression of ERV repeats with the RepeatMasker/Repbase annotation, which revealed two distinct clusters of high and low ERV expression levels (Figure 3A). In this case, association between ERV repeats expression and patient response (Response Evaluation Criteria in Solid Tumors [RECIST]) to PD-L1 immunotherapy was significant (p = 0.024, Fisher’s exact test). Consequently, patient survival analysis showed that high expression of ERV repeats correlates with overall survival (Figure 3D, p = 0.012) and progression-free survival (Figure 3E, p = 0.025). We performed logistic regression for the clinical benefit versus the total ERV repeat expression:
where EERV is the total expression of ERV repeats, and p is the probability of a clinical benefit (progression-free survival of at least 6 months). The coefficient for EERV is significant (p = 0.04). We performed Cox regression for the overall survival (hazard = −2.9 × EERV + 0.4 × age + 3.2 × met, where EERV is the total expression of ERV repeats, age is the patients’ age, and met = 1 when liver metastases are present and 0 otherwise). Coefficients for EERV and met are significant (p = 0.001 and p = 0.003). We performed the Cox regression for progression-free survival (hazard = −1.5 × EERV −1.9 × age + 1.8 × met). Coefficients for EERV and met are significant (p = 0.009 and p = 0.02). In both cases we performed a test for the proportional hazards assumption, and the assumption holds.
Figure 3. Endogenous Retroviral Expression Is a Predictor of Patient Response in Urothelial Cancer Cohort.

(A) Heatmap for ERV expression in the urothelial carcinoma dataset from Snyder et al. (2017). Annotation (top): L1HS, HERVK, and HSATII, expression of the corresponding repeat elements; ERV3-1, ERV3K-1, PD-L1 (CD274), PD1 (PDCD1), and CTLA-4, expression of the corresponding Ensembl genes. The read counts for ERV3-1 and ERVK3-1 are the highest among ERV genes annotated in Ensembl; nevertheless, they are still below the conventional low bound in RNA-seq (10 reads per million) in all samples. RECIST: black, missing data; blue, PD (progressive disease); cyan, SD (stable disease); orange, PR (partial response); red, CR (complete response). Benefit: green, clinical benefit; orange, no clinical benefit; gray, long survival despite the absence of the clinical benefit.
(B) Heatmap for the ERV repeat expression in TCGA total RNA dataset. Annotation (top): L1HS, expression of the corresponding repeat element; ERV3-1 and ERVK3-1, expression of corresponding Ensembl genes. The Pearson correlation between the mean expression of ERV elements and expression of ERV3-1 gene is 0.46 (p = 0.0040, two-tailed t test). Pearson correlation between the mean expression of ERV elements and expression of ERVK3-1 gene is 0.40 (p = 0.013, two-tailed t test).
(C) Heatmap for interferon-stimulated (viral defense) gene expression in urothelial carcinoma dataset from Snyder et al. (2017). Color annotation (top) is the same as that in (A).
(D) Kaplan-Meier plot for overall survival between patients from the ERV-repeat-high and ERV-repeat-low clusters. Association is significant (p = 0.012, log rank test). See also Table S5.
(E) Kaplan-Meier plot for progression-free survival between the patients from the ERV-repeat-high and ERV-repeat-low clusters. Association is significant (p = 0.025, log rank test).
Interestingly, expression of ERV repeats was a better predictor of response to immunotherapy than the viral defense signature, which did not similarly segregate patients (Figure 3; Table S5). We performed a series of Cox regressions for the hazard ratio using the patient’s age, presence of liver metastases, and expression of one of the viral defense genes or ERVs as independent variables. The effects of ERV expression were associated with improved survival (p = 0.001, FDR = 0.02), contrary to the viral defense genes. Additionally, as we show that RepeatMasker/Repbase annotation for ERV repeats yields a higher read number than that for ERV genes annotated in Ensembl, we suggest that clinical studies would reveal more accurate associations by interrogating global repeat expression for a particular class of repeats rather than specific ERV genes. Thus, the read counts of the ERV genes annotated in Ensembl were below the standard 10 reads per million threshold in RNA-seq, with ERV3-1 and ERVK3-1 having the highest read numbers. Expression of these two genes is correlated with mean ERV expression (Figure 3B). The implication is that because of the abundant transcription of repetitive elements, they are more robust predictors of response to immunotherapy than the expression of associated immune genes, which likely require a larger sample size to resolve cohorts.
In addition, we investigated a dataset of anti-PD-1 (PDCD1) therapy in metastatic melanoma (Hugo et al., 2016) and performed a similar series of Cox regressions using age, number of non-synonymous mutations, and expression of one of the viral defense genes or ERVs as independent variables. Neither expression of viral defense genes nor that of ERVs had a statistically significant effect on the hazard ratio. It is worth noting that almost all the tumors in this dataset are metastatic, unlike the dataset of Snyder et al. (2017). Likewise, both datasets originate from two different tumor types, which may have different patterns of ERV expression. Altogether, this suggests that there are unique repeat classes linked with different phenotypes that may be tissue context dependent, which merits further investigation.
Global Repeat Derepression Is Associated with an Immunosuppressive Phenotype
We next studied the relation between expression of repetitive elements and tumor progression in human cancers not treated with immunotherapy. Because few total tumor RNA-seq data are publicly available, we examined the expression of LINE and ERV elements, which can be detected using poly(A) capture, thus increasing our sample size. We focused on LINE and ERV expression in colon and rectal adenocarcinoma cancers available in TCGA, given the well-established genetics of colon cancer progression, the established co-expression of LINE1 and HERV-K (Desai et al., 2017), and the known presence of satellite repetitive element genome expansions (Bersani et al., 2015). We examined 364 paired-end RNA-seq samples prepared with the poly(A) protocol. We performed Cox regression for the hazard ratio using age, mutational load, presence of metastasis, high microsatellite instability (MSI-H), low micro-satellite instability (MSI-L), and expression of LINE, SINE, or ERV elements as independent variables. High expression of ERV elements has negative effect on survival (p = 0.004, FDR = 0.015). We then sorted samples by their expression level of LINE1 elements most recently integrated into the genome (L1HS) and performed differential expression analysis between the third and first terciles. Survival analysis (Kaplan-Meier curve) using the TCGA data shows that patients from the lowest L1HS expression tercile have the longer survival, compared to patients from the highest L1HS expression tercile (p=0.0297; Figure 4A).
Figure 4. Repeat Element Expression Is a Predictor of Colon Tumor Immune Infiltration and Patient Survival.

(A) Kaplan-Meier plot depicting survival over time for patients with high (red, top tercile) and low (blue, bottom tercile) L1HS expression. Dataset comes from colon and rectal adenocarcinoma cancers available in TCGA and classified as microsatellite stable. See also Table S5.
(B) Correlation of HSATII and L1HS expression in tumors prepared with total RNA protocol available in TCGA (n = 38, left) and in pancreatic tumors sequenced by single-molecule sequencing (n =16, right).
(C) GO terms enriched in genes downregulated in the third compared with the first tercile of samples sorted by L1HS expression in TCGA MSS colorectal tumors. See also Tables S4 and S6.
(D) GSEA enrichment plot for genes of the “positive regulation of leukocyte chemotaxis” GO set. Genes were ranked by the t statistic produced by comparison of their expression in the third and first terciles of samples according to L1HS expression in TCGA MSS colorectal tumors. p < 1e-4.
(E) Representative images of colon tumor stained for CD8 protein expression (immunohistochemistry, brown) and HSATII RNA (in situ hybridization, red). Left: low HSATII expression correlates with high CD8+ T cell infiltration. Right: high HSATII expression correlates with low CD8+ T cell infiltration.
(F) Associated quantification of colon cancer intratumoral CD8+ T cell per field of view (400 × 200 µm) (mean with SD). Tumor samples were classified as HSATII-high or HSATII-low expression following in situ hybridization staining. p = 0.0004 (unpaired t test).
To study in detail the relationship between repeat expression and cancer progression, we further analyzed the difference in gene expression in tumors expressing high or low levels of human LINE1. Gene Ontology (GO) enrichment analysis uncovered significant enrichment of specific GO terms when analyzing the subset of genes downregulated in high versus low LINE1 expression samples. Interestingly, all the terms were related to immune response, suggesting that they are the main pathways associated with LINE1 expression. Moreover, genes that were overexpressed in the samples that show upregulation of LINE1 expression demonstrated no significantly enriched GO term. The most significant GO terms enriched for the downregulated genes include “leukocyte migration,” “complement activation,” “phagocytosis,” “response to interferon-gamma,” and “regulation of antigen processing and presentation” (Figure 4). We also performed gene set enrichment analysis (GSEA) on one of the enriched GO terms, “positive regulation of leukocyte chemotaxis” (Figure 4D). The implication is that either there is a correlation between the lack of epigenetic control associated with LINE1 expression and immune suppression, or, to the extent LINE1 elements engage immune pathways, they are activating pathways associated with negative regulation (Figure S1).
Similar gene expression analysis could not be performed with satellite repeats because of the small number of total RNA sequences available. Thus, we measured the relationship between LINE1 and specific satellite RNAs. Previous work using single-molecule RNA-seq had shown a strong association of LINE1 repeats with pericentromeric satellites in both mouse and human cancers (Ting et al., 2011). We confirmed that LINE1 expression correlates with expression of the human pericentromeric satellite HSATII in TCGA tumor samples prepared with total RNA protocol and in pancreatic tumors sequenced by single-molecule sequencing, obtained from Ting et al. (2011) (Figure 4B; R2 = 0.179, p = 0.009, and R2 = 0.571, p = 0.001, respectively). Given the ability of single-molecule RNA-seq to better quantify HSATII, we performed a targeted analysis of the 16 such pancreatic cancer samples (Ting et al., 2011) to determine if there was a consistent relationship between HSATII and the tumor immune micro-environment. We binned samples into terciles according to HSATII expression and performed differential expression analysis between the third and first terciles. In particular, genes downregulated in HSATII-high samples were also enriched in the “lymphocyte migration” GO term.
Additionally, we performed a GO-independent analysis of immune gene enrichment following the immune signatures defined by Rooney et al. (2015). Interestingly, the two genes labeled as responsible for the cytolytic activity (GZMA and PRF1) associated with cytotoxic T (CD8+) activation are highly downregulated in high-HSATII-expressing samples (8-fold change). It was recently shown that active β-catenin signaling in metastatic melanoma samples results in T cell exclusion from the tumor microenvironment (Spranger et al., 2015). To evaluate the role of β-catenin pathway in the relation between LINE1/ HSATII expression and immune-excluded tumor phenotype, we analyzed the differential expression of a list of β-catenin target genes in the TCGA and pancreatic tumor datasets (Table S5). We did not measure any significant correlation between a β-catenin signature and L1HS and HSATII.
To validate the relevance of these GO terms, we performed combined RNA in situ hybridization for HSATII and immunohistochemistry for cytotoxic T cells (CD8+) in a cohort of 75 colon tumor samples (Figures 4E and 4F). We scored tumors on the basis of high or low levels of HSATII by comparing relative levels of HSATII staining in tumor cells compared with normal adjacent cells. We then quantified the density of CD8+ T cells observed in the tumor microenvironment, finding significantly fewer CD8+ T cells in HSATII-high tumors. This is consistent with our computational analysis of RNA-seq data demonstrating a downregulation of immune-related GO terms in repeat-expressing (LINE1 or HSATII) cancers.
DISCUSSION
Broader use of total RNA-seq protocols and single-molecule sequencing platforms would allow researchers to investigate the expression of repetitive elements and their use as biomarkers or immune stimulators in cancer. Available data reveal that conventional poly(A) capture-based RNA-seq allows one to detect expression of only a limited number of repetitive elements, despite their recently established role in prognosis and response to epigenetic and immunotherapy. Only a subset of LINE-, SINE-, and ERV-related elements can be captured with the poly(A) protocol, along with some DNA repeats. Conversely, satellite repeats (in particular HSATII, a known cancer biomarker and immunostimulatory molecule) are only detected using the total RNA protocol.
We show ERV expression is associated with positive response in a set of patients treated with anti-PD-L1 therapy, extending previous findings in melanoma patients treated with anti-CTLA-4. Moreover, although ERV expression segregated patients, the viral defense signature associated with response in previous work did not, suggesting abundant transcription of repetitive elements may represent a more robust biomarker. Satellite repeats display heterogeneous expression and anomalous nucleotide motif use relative to other repeat classes. One may hypothesize that in late-stage tumors, in which abundant repetitive element expression is associated with failure of tumor suppressors, the large-scale transcription of many “non-self” repetitive elements has been co-opted by the tumor’s evolution to maintain an advantageous inflammatory state. The distinct sequence motifs in satellite RNAs, including HSATII, that appear “non-self” lead to differential innate immune response is consistent with this theory (Tanne et al., 2015).
Altogether, our work indicates that expression of repeat RNAs is heterogeneous and correlates with relative changes in the balance of inflammatory immune response that are pro- or anti- tumoral. Mechanistically, this may involve the sensing of repeat expression by innate immune cells in the tumor microenvironment or by innate immune sensors expressed by the cancer cell itself. This would be consistent with previous work demonstrating that specific stimulation of innate immune receptors on cancer cells can be pro-tumorigenic, such as in pancreatic cancer (Ochi et al., 2012; Zambirinis et al., 2014), in which HSATII is known to be highly abundant (Ting et al., 2011). Because HSATII is not detected by the poly(A) sequencing protocol, we conclude that causal molecules with a critical role engaging the innate response in the tumor microenvironment may be hidden from view using current sequencing protocols. We therefore demonstrate the need for total RNA protocols and associated bioinformatics tools to uncover the currently hidden, yet likely critical, signaling RNAs in the cancer immune microenvironment.
EXPERIMENTAL PROCEDURES
We selected 38 samples from TCGA that had total RNA frozen solid tumor RNA-seq data. These samples were composed of 12 LUAD, 10 COAD, 5 BRCA, 4 KIRC, 4 UCEC, and 3 BLCA tumors. Among these 38 samples, 29 samples had matching poly(A) RNA-seq data. Total RNA- and poly(A)-selected aliquots were derived from the same physical sample. These samples were composed of 11 LUAD, 6 COAD, 5 BRCA, 4 KIRC, and 3 BLCA tumors. The presence of such paired samples allows one to perform a technical comparison of sequencing protocols and their effects on computed gene expression.
The total RNA and poly(A) preparation protocols use different strategies for rRNA depletion. The total RNA protocol uses the RiboZero kit to remove rRNA. The poly(A) protocol uses the poly(A) capture procedure to isolate the polyadenylated transcripts, which leaves rRNA out. After initial quality filtering, we aligned the reads to the human genome and to the Repbase database of repetitive elements (Bao et al., 2015). The number of reads mapping to the annotated genomic features was quantified, and expression was computed.
Gene expression in terms of log2-CPM (counts per million reads) was computed and normalized across samples using the TMM method as implemented in the calcNormFactors function of edgeR (Robinson et al., 2010). Only coding genes were used for normalization. In particular, this procedure ensures that the computational subtraction of the rRNA reads is done. The purpose of the normalization procedure is to identify some reference quantities (e.g., housekeeping gene expression) that can be compared among the different samples to establish the sample specific normalization factor. In particular, the TMM normalization procedure assumes that most of the genes are not differentially expressed or that the effects of the overexpression and the underexpression are approximately equal except for some outliers. These assumptions are reasonable when we consider the protocol-specific difference for the coding genes. Indeed, the majority of the coding genes are expected to be detectable by both protocols, which is not the case for the repeat elements. Genes with low expression (ones not having at least 10 reads per million reads in at least two samples) were filtered out. The same protocol was used for all datasets.
The difference of the computed expression between the two protocols was computed using limma (Smyth, 2004; Ritchie et al., 2015). Expression data were used in conjunction with the weights computed by the voom transformation (Law et al., 2014). Despite the use of the same computational procedure, this “differential expression” test measures the technical difference between the two sequencing protocols, not the biological difference between the various tissues. This difference is expressed as the binary logarithm of the fold change (logFC).
The chi-square test for the variance of computed gene expression was performed as follows. We considered only genes with median expression using both poly(A) and total RNA protocols that exceeded log2(10). For every physical sample, we computed the difference between the expression values from the poly(A) protocol and total RNA protocol. Then we computed the variance of these differences. We performed the chi-square test for the variance to verify whether these differences were sample independent. We required that the linear fold change between the two biological conditions (e.g., tumor and normal tissue) FC = 2 be detectable, assuming n = 3 replicates for each of the conditions. This led to the cutoff for the variance used in the test.
We performed linear regression between the variance and the log of the repeat length in the genome. For the rank correlation rho, we performed linear regression between log[(1 + rho)/(1 − rho)] and the log of the repeat length in the genome (logistic regression).
Human tumor tissues were obtained from the Massachusetts General Hospital according to IRB-approved protocols 2012P000039 and 2015P000731. Research involving human participants was approved by the MSKCC IRB.
Additional details of the analyses are given in Supplemental Experimental Procedures.
Statistical Methods
The difference of the computed expression between the two protocols was computed and evaluated using a paired moderated t test (limma). We identified outlier coding and non-coding genes as follows. We computed the mean and the SD of the distribution of logFC for all genes. Then we performed the Z test for the logFC value for each gene and computed the false discovery rate (FDR) using the Benjamini-Hochberg procedure. Genes whose FDRs were less than 0.05 were considered outliers. For this computation, we considered the coding and annotated non-coding genes separately.
Significance of the rank correlation was evaluated using the asymptotic t approximation. Significance of the regression coefficients was evaluated using the t test. Survival analysis was carried out using Kaplan-Meier log rank test as well as Cox regression. Where applicable, adjusted p values (FDR) were computed using the Benjamini-Hochberg method. Statistical significance of the hierarchical clustering was assessed using the bootstrap method (Suzuki and Shimodaira, 2006).
Clustering of repeat elements on the basis of expression was performed as follows. We created 1,000 bootstrap datasets and performed centroid clustering on each of them. Then we computed consensus clustering. Entropic forces acting on the sequence motifs were computed using the methods previously developed (Greenbaum et al., 2014; Chatenay et al., 2017).
DATA AND SOFTWARE AVAILABILITY
The accession number for the pancreatic cancer data (Ting et. al., 2011) reported in this paper is SRA: SRP006382; the accession number for the melanoma data (Hugo et. al., 2016) reported in this paper is SRA: SRP070710.
Supplementary Material
Highlights.
RNA repeats are not properly detected in poly(A)-selected libraries
Expression of specific RNA repeat classes correlates with immune infiltrates in tumors
Quantifying nucleic acid repeats in tumors can serve as immunotherapy biomarkers
Acknowledgments
S.A.F., D.F.B., and J.E.R. were supported by grants from the Ludwig Center for Cancer Research (http://www.ludwigcancerresearch.org) and by the NIH/National Cancer Institute (NCI) Cancer Center Support Grant (P30 CA008748). B.D.G. and D.T.T. were supported by the Stand Up To Cancer–National Science Foundation–Lustgarten Foundation Convergence Dream Team Grant and the National Science Foundation (grant 1545935). D.T.T. was supported by the Burroughs Wellcome Fund. K.S.A. and D.T.T. were supported by Affymetrix. B.D.G. was supported by NIH grant P01CA087497-1. N.B. was supported by NIH grant R01 AI081848, and N.B. and B.D.G. were supported by the Melanoma Research Alliance. A. Solovyov was supported by the V Foundation. A. Solovyov and B.D.G. would like to thank Remi Monasson and Simona Cocco for many helpful comments and suggestions. The results published here are in whole or part based upon data generated by the TCGA Research Network: http://cancergenome.nih.gov/.
DECLARATION OF INTERESTS
N.B. has served on the scientific advisory boards for CureVac, Inception, CPS, and Neon. N.B. has consulted for Genentech. N.B. has received research funding from Merck. S.A.F. is a stockholder of Urogen Pharma. S.A.F. has received research funding from Genentech and AstraZeneca. J.E.R. has consulted for Merck, BMS, Roche/Genentech, AstraZeneca, Inovio, Astellas, Seattle Genetics, Bayer, and Gritstone. J.E.R. has received research support for trials from Roche/Genentech, Astellas, and Novartis. D.F.B. has consulted for Merck, Genentech, BMS, Pfizer, and Urogen. D.F.B. has received research funding from Merck, Genentech, and Bristol-Myers Squibb. K.S.A. and D.T.T. have received research funding from Affymetrix. B.D.G. has consulted for Merck. B.D.G. and N.B. have a patent (WO201613048 A1) related to this work.
Footnotes
Supplemental Information includes Supplemental Experimental Procedures, two figures, and six tables and can be found with this article online at https://doi.org/10.1016/j.celrep.2018.03.042.
AUTHOR CONTRIBUTIONS
A. Solovyov, N.V., K.S.A., B.D.G., and D.T.T. conceived the study and design. A. Solovyov, N.V., K.S.A., N.B., B.D.G., and D.T.T. developed methodology. A. Solovyov and K.S.A. acquired data. A. Solovyov, N.V., K.S.A., A. Snyder, S.A.F., D.F.B., J.E.R., B.D.G., and D.T.T. analyzed and interpreted data. A. Solovyov, N.V., K.S.A., N.B., B.D.G., and D.T.T. wrote, reviewed, and/or revised the manuscript. B.D.G. and D.T.T. supervised the study.
References
- Badal B, Solovyov A, Di Cecilia S, Chan JM, Chang LW, Iqbal R, Ay-din IT, Rajan GS, Chen C, Abbate F, et al. Transcriptional dissection of melanoma identifies a high-risk subtype underlying TP53 family genes and epigenome deregulation. JCI Insight. 2017;2:e92102. doi: 10.1172/jci.insight.92102. [DOI] [PMC free article] [PubMed] [Google Scholar]
- Bao W, Kojima KK, Kohany O. Repbase Update, a database of repetitive elements in eukaryotic genomes. Mob. DNA. 2015;6:11. doi: 10.1186/s13100-015-0041-9. [DOI] [PMC free article] [PubMed] [Google Scholar]
- Bersani F, Lee E, Kharchenko PV, Xu AW, Liu M, Xega K, MacKenzie OC, Brannigan BW, Wittner BS, Jung H, et al. Pericentromeric satellite repeat expansions through RNA-derived DNA intermediates in cancer. Proc. Natl. Acad. Sci. U S A. 2015;112:15148–15153. doi: 10.1073/pnas.1518008112. [DOI] [PMC free article] [PubMed] [Google Scholar]
- Carone DM, Lawrence JB. Heterochromatin instability in cancer: from the Barr body to satellites and the nuclear periphery. Semin. Cancer Biol. 2013;23:99–108. doi: 10.1016/j.semcancer.2012.06.008. [DOI] [PMC free article] [PubMed] [Google Scholar]
- Chatenay D, Cocco S, Greenbaum B, Monasson R, Netter P. Evolutionary constraints on coding sequences at the nucleotidic level: a statistical physics approach; Proceedings of the XXth Evolutionary Biology Meeting; Marseilles. 2017. [Google Scholar]
- Chen DS, Mellman I. Elements of cancer immunity and the cancer-immune set point. Nature. 2017;541:321–330. doi: 10.1038/nature21349. [DOI] [PubMed] [Google Scholar]
- Chiappinelli KB, Strissel PL, Desrichard A, Li H, Henke C, Akman B, Hein A, Rote NS, Cope LM, Snyder A, et al. Inhibiting DNA methylation causes an interferon response in cancer via dsRNA including endogenous retroviruses. Cell. 2015;162:974–986. doi: 10.1016/j.cell.2015.07.011. [DOI] [PMC free article] [PubMed] [Google Scholar]
- Criscione SW, Zhang Y, Thompson W, Sedivy JM, Neretti N. Transcriptional landscape of repetitive elements in normal and cancer human cells. BMC Genomics. 2014;15:583. doi: 10.1186/1471-2164-15-583. [DOI] [PMC free article] [PubMed] [Google Scholar]
- Desai N, Sajed D, Arora KS, Solovyov A, Rajurkar M, Bledsoe JR, Sil S, Amri R, Tai E, MacKenzie OC, et al. Diverse repetitive element RNA expression defines epigenetic and immunologic features of colon cancer. JCI Insight. 2017;2:e91078. doi: 10.1172/jci.insight.91078. [DOI] [PMC free article] [PubMed] [Google Scholar]
- Greenbaum BD. Innate immune driven evolution via immunostimulatory RNA: viruses that mimic hosts, tumors that mimic viruses. Curr. Opin. Syst. Biol. 2017;1:137–142. [Google Scholar]
- Greenbaum BD, Cocco S, Levine AJ, Monasson R. Quantitative theory of entropic forces acting on constrained nucleotide sequences applied to viruses. Proc. Natl. Acad. Sci. U S A. 2014;111:5054–5059. doi: 10.1073/pnas.1402285111. [DOI] [PMC free article] [PubMed] [Google Scholar]
- Hugo W, Zaretsky JM, Sun L, Song C, Moreno BH, Hu-Lieskovan S, Berent-Maoz B, Pang J, Chmielowski B, Cherry G, et al. Genomic and transcriptomic features of response to anti-PD-1 therapy in metastatic melanoma. Cell. 2016;165:35–44. doi: 10.1016/j.cell.2016.02.065. [DOI] [PMC free article] [PubMed] [Google Scholar]
- Law CW, Chen Y, Shi W, Smyth GK. voom: precision weights unlock linear model analysis tools for RNA-seq read counts. Genome Biol. 2014;15:R29. doi: 10.1186/gb-2014-15-2-r29. [DOI] [PMC free article] [PubMed] [Google Scholar]
- Leonova KI, Brodsky L, Lipchick B, Pal M, Novototskaya L, Chenchik AA, Sen GC, Komarova EA, Gudkov AV. p53 cooperates with DNA methylation and a suicidal interferon response to maintain epigenetic silencing of repeats and noncoding RNAs. Proc. Natl. Acad. Sci. U S A. 2013;110:E89–E98. doi: 10.1073/pnas.1216922110. [DOI] [PMC free article] [PubMed] [Google Scholar]
- Levine AJ, Ting DT, Greenbaum BD. P53 and the defenses against genome instability caused by transposons and repetitive elements. BioEssays. 2016;38:508–513. doi: 10.1002/bies.201600031. [DOI] [PMC free article] [PubMed] [Google Scholar]
- Lin CP, He L. Noncoding RNAs in cancer development. Annu. Rev. Cancer Biol. 2017;1:163–184. [Google Scholar]
- Ochi A, Graffeo CS, Zambirinis CP, Rehman A, Hackman M, Fallon N, Barilla RM, Henning JR, Jamal M, Rao R, et al. Toll-like receptor 7 regulates pancreatic carcinogenesis in mice and humans. J. Clin. Invest. 2012;122:4118–4129. doi: 10.1172/JCI63606. [DOI] [PMC free article] [PubMed] [Google Scholar]
- Ritchie ME, Phipson B, Wu D, Hu Y, Law CW, Shi W, Smyth GK. limma powers differential expression analyses for RNA-sequencing and microarray studies. Nucleic Acids Res. 2015;43:e47. doi: 10.1093/nar/gkv007. [DOI] [PMC free article] [PubMed] [Google Scholar]
- Robinson MD, Oshlack A. A scaling normalization method for differential expression analysis of RNA-seq data. Genome Biol. 2010;11:R25. doi: 10.1186/gb-2010-11-3-r25. [DOI] [PMC free article] [PubMed] [Google Scholar]
- Robinson MD, McCarthy DJ, Smyth GK. edgeR: a Bio-conductor package for differential expression analysis of digital gene expression data. Bioinformatics. 2010;26:139–140. doi: 10.1093/bioinformatics/btp616. [DOI] [PMC free article] [PubMed] [Google Scholar]
- Rooney MS, Shukla SA, Wu CJ, Getz G, Hacohen N. Molecular and genetic properties of tumors associated with local immune cytolytic activity. Cell. 2015;160:48–61. doi: 10.1016/j.cell.2014.12.033. [DOI] [PMC free article] [PubMed] [Google Scholar]
- Roulois D, Loo Yau H, Singhania R, Wang Y, Danesh A, Shen SY, Han H, Liang G, Jones PA, Pugh TJ, et al. DNA-demethylating agents target colorectal cancer cells by inducing viral mimicry by endogenous transcripts. Cell. 2015;162:961–973. doi: 10.1016/j.cell.2015.07.056. [DOI] [PMC free article] [PubMed] [Google Scholar]
- Smyth GK. Linear models and empirical bayes methods for assessing differential expression in microarray experiments. Stat. Appl. Genet. Mol. Biol. 2004;3:e3. doi: 10.2202/1544-6115.1027. [DOI] [PubMed] [Google Scholar]
- Snyder A, Nathanson T, Funt SA, Ahuja A, Buros Novik J, Hellmann MD, Chang E, Aksoy BA, Al-Ahmadie H, Yusko E, et al. Contribution of systemic and somatic factors to clinical response and resistance to PD-L1 blockade in urothelial cancer: an exploratory multi-omic analysis. PLoS Med. 2017;14:e1002309. doi: 10.1371/journal.pmed.1002309. [DOI] [PMC free article] [PubMed] [Google Scholar]
- Spranger S, Bao R, Gajewski TF. Melanoma-intrinsic β-catenin signalling prevents anti-tumour immunity. Nature. 2015;523:231–235. doi: 10.1038/nature14404. [DOI] [PubMed] [Google Scholar]
- Suzuki R, Shimodaira H. Pvclust: an R package for assessing the uncertainty in hierarchical clustering. Bioinformatics. 2006;22:1540–1542. doi: 10.1093/bioinformatics/btl117. [DOI] [PubMed] [Google Scholar]
- Takata MA, Gonçalves-Carneiro D, Zang TM, Soll SJ, York A, Blanco-Melo D, Bieniasz PD. CG dinucleotide suppression enables antiviral defence targeting non-self RNA. Nature. 2017;550:124–127. doi: 10.1038/nature24039. [DOI] [PMC free article] [PubMed] [Google Scholar]
- Tanne A, Muniz LR, Puzio-Kuter A, Leonova KI, Gudkov AV, Ting DT, Monasson R, Cocco S, Levine AJ, Bhardwaj N, Greenbaum BD. Distinguishing the immunostimulatory properties of noncoding RNAs expressed in cancer cells. Proc. Natl. Acad. Sci. U S A. 2015;112:15154–15159. doi: 10.1073/pnas.1517584112. [DOI] [PMC free article] [PubMed] [Google Scholar]
- Ting DT, Lipson D, Paul S, Brannigan BW, Akhavanfard S, Coffman EJ, Contino G, Deshpande V, Iafrate AJ, Letovsky S, et al. Aberrant overexpression of satellite repeats in pancreatic and other epithelial cancers. Science. 2011;331:593–596. doi: 10.1126/science.1200801. [DOI] [PMC free article] [PubMed] [Google Scholar]
- Vabret N, Bhardwaj N, Greenbaum BD. Sequence-specific sensing of nucleic acids. Trends Immunol. 2017;38:53–65. doi: 10.1016/j.it.2016.10.006. [DOI] [PMC free article] [PubMed] [Google Scholar]
- Woo S-R, Corrales L, Gajewski TF. Innate immune recognition of cancer. Annu. Rev. Immunol. 2015;33:445–474. doi: 10.1146/annurev-immunol-032414-112043. [DOI] [PubMed] [Google Scholar]
- Wylie A, Jones AE, D’Brot A, Lu WJ, Kurtz P, Moran JV, Rakheja D, Chen KS, Hammer RE, Comerford SA, et al. p53 genes function to restrain mobile elements. Genes Dev. 2016;30:64–77. doi: 10.1101/gad.266098.115. [DOI] [PMC free article] [PubMed] [Google Scholar]
- Zambirinis CP, Pushalkar S, Saxena D, Miller G. Pancreatic cancer, inflammation, and microbiome. Cancer J. 2014;20:195–202. doi: 10.1097/PPO.0000000000000045. [DOI] [PMC free article] [PubMed] [Google Scholar]
- Zhao W, He X, Hoadley KA, Parker JS, Hayes DN, Perou CM. Comparison of RNA-Seq by poly (A) capture, ribosomal RNA depletion, and DNA microarray for expression profiling. BMC Genomics. 2014;15:419. doi: 10.1186/1471-2164-15-419. [DOI] [PMC free article] [PubMed] [Google Scholar]
Associated Data
This section collects any data citations, data availability statements, or supplementary materials included in this article.