

Abstract
Observations on naturally occurring gaps in the axonal neurofilament array of cultured neurons have demonstrated that neurofilament polymers move along axons in a rapid, intermittent, and highly asynchronous manner. In contrast, studies on axonal neurofilaments using laser photobleaching have not detected movement. Here, we describe a modified photobleaching strategy that does permit the direct observation of neurofilament movement. Axons of cultured neurons expressing GFP-tagged neurofilament protein were bleached by excitation with the mercury arc lamp of a conventional epifluorescence microscope for 12–60 s. The length of the bleached region ranged from 10 to 60 μm. By bleaching thin axons, which have relatively few neurofilaments, we were able to reduce the fluorescent intensity enough to allow the detection of neurofilaments that moved in from the surrounding unbleached regions. Time-lapse imaging at short intervals revealed rapid, intermittent, and highly asynchronous movement of fluorescent filaments through the bleached regions at peak rates of up to 2.8 μm/s. The kinetics of movement were very similar to our previous observations on neurofilaments moving through naturally occurring gaps, which indicates that the movement was not impaired by the photobleaching process. These results demonstrate that fluorescence photobleaching can be used to study the slow axonal transport of cytoskeletal polymers, but only if the experimental strategy is designed to ensure that rapid asynchronous movements can be detected. This may explain the failure of previous photobleaching studies to reveal the movement of neurofilament proteins and other cytoskeletal proteins in axons.
INTRODUCTION
Slow axonal transport is the mechanism by which cytoskeletal and cytosolic proteins are transported along axons from their site of synthesis in the nerve cell body. During the past decade there have been numerous efforts to observe this movement directly in living cells, but these studies (Baas and Brown, 1997; Hirokawa et al., 1997) have yielded conflicting results. The two techniques that have been used the most widely are fluorescence photobleaching and photoactivation. In these related approaches, fluorescent or caged fluorescent cytoskeletal subunit proteins are injected into nerve cells and then a laser is used to bleach or activate the fluorescence in a short segment of axon. The bleached or activated proteins then are observed by time-lapse imaging to detect their movement.
The first photobleaching study (Keith, 1987) on slow axonal transport reported slow and synchronous movement of tubulin in cultured PC12 cells, but attempts to reproduce this result in cultured PC12 cells and cultured chick and mouse sensory neurons were unsuccessful (Lim et al., 1989; Lim et al., 1990; Okabe and Hirokawa, 1990, 1992). Subsequent photobleaching and photoactivation studies (Sabry et al., 1995; Takeda et al., 1995) on tubulin in the motor neurons of developing grasshopper and zebrafish embryos, as well as photobleaching studies (Okabe and Hirokawa, 1990; Okabe et al., 1993; Takeda et al., 1994) on actin and neurofilament protein in cultured mouse sensory neurons, also failed to observe movement. Microtubules were observed to move in a slow and synchronous manner in cultured embryonic frog neurons (Reinsch et al., 1991; Okabe and Hirokawa, 1993), but it now appears that this was caused by stretching of the growing axon and that it did not represent bona fide slow axonal transport (Okabe and Hirokawa, 1992; Chang et al., 1998). The significance of the microtubule movement in frog neurons has not been resolved with certainty, but the failure of most photobleaching and photoactivation studies to detect movement appears to indicate that cytoskeletal proteins do not move en masse along axons (Brown, 2000).
We have demonstrated the movement of neurofilament polymers in cultured nerve cells using green fluorescent protein (GFP) fused to the amino terminus of neurofilament protein M (Wang et al., 2000), and very similar findings have been reported using GFP fused to the amino terminus of neurofilament protein H (Roy et al., 2000). To observe movement, we took advantage of the discontinuous distribution of neurofilaments along axons of cultured rat sympathetic neurons, which results in naturally occurring gaps in the axonal neurofilament array. Time-lapse imaging revealed the rapid movement of neurofilament polymers through these neurofilament-deficient regions, but the movements were frequently interrupted by prolonged pauses. The neurofilaments moved at peak rates of up to 3 μm/s, which approaches the rate of vesicle transport, but the movements were highly asynchronous and many of the neurofilaments did not move at all during the observation period. These observations suggest that the actual rate of movement in slow axonal transport is fast, but that the overall rate is slow because the rapid movements are interrupted by prolonged pauses (Brown, 2000).
If rapid infrequent movements are a general feature of slow axonal transport, then why was this not observed in previous photobleaching and photoactivation studies on cytoskeletal proteins? One possible explanation is that those studies were designed with the explicit expectation of a slow and synchronous movement (Brown, 2000). For example, it is important to note that the extent of bleaching in the photobleaching studies was only partial, typically reducing the fluorescent intensity in the axon by 50–90% (Okabe et al., 1993; Okabe and Hirokawa, 1993). If the residual unbleached fluorescence in the bleached region exceeded the fluorescent intensity of the moving polymers, then it is likely that their movement would not have been detected. In fact, Lim et al. (1990) estimated that as much as 10–20% of the fluorescent protein could have moved through the photobleached regions without detection in their experiments, and similar detection limits also have been estimated for the fluorescence photoactivation technique (Sabry et al., 1995). The inability of the photobleaching studies to detect movement may have been compounded by the length of the bleached regions (3–5 μm), which is too short to allow filaments to be tracked through successive time-lapse intervals, and by the duration of the time-lapse intervals (typically 5 min or more), which is too long to enable rapid movements to be detected.
If the above reasoning is correct, then it should be possible to observe slow axonal transport with the use of fluorescence photobleaching if the experimental strategy is designed to ensure that rapid asynchronous movement of cytoskeletal polymers can be detected in the bleached regions. To test this hypothesis, we have modified the conventional photobleaching strategy that has been used in previous studies. By bleaching thin axons, which have relatively few neurofilaments, we were able to reduce the fluorescent intensity in the axon enough to allow the detection of neurofilaments that moved in from the surrounding unbleached regions. To enhance our ability to detect moving filaments, we bleached long regions of axon (10–60 μm in length) and acquired images using short time-lapse intervals (4- to 5-s duration). We observed rapid, intermittent, and highly asynchronous movement of neurofilaments through the bleached regions at peak rates of up to 2.8 μm/s. A comparison of the motility in bleached regions and naturally occurring gaps indicates that there was no impairment associated with the photobleaching process. These results demonstrate that fluorescence photobleaching can reveal slow axonal transport, but only if the experimental strategy is designed to ensure the detection of rapid and asynchronous movements. This may explain the failure of previous photobleaching studies to reveal the movement of neurofilaments and other cytoskeletal proteins in axons.
MATERIALS AND METHODS
Cell Culture
Neurons dissociated from superior cervical ganglia of neonatal (P0-P1) rats were plated onto glass coverslips coated with poly-d-lysine (Sigma, St. Louis, MO; Mw, 70–150,000) and Matrigel (Collaborative Research, Bedford, MA; 10 μg/ml). Cultures were maintained at 37°C in Liebovitz's L-15 medium (GIBCO Life Technologies, Grand Island, NY; phenol red-free) supplemented with 0.6% glucose, 2 mM L-glutamine, 100 ng/ml 2.5S nerve growth factor (Collaborative Research), 10% adult rat serum (prepared by the method of Hawrot and Patterson, 1979), and 0.5% hydroxypropylmethylcellulose (Methocel, Dow Corning, Midland, MI) as described by Koehnle and Brown (1999).
Cloning and Transfection
The GFP–neurofilament protein M (NFM) expression vector, which directs the expression of the F64L/S65T variant of GFP (Clontech, Palo Alto, CA) linked to the amino terminus of rat NFM, has been described previously (Wang et al., 2000). The purified plasmid (300 μg/ml in 50 mM potassium glutamate; pH 7.0) was injected directly into the nucleus of cultured neurons with the use of a PLI-100 pressure injector (Harvard Apparatus, Holliston, MA). All injections were performed between 20 and 24 h after plating. Micropipettes were pulled from standard thick-wall borosilicate glass tubing (World Precision Instruments, Sarasota, FL) with the use of a P-97 Flaming-Brown pipette puller (Sutter Instruments, Novato, CA). In most experiments, the plasmid was coinjected with 1.25 mg/ml (Mw 10,000) tetramethylrhodamine dextran (Sigma) to allow visual confirmation of the injection procedure.
Live-cell Imaging and Fluorescence Photobleaching
All experiments were performed at 2–3 d after transfection. Cells were placed in a sealed chamber containing oxygen-depleted culture medium, as previously described (Wang et al., 2000), and were maintained at ∼ 35°C on the stage of a Nikon Diaphot 300 inverted microscope (Nikon, Garden City, NY) with the use of a Nicholson ASI-400 Air Stream Incubator (Nevtek, Burnsville, VA). Axons were observed by differential interference contrast and epifluorescence microscopy with the use of a Nikon 100x/1.4NA Plan Apo oil immersion objective and an fluoresceinisothiocyanate (FITC)/EGFP filter set (HQ 41001, Chroma Technology, Brattleboro, VT). Images were acquired with the use of a Quantix cooled CCD camera (Roper Scientific, Trenton, NJ) equipped with a Kodak KAF1400 chip (Rochester, NY). The camera was operated at maximum gain with a readout rate of 5 MHz and no pixel binning. For photobleaching, the GFP was excited by continuous unattenuated illumination with the 100-W mercury arc lamp and an FITC/EGFP filter set for 12–60 s (average, 33 s; n = 75). In general, the bleaching was performed in medial and distal regions of the axonal arbor at least 100 μm from the growth cone. The radiance of the illumination at the specimen plane was 600 kW/m2 (measured using a LI-190SA Quantum Sensor, LI-COR, Lincoln, NE), and the size of the photobleached region was adjusted in the range of 10–60 μm using a field aperture diaphragm in the epifluorescence illumination light path. For time-lapse imaging, the epifluorescent illumination was attenuated to 10% of its original intensity using a neutral density filter and images were acquired with 1-s exposures at 4- or 5-s intervals. The delay between the end of the photobleaching and the start of the time-lapse imaging was typically <2 min and was never more than 5 min. The number of regions bleached per neuron ranged from 1–6 (average, 2.9), but we never bleached more than one region within the same axonal branch (i.e., multiple bleached regions within a single cell were separated from each other by at least one major branch point).
Image Processing and Analysis
Motion analysis was performed by tracking the position of the leading or trailing ends of the filaments in successive time-lapse image frames using the Trackpoints drop-in motion analysis module of Metamorph software (Universal Imaging, Downingtown, PA). The average fluorescent intensity in bleached and unbleached axons was quantified using the segmented mask method developed by Brown et al. (1992).
RESULTS
To observe neurofilaments by fluorescence microscopy, we transfected cultured neurons from the superior cervical ganglia of neonatal rats with a plasmid coding for rat neurofilament protein M linked at its N-terminus to GFP (GFP-NFM). In a previous study on these neurons (Wang et al., 2000), we showed that 1) this plasmid directs the expression of the GFP-NFM fusion protein, 2) the GFP-NFM coassembles with endogenous neurofilament proteins, 3) ≥ 96% of the GFP-NFM polymerizes, and 4) the GFP-NFM incorporates into all axonal neurofilaments. Thus, the presence of GFP at the N-terminus of NFM does not appear to interfere with the assembly properties of this neurofilament protein.
To detect the movement of neurofilaments across the photobleached regions, we selected thin axons, which are less bright because they contain fewer neurofilaments. We found that axons of this thickness could be bleached to the desired extent by continuous excitation of the GFP fluorescence for 12–60 s (Figure 1A and B). The rate of bleaching in the illuminated region was most rapid initially and decreased in a nonlinear manner with increasing time (Figure 1D). After 60 s, the average fluorescent intensity in the bleached region was reduced by 95 ± 3% (n = 4). The photobleaching kinetics could not be modeled with a simple exponential function, which indicates that the decline in fluorescence was not a first-order process. We suspect that this was due to diffusion of fluorescent nonbleached neurofilament subunits into the illuminated region during the long photobleaching exposure. Inspection of the axons by differential interference contrast microscopy demonstrated that there was no alteration of axonal morphology associated with the bleaching process. Permeabilization of axons after photobleaching revealed that neurofilament polymers extended throughout the bleached region and that there was no alteration in the assembly state of the neurofilament protein associated with the bleaching process (Figure 1C).
Figure 1.

Fluorescence photobleaching. (A) A fluorescent axon before photobleaching. (B) The same axon after photobleaching by continuous excitation of the fluorescence for 60 s. The white arrowheads mark the proximal and distal ends of the bleached region, which measured 26 μm in length. (C) The same axon after extraction and fixation, stained for NF-L by immunofluorescence microscopy. Note that the axonal neurofilaments are continuous across the bleached region. To examine this quantitatively, we measured the mean fluorescence intensities in the bleached and flanking regions for five axons. The average ratio of these fluorescence intensities was 0.97 ± 0.34 (n = 5) for the GFP fluorescence (before photobleaching) and 0.98 ± 0.36 (n = 5) for the NF-L immunofluorescence (after photobleaching and immunostaining). The variability in these ratios reflects natural variations in axonal neurofilament content along the length of the axons. Statistical analysis of the data with the use of a paired t test revealed no significant difference (p = 0.87). (D) The kinetics of photobleaching. The error bars represent the SD about the mean for four axons. Scale bar = 5 μm.
Time-lapse imaging of photobleached axons revealed the movement of fluorescent structures into the bleached regions. We observed a total of 75 photobleached regions in 26 different cells, and the duration of the time-lapse movies ranged from 4 to 13 min. We analyzed the movement of all fluorescent structures that exhibited a net displacement of at least 10 pixels (0.685 μm) during the entire observation period. Seventy-nine percent (n = 72) of these structures were filamentous in shape and ranged from 0.7 to 15.8 μm in length (average, 4.5 μm; n = 64). The average width of these fluorescent filaments was 0.28 ± 0.05 μm (n = 48), which is comparable to the diffraction-limited resolution of the light microscope. For this reason, we cannot exclude the possibility that these fluorescent filaments may represent bundles of two or more neurofilaments. The remaining 21% (n = 19) of the moving structures were not filamentous in appearance. Seventeen of these structures were punctate fluorescent dots with an average diameter of 0.30 ± 0.03 μm, also comparable to the diffraction-limited resolution, and the other two were fluorescent blobs that were larger than the diffraction-limited resolution. One of these blobs measured 1.2 μm long and 0.48 μm wide, and the other measured 1.7 μm long and 0.41 μm wide. Measurement of the total GFP fluorescence in dots, blobs, and filaments indicated that the filaments represented ≥97% of the transported GFP-NFM protein.
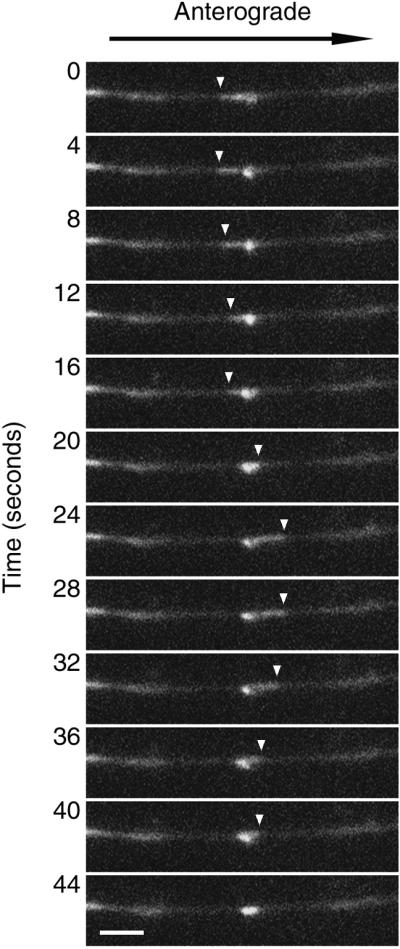
The fluorescent filaments moved rapidly, and their movements often were interrupted by prolonged pauses. For example, Figure 2 shows a short filament that moved through a photobleached region in an anterograde direction, pausing twice en route, and Figure 3 shows a longer filament that moved into a photobleached region in an anterograde direction and then stopped. Later footage of the latter filament (not shown) revealed that it remained paused for ∼ 6 min and then abruptly resumed its anterograde movement and exited the bleached region. The filaments in Figures 2 and 3 were typical of most filaments (64 of 72 filaments) in that they moved into the bleached regions after the start of the time-lapse imaging. These filaments were relatively bright because they originated from nonbleached regions of axon that flanked the bleached region. The remainder of the filaments (n = 8) were located in the photobleached region at the start of the time-lapse imaging. Some of these filaments (n = 4) were relatively bright, suggesting that they had moved into the photobleached region in the brief delay (typically a few minutes) between the end of the photobleaching and the start of time-lapse image acquisition. Other filaments (n = 4) were relatively faint, suggesting that they may have moved into the bleached region during the photobleaching exposure.
Figure 2.

Anterograde movement of a short fluorescent filament (2.3 μm in length) through the photobleached region of an axon. The images shown here were selected from a time-lapse movie in which images were acquired at 5-s intervals. The white arrowheads mark the leading and trailing ends of the filament. The filament moved rapidly through the photobleached region at an average velocity of 0.66 μm/s, pausing twice en route. The complete movie can be viewed online at www.molbiolcell.org. Proximal is left, and distal is right. Scale bar = 5 μm. Video: Time compression = 30:1.
Figure 3.

Anterograde movement of a long fluorescent filament (7.3 μm in length) through the photobleached region of an axon. The images shown here were selected from a time-lapse movie in which images were acquired at 4-s intervals. The white arrowheads mark the leading and trailing ends of the filament. The filament moved rapidly into the photobleached region at an average velocity of 0.44 μm/s. Subsequently, the filament paused for 6 min and then moved out of the photobleached region in the same direction (not shown). The complete movie can be viewed online at www.molbiolcell.org. Note that this filament exhibited uneven incorporation of GFP-NFM, resulting in fiduciary marks along its length that are reminiscent of the fluorescent speckles described by others (Waterman-Storer and Salmon, 1998). The fact that these speckles maintained a fixed position relative to the ends of the filament indicates that the movement cannot be accounted for by a treadmilling phenomenon, such as has been described for microtubules and microfilaments in other cell types. and distal is right. Scale bar = 5 μm. Video: Time compression = 24:1.
Figure 4 shows the motile behavior of six representative filaments. Filaments were observed to move in both directions, but 69% moved in a net anterograde direction. Many filaments exhibited brief reversals of direction, but we did not observe any reversals that were sustained for a duration of > 5 s or a distance of > 4.1 μm. To analyze the pausing behavior of the filaments quantitatively, we defined pausing as a movement of less than one pixel per second (0.0685 μm/s), which we estimate to be the precision limit of our measurements (Wang et al., 2000). For the 72 filaments that we tracked, the average time spent pausing was 67%, but this is certain to be an underestimate for the entire neurofilament population because we could only track filaments that moved; filaments that paused throughout the observation period could not be detected because they did not move into the bleached region (Wang et al., 2000). The average velocity, excluding pauses, ranged from 0.15 to 1.26 μm/s in the anterograde direction (average, 0.56 μm/s; n = 50) and from 0.17 to 1.35 μm/s in the retrograde direction (average, 0.62 μm/s; n = 22; Figure 5). The net average velocity for all the filaments, excluding pauses (considering anterograde velocities as positive and retrograde velocities as negative), was 0.18 μm/s in the anterograde direction. The peak velocity ranged from 0.36 to 1.70 μm/s in the anterograde direction (average, 1.07 μm/s; n = 50) and from 0.48 to 2.77 μm/s in the retrograde direction (average, 1.52 μm/s; n = 22; Figure 5).
Figure 4.

Graphical representation of the movements of six representative filaments. The y-axis represents the distance of the filament along the axon from its initial location, and the x-axis represents the time elapsed since the start of the movie. Anterograde and retrograde movements are represented as positive and negative displacements, respectively. (A) A filament that moved rapidly in an anterograde direction at an average rate of 0.52 μm/s for 35 s, paused for 90 s, and then continued to move anterogradely at an average rate of 0.81 μm/s. (B) A filament that moved rapidly in an anterograde direction at an average rate of 0.35 μm/s for 30 s, paused for 24 s, and then continued to move anterogradely at an average rate of 0.80 μm/s. (C) A filament that moved rapidly in an anterograde direction at an average rate of 1.06 μm/s for 25 s, then continued to move anterogradely but in a discontinuous manner, pausing frequently. (D) A filament that moved rapidly in an retrograde direction at an average rate of 1.47 μm/s for 10 s, paused for ∼ 115 s, moved retrogradely again at an average rate of 0.14 μm/s for 25 s, paused again for ∼ 10 s, and then continued to move retrogradely at an average rate of 1.51 μm/s. (E) A filament that moved rapidly in an retrograde direction at an average rate of 1.37 μm/s for 16 s, paused for ∼ 20 s, and then continued to move retrogradely at an average rate of 1.75 μm/s. (F) A filament that moved rapidly in an anterograde direction at an average rate of 0.80 μm/s for 15 s, paused for 35 s, and then exhibited several rapid short bursts of movement interrupted by prolonged pauses.
Figure 5.

Velocities and lengths of moving filaments. (A) A histogram of average velocities (excluding pauses) for all 72 filaments that moved. A filament was considered to have paused if it moved less than one pixel per second (0.0685 μm/s), which we estimate to be the precision limit of our measurements. (B) A histogram of peak velocities for all 72 filaments that moved. Peak velocity is defined as the maximum velocity attained in a single time-lapse interval. (C) The lengths of 64 filaments that moved. The other six filaments that moved could not be measured because both ends were never visible in the same image.
The movements of the dots and blobs were also frequently interrupted by pauses of varying duration. However, in contrast to the filaments, 88% (n = 15) of the dots and 100% (n = 2) of the blobs moved in a net retrograde direction. The average velocities of the fluorescent blobs, excluding pauses, were 0.16 and 0.78 μm/s, respectively, in the retrograde direction (average, 0.47 μm/s; n = 2), and their peak velocities were 0.50 and 1.63 μm/s, respectively, also in the retrograde direction (average, 1.07 μm/s; n = 2). On occasion, we have observed filamentous structures condense into blob-like structures, which indicates that the blobs could represent filaments (or bundles of two or more filaments) that folded or looped back on themselves during their movement along the axon. Figure 6 shows an example of this behavior, in which a filament appeared to fold, unfold, and then refold over the course of 44 s. The average velocity of the fluorescent dots, excluding pauses, ranged from 0.06 to 0.10 μm/s in the anterograde direction (average, 0.08 μm/s; n = 2) and from 0.13 to 0.60 μm/s in the retrograde direction (average, 0.32 μm/s; n = 15). An example of the movement of a fluorescent dot is shown in Figure 7. Many dots exhibited brief reversals of direction, but we did not observe any reversals that were sustained for a distance of > 4.1 μm or for a duration of > 10 s. The average time spent pausing was 44%. Both of the dots that moved in a net anterograde direction exhibited frequent reversals, and the magnitude of the net anterograde movement was small. One of these dots had a peak velocity of 0.83 μm/s in the retrograde direction, and the other dot had a peak velocity of 0.62 μm/s in the anterograde direction. For the dots that moved in a net retrograde direction, the peak velocities were all retrograde and ranged from 0.39 to 1.11 μm/s (average, 0.32 μm/s; n = 15). Due to the resolution limit of the light microscope, the nature of the fluorescent dots and blobs, and their relationship to each other, is presently unclear, but it is clear that they represent only a very small proportion of the total moving protein.
Figure 6.
Folding and unfolding of a fluorescent filament. A short filament is shown that moved into the photobleached region of an axon and then paused and appeared to fold and unfold. The images shown here were selected from a time-lapse movie in which images were acquired at 4-s intervals. The filament appears to fold up on itself by anterograde movement of a filament end (0–20 s), then unfold by anterograde movement of a filament end (20–28 s), and then fold up on itself again by retrograde movement of the same filament end (28–44 s). The fluorescent blob (at 20 s) measured 0.55 μm wide and 1.14 μm long. The filament behaves as though it is tethered at one end, with the other end oscillating bidirectionally about that tethered point. The white arrowheads mark the moving end of the filament. A movie of this movement can be viewed online at www.molbiolcell.org. Proximal is left, and distal is right. Scale bar = 2.5 μm. Video: This filament was also unusual in its appearance in that it had a central region that did not contain GFP-NFM, giving the appearance of two filaments separated by a gap (not apparent in the sequence shown above). We cannot exclude the possibility that this represented two separate filaments, but we believed that it most likely represented a single filament because the two fluorescent segments moved perfectly in tandem, both before and after the pause. Note the rapid anterograde movement of a second filament through the bleached region, passing the pausing filament, and the rapid retrograde movement of a third and fourth filament into the distal portion of the bleached region toward the end of the movie. Time compression = 24:1.
Figure 7.

Movement of a punctate fluorescent dot within a photobleached axon. The images shown here were selected from a time-lapse movie in which images were acquired at 4-s intervals. The dot measured 0.3 μm in diameter, which is approximately equal to the diffraction-limited resolution of the light microscope, and moved retrogradely at an average rate of 0.25 μm/s. A movie of this movement can be viewed online at www.molbiolcell.org. The white arrowheads mark the location of the dot. Together with the fluorescent blobs, the punctate fluorescent dots represented < 3% of the total fluorescent protein that moved (see text). Proximal is left, and distal is right. Scale bar = 2.5 μm. Video: The dot moved rapidly at first, then paused and jiggled backward and forward, exhibiting alternating anterograde and retrograde movements. Such erratic behavior was not unusual for the fluorescent dots. Time compression = 24:1.
DISCUSSION
We have demonstrated the movement of filaments containing GFP-tagged neurofilament protein in photobleached axons of cultured rat sympathetic neurons. The filaments moved in a rapid, infrequent, bidirectional, and highly asynchronous manner, which is similar to previous observations by ourselves and others (Wang et al., 2000; Roy et al., 2000) obtained on naturally occurring gaps in the axonal neurofilament array. Table 1 shows a detailed comparison of these data. It can be seen that there is broad similarity in the speed and directionality of movement and in the average proportion of time spent pausing. The frequency of movement was higher in the study of Roy et al. (2000), but this is probably because those authors used a different calculation method that excluded axons that exhibited no movement during the observation period (Mark Black, personal communication). The average length of the filaments was also approximately twice that observed by Roy et al. (2000), but the reason for this difference is unclear.
Table 1.
Motile behavior of neurofilaments in naturally occurring and photobleached gaps
| GFP-NFM
|
GFP-NFH
|
GFP-NFM
|
||||
|---|---|---|---|---|---|---|
| Natural Gaps
|
Natural Gaps
|
Photobleached Gaps
|
||||
| Anterograde | Retrograde | Anterograde | Retrograde | Anterograde | Retrograde | |
| Average velocity (excluding pauses) | ||||||
| Minimum (μm/s) | 0.02 | 0.15 | 0.14 | 0.11 | 0.15 | 0.17 |
| Maximum (μm/s) | 1.21 | 1.82 | 1.70 | 1.40 | 1.26 | 1.35 |
| Average (μm/s) | 0.38 | 0.49 | 0.67 | 0.57 | 0.56 | 0.62 |
| n | 57 | 12 | 52 | 21 | 50 | 22 |
| Peak velocity | ||||||
| Minimum (μm/s) | 0.17 | 0.21 | 0.33 | 0.20 | 0.36 | 0.48 |
| Maximum (μm/s) | 1.69 | 2.28 | 2.16 | 2.98 | 1.70 | 2.77 |
| Average (μm/s) | 0.74 | 0.89 | 1.14 | 1.33 | 1.07 | 1.52 |
| n | 57 | 12 | 42 | 20 | 50 | 22 |
| Direction of movement | 83% | 17% | 71% | 29% | 69% | 31% |
| Net velocity (excluding pauses) | 0.23 μm/s anterograde | 0.30 μm/s anterograde | 0.18 μm/s anterograde | |||
| Average time pausing | 73% | 80% | 67% | |||
| Filament length | ||||||
| Minimum (μm) | 1.0 | 1.5 | 0.7 | |||
| Maximum (μm) | 15.8 | 39 | 15.8 | |||
| Average (μm) | 4.1 | 9.8 | 4.5 | |||
| n | 64 | 44 | 64 | |||
| Frequency of movement (movements/min) | 0.20 | 0.28 | 0.15 | |||
| Reference | Wang et al. (2000) | Roy et al. (2000) | This article | |||
Direct comparison of these data is possible because all three studies used very similar criteria for their analyses. Net velocity (excluding pauses) was calculated by averaging all the anterograde and retrograde movements, considering anterograde movements as positive velocities and retrograde movements as negative velocities. Direction of movement refers to the net direction of movement for the period that the filament was tracked. To calculate the average time spent pausing, the number time intervals in which the filaments moved < 0.0685 μm/s was divided by the total number of time intervals.
Due to the diffraction-limited resolution of the light microscope, we cannot be sure whether the moving filaments represent single neurofilaments or two or more neurofilaments bundled together. Nevertheless, our data demonstrate that neurofilament movement is not unique to naturally occurring gaps in the axonal neurofilament array and that these polymers move with comparable kinetics in regions of the axon that contain other neurofilaments. In addition, the data demonstrate that there was no significant perturbation of the axonal transport mechanisms caused by the photobleaching procedure.
Why Did Previous Photobleaching Studies Not Reveal Movement?
Our data demonstrate that fluorescence photobleaching can reveal the axonal transport of neurofilament polymers if care is taken to ensure that rapid asynchronous movements can be detected. The key elements of our experimental strategy are as follows: 1) the use of thin axons, which can be bleached sufficiently to allow the detection of the moving polymers without causing photodamage; 2) the use of short time-lapse intervals, which enables the observation of rapid movements; and 3) the use of long bleached regions, which enables entire filaments to be observed while they are moving. In recent years, fluorescence photobleaching appears to have fallen into disfavor for studies on slow axonal transport because of the repeated failure of studies that have used this technique to detect movement (see INTRODUCTION). Our data indicate that the failure of those studies may not have been due to the photobleaching technique per se, but the manner in which it was used. Specifically, we propose that previous photobleaching studies were unable to detect the movement of axonal neurofilaments because they were designed with the expectation of a slow and synchronous movement, and consequently no special effort was made to ensure that rapid and asynchronous movements could be detected (Brown, 2000). If performed in the manner that we describe, fluorescence photobleaching may actually prove to be a powerful tool for studies on slow axonal transport, and one that may be capable of detecting the axonal transport of other cytoskeletal and cytosolic proteins in addition to neurofilaments.
Fluorescence Recovery After Photobleaching
Previous photobleaching studies on cytoskeletal proteins in axons have observed that the bleached zone gradually recovers its fluorescence. This recovery has been assumed to reflect exclusively the “turnover” of cytoskeletal polymers (i.e., the diffusion of fluorescent cytoskeletal subunits into the bleached region and the exchange of these fluorescent subunits with bleached subunits in the polymers). For example, Hirokawa and colleagues have used laser photobleaching to investigate the turnover of neurofilament polymers in axons of cultured neurons. The average half-time of recovery was ∼ 34 min for NF-L and ∼ 19 min for NF-H (Takeda et al., 1994), but the recovery was more rapid in growing axons than in nongrowing axons (Okabe et al., 1993). These data indicated that neurofilaments are dynamic polymers and that the dynamics are modulated by the rate of axonal growth. We have not investigated the recovery of fluorescence after photobleaching in our experimental system, but our observations on the motile behavior of neurofilaments suggest that pausing of fluorescent filaments in the bleached region could contribute to this fluorescence recovery. An example of this can be seen in movie 1 of Wang et al. (2000), in which two neurofilaments moved into a naturally occurring gap in the axonal neurofilament array and then paused, filling the gap almost entirely. If the movement of neurofilaments could contribute to the recovery of fluorescence after photobleaching, then it is possible that neurofilaments may turn over more slowly than previously thought, and that differences in the rate of recovery in growing and nongrowing axons could reflect differences in axonal transport in addition to differences in assembly dynamics. Thus, we believe that caution should be exercised in making inferences about neurofilament assembly dynamics based on the rate of fluorescence recovery after photobleaching, unless the relative contributions of transport and turnover to the recovery are known.
Comparison of Laser and Nonlaser Photobleaching Methods
Most photobleaching studies on slow axonal transport have used lasers to bleach the fluorescence, with radiant intensities ranging from 2.7 to 60 MW/m2 and exposures ranging from 8 to 300 ms. In the present study, we used a standard mercury arc lamp with a lower radiant intensity of 600 kW/m2 and longer exposures ranging from 12 to 60 s. Such exposures are clearly far too long for FRAP studies on diffusion, but they do not appear to be a problem for studies on slow axonal transport because of the infrequent and highly asynchronous nature of the movement. In addition, our approach also has a practical advantage in that it can be performed with a conventional epifluorescence microscope (at a fraction of the cost of laser bleaching equipment), and the size of the bleached zone can be adjusted readily because it is determined by an aperture diaphragm rather than by a fixed lens. Thus, while lasers clearly offer the advantage of higher radiant intensities and shorter bleaching times, they are not essential for photobleaching studies on slow axonal transport.
Neurofilament Proteins Move Predominantly as Assembled Polymers
In the present study, 79% of the fluorescent structures that moved through the photobleached regions were fluorescent filaments, ranging from 0.7 to 15.8 μm in length. The remaining 21% of the moving structures were punctate fluorescent blobs and dots, but due to their small size these structures represented < 3% of the total fluorescent neurofilament protein that moved. In addition, these structures also moved almost exclusively in a retrograde direction. Thus neurofilament polymers represented ≥ 97% of the total moving neurofilament protein in these axons, and > 99% of the neurofilament protein that moved anterogradely.
The nature and physiological significance of the fluorescent dots and blobs is presently unclear. These structures were more numerous in the present study on photobleached axons (21%) than in our previous study on naturally occurring gaps (5%; see Wang et al., 2000), but they do not appear to be an artifact of the photobleaching process because most of them (15 of 19) originated outside of the photobleached gap and moved into the gap after the bleaching exposure. The fact that we observed more of these structures in our present study could reflect regional differences within the neurons. Our previous study was performed in the most distal regions of the axonal arbor where the axons are thinnest (Wang et al., 2000), whereas in the present study we were not limited to axons that were quite so thin, and thus we generally observed movement in more medial regions of the axonal arbor.
The movement of punctate structures containing neurofilament protein also has been observed in NB2a/d1 neuroblastoma cells by Shea and colleagues (Yabe et al., 1999; Yabe et al., 2001) and in extruded squid axoplasm by Goldman and colleagues (Prahlad et al., 2000). Both groups have proposed that these punctate structures may represent nonfilamentous precursors of neurofilament assembly that are transported along axons in a non-membrane–bound form, which perhaps is analogous to the nonfilamentous vimentin dots that have been observed to move in spreading non-neuronal cells (Prahlad et al., 1998). However, the relationship between the punctate structures observed by the Goldman and Shea labs and the dots and blobs observed in our studies remains to be established. Our observations indicate that filamentous structures can fold up into blob-shaped structures, so it is possible that the blobs could represent short neurofilament polymers that have folded or looped back on themselves during their movement along the axon. On the other hand, it is also possible that the dots and/or blobs could represent autophagosomes, which can incorporate cytoskeletal proteins and have been shown to move in a predominantly retrograde direction in axons of cultured nerve cells (Hollenbeck and Bray, 1986; Hollenbeck, 1993; Chang et al., 1999).
The form in which cytoskeletal proteins move in axons has been the subject of controversy for many years (Baas and Brown, 1997; Hirokawa et al., 1997). Some have argued for the movement of assembled polymers (Tytell et al., 1981; Lasek et al., 1984; Lasek, 1986; Terasaki et al., 1995; Ahmad and Baas, 1995; Yu and Baas, 1995; Yu et al., 1996; Slaughter et al., 1997; Ahmad et al., 1998; Galbraith et al., 1999), whereas others have argued for the movement of subunits or small oligomers (Bamburg et al., 1986; Sabry et al., 1995; Takeda et al., 1995; Terada et al., 1996; Funakoshi et al., 1996; Miller and Joshi, 1996; Galbraith et al., 1999; Chang et al., 1999; Terada et al., 2000). It is possible that neurofilament proteins could be transported in both filamentous and nonfilamentous forms in axons, but our observations (Wang et al., 2000; present study) and those of Roy et al. (2000) on GFP-tagged neurofilament proteins suggest that neurofilament polymers are the predominant form in which these proteins are transported, at least in cultured rat sympathetic neurons.
How Do Neurofilament Polymers Move in Axons?
The rapid rate at which neurofilaments move in axons suggests that these polymers could be conveyed by molecular motor proteins similar to those that move membranous organelles in fast axonal transport. In support of this, dynein, dynactin, and several putative kinesin-related proteins all have been shown to copurify with the neurofilaments from bovine spinal cord, and antibodies and pharmacological inhibitors of dynein have been shown to partially inhibit the movement of neurofilaments along microtubules in vitro (Shah et al., 2000). Kinesin also has been shown to colocalize with motile punctate structures containing neurofilament protein in NB2a/d1 neuroblastoma cells (Yabe et al., 1999) and in extruded squid axoplasm (Prahlad et al., 2000). These observations lend support to the possibility that axonal neurofilaments (and also perhaps other neurofilament protein–containing structures) may move along microtubules, propelled by the action of dynein- and kinesin-related proteins. Precedent for such a motile mechanism comes from studies on vimentin, which associates with microtubules in a kinesin-dependent manner (Gyoeva and Gelfand, 1991; Liao and Gundersen, 1998; Kreitzer et al., 1999) and is believed to be transported along microtubules by kinesin in nonneuronal cells (Prahlad et al., 1998). Thus, the principal difference between fast and slow axonal transport may not be the motile mechanism per se, but rather the frequency of movement and the nature of the cargo (Brown, 2000).
The significance of the retrograde movement of neurofilaments in axons is presently unclear. It is possible that there are distinct populations of anterogradely and retrogradely moving neurofilaments, as has been proposed by Griffin and colleagues (Glass and Griffin, 1991; Watson et al., 1993; Glass and Griffin, 1994), but experiments on the accumulation of axonally transported neurofilament proteins at axonal constrictions indicate that any net retrograde component does not exceed 5% of the total transported protein (Koehnle and Brown, 1999). This suggests that many of the retrogradely moving neurofilaments that we observed eventually reversed direction and moved in a net anterograde direction. We were unable to test this hypothesis directly because we could only track filaments for short periods of time, but our analyses do indicate that sustained reversals were actually relatively rare. For example, we observed a total of 156 min of movement for the 72 filaments that we analyzed, yet we did not observe a single reversal that was sustained for more than 4.1 μm or 5 s. Even when the movement of a neurofilament was interrupted by a prolonged pause, the direction of movement after the pause was almost always the same as the direction of movement before the pause. These observations suggest that most neurofilaments have a preferred direction of movement that can persist for many minutes regardless of whether the filament moves or pauses. One possible explanation for this behavior is that neurofilaments may be capable of forming persistent associations with motor proteins of a particular directionality. Whether such associations exist and how they might be regulated are intriguing questions for future study.
A striking feature of the movement of neurofilaments in axons, which is confirmed by the present study, is that these polymers spend most of their time not moving. For example, in the present study the filaments that we tracked spent 67% of their time pausing, and this is likely to be an underestimate for the entire neurofilament population because we restricted our analyses to filaments that moved and excluded filaments that remained paused throughout the entire observation period. In fact, comparison of the average rate of movement of neurofilaments with the average rate of movement of slow axonal transport (obtained from radioisotopic pulse labeling studies) suggests that neurofilaments may actually spend as much as 99% of their time pausing during their journey along the axon (Brown, 2000). This has important implications for the mechanism of slow axonal transport because it indicates that the overall transport rate is determined not only by the rate at which the filaments move, but also the proportion of their time that they spend moving. Thus, while it is clearly important to understand the molecular mechanism of movement, a complete understanding of the mechanism of slow axonal transport will also require an understanding of the molecular mechanism of pausing.
Supplementary Material
ACKNOWLEDGMENTS
We thank Yanping Yan for her assistance with the data analysis and Simona Aizicovici for technical assistance. This research was funded by a grant from the National Institute of Neurological Disorders and Stroke to A.B.
Abbreviations used:
- GFP
green fluorescent protein
- NFM
neurofilament protein M
Footnotes
REFERENCES
- Ahmad FJ, Baas PW. Microtubules released from the neuronal centrosome are transported into the axon. J Cell Sci. 1995;108:2761–2769. doi: 10.1242/jcs.108.8.2761. [DOI] [PubMed] [Google Scholar]
- Ahmad FJ, Echeverri CJ, Vallee RB, Baas PW. Cytoplasmic dynein and dynactin are required for the transport of microtubules into the axon. J Cell Biol. 1998;140:391–401. doi: 10.1083/jcb.140.2.391. [DOI] [PMC free article] [PubMed] [Google Scholar]
- Baas PW, Brown A. Slow axonal transport: the polymer transport model. Trends Cell Biol. 1997;7:380–384. doi: 10.1016/S0962-8924(97)01148-3. [DOI] [PubMed] [Google Scholar]
- Bamburg JR, Bray D, Chapman K. Assembly of microtubules at the tip of growing axons. Nature. 1986;321:788–790. doi: 10.1038/321788a0. [DOI] [PubMed] [Google Scholar]
- Brown A. Slow axonal transport: stop and go traffic in the axon. Nat Rev Mol Cell Biol. 2000;1:153–156. doi: 10.1038/35040102. [DOI] [PubMed] [Google Scholar]
- Brown A, Slaughter T, Black MM. Newly assembled microtubules are concentrated in the proximal and distal regions of growing axons. J Cell Biol. 1992;119:867–882. doi: 10.1083/jcb.119.4.867. [DOI] [PMC free article] [PubMed] [Google Scholar]
- Chang S, Svitkina TM, Borisy GG, Popov SV. Speckle microscopic evaluation of microtubule transport in growing nerve processes. Nat Cell Biol. 1999;1:399–403. doi: 10.1038/15629. [DOI] [PubMed] [Google Scholar]
- Chang SH, Rodionov VI, Borisy GG, Popov SV. Transport and turnover of microtubules in frog neurons depend on the pattern of axonal growth. J Neurosci. 1998;18:821–829. doi: 10.1523/JNEUROSCI.18-03-00821.1998. [DOI] [PMC free article] [PubMed] [Google Scholar]
- Funakoshi T, Takeda S, Hirokawa N. Active transport of photoactivated tubulin molecules in growing axons revealed by new electron microscopic analyses. J Cell Biol. 1996;133:1347–1354. doi: 10.1083/jcb.133.6.1347. [DOI] [PMC free article] [PubMed] [Google Scholar]
- Galbraith JA, Reese TS, Schlief ML, Gallant PE. Slow transport of unpolymerized tubulin and polymerized neurofilament in the squid giant axon. Proc Natl Acad Sci USA. 1999;96:11589–11594. doi: 10.1073/pnas.96.20.11589. [DOI] [PMC free article] [PubMed] [Google Scholar]
- Glass JD, Griffin JW. Neurofilament redistribution in transected nerves: evidence for bidirectional transport of neurofilaments. J Neurosci. 1991;11:3146–54. doi: 10.1523/JNEUROSCI.11-10-03146.1991. [DOI] [PMC free article] [PubMed] [Google Scholar]
- Glass JD, Griffin JW. Retrograde transport of radiolabeled cytoskeletal proteins in transected nerves. J Neurosci. 1994;14:3915–3921. doi: 10.1523/JNEUROSCI.14-06-03915.1994. [DOI] [PMC free article] [PubMed] [Google Scholar]
- Gyoeva FK, Gelfand VI. Coalignment of vimentin intermediate filaments with microtubules depends on kinesin. Nature. 1991;353:445–448. doi: 10.1038/353445a0. [DOI] [PubMed] [Google Scholar]
- Hawrot E, Patterson PH. Long-term culture of dissociated sympathetic neurons. Methods Enzymol. 1979;58:574–584. doi: 10.1016/s0076-6879(79)58174-9. [DOI] [PubMed] [Google Scholar]
- Hirokawa N, Terada S, Funakoshi T, Takeda S. Slow axonal transport: the subunit transport model. Trends Cell Biol. 1997;7:384–388. doi: 10.1016/S0962-8924(97)01133-1. [DOI] [PubMed] [Google Scholar]
- Hollenbeck PJ. Products of endocytosis and autophagy are retrieved from axons by regulated retrograde organelle transport. J Cell Biol. 1993;121:305–315. doi: 10.1083/jcb.121.2.305. [DOI] [PMC free article] [PubMed] [Google Scholar]
- Hollenbeck PJ, Bray D. Rapidly transported organelles containing membrane and cytoskeletal components: their relation to axonal growth. J Cell Biol. 1986;105:2827–2835. doi: 10.1083/jcb.105.6.2827. [DOI] [PMC free article] [PubMed] [Google Scholar]
- Keith CH. Slow transport of tubulin in the neurites of differentiated PC12 cells. Science. 1987;235:337–339. doi: 10.1126/science.2432662. [DOI] [PubMed] [Google Scholar]
- Koehnle TJ, Brown A. Slow axonal transport of neurofilament protein in cultured neurons. J Cell Biol. 1999;144:447–458. doi: 10.1083/jcb.144.3.447. [DOI] [PMC free article] [PubMed] [Google Scholar]
- Kreitzer G, Liao G, Gundersen GG. Detyrosination of tubulin regulates the interaction of intermediate filaments with microtubules in vivo via a kinesin-dependent mechanism. Mol Biol Cell. 1999;10:1105–18. doi: 10.1091/mbc.10.4.1105. [DOI] [PMC free article] [PubMed] [Google Scholar]
- Lasek RJ. Polymer sliding in axons. J Cell Sci Suppl. 1986;5:161–179. doi: 10.1242/jcs.1986.supplement_5.10. [DOI] [PubMed] [Google Scholar]
- Lasek RJ, Garner JA, Brady ST. Axonal transport of the cytoplasmic matrix. J Cell Biol. 1984;99:212s–221s. doi: 10.1083/jcb.99.1.212s. [DOI] [PMC free article] [PubMed] [Google Scholar]
- Liao GJ, Gundersen GG. Kinesin is a candidate for cross-bridging microtubules and intermediate filaments: selective binding of kinesin to detyrosinated tobulin and vimentin. J Biol Chem. 1998;273:9797–9803. doi: 10.1074/jbc.273.16.9797. [DOI] [PubMed] [Google Scholar]
- Lim S-S, Edson KJ, Letourneau PC, Borisy GG. A test of microtubule translocation during neurite elongation. J Cell Biol. 1990;111:123–130. doi: 10.1083/jcb.111.1.123. [DOI] [PMC free article] [PubMed] [Google Scholar]
- Lim S-S, Sammak PJ, Borisy GG. Progressive and spatially differentiated stability of microtubules in developing neuronal cells. J Cell Biol. 1989;109:253–263. doi: 10.1083/jcb.109.1.253. [DOI] [PMC free article] [PubMed] [Google Scholar]
- Miller KW, Joshi HC. Tubulin transport in neurons. J Cell Biol. 1996;133:1355–1366. doi: 10.1083/jcb.133.6.1355. [DOI] [PMC free article] [PubMed] [Google Scholar]
- Okabe S, Hirokawa N. Turnover of fluorescently labeled tubulin and actin in the axon. Nature. 1990;343:479–482. doi: 10.1038/343479a0. [DOI] [PubMed] [Google Scholar]
- Okabe S, Hirokawa N. Differential behavior of photoactivated microtubules in growing axons of mouse and frog neurons. J Cell Biol. 1992;117:105–120. doi: 10.1083/jcb.117.1.105. [DOI] [PMC free article] [PubMed] [Google Scholar]
- Okabe S, Hirokawa N. Do photobleached fluorescent microtubules move?: re-evaluation of fluorescence laser photobleaching both in vitro and in growing Xenopus axons. J Cell Biol. 1993;120:1177–1186. doi: 10.1083/jcb.120.5.1177. [DOI] [PMC free article] [PubMed] [Google Scholar]
- Okabe S, Miyasaka H, Hirokawa N. Dynamics of the neuronal intermediate filaments. J Cell Biol. 1993;121:375–386. doi: 10.1083/jcb.121.2.375. [DOI] [PMC free article] [PubMed] [Google Scholar]
- Prahlad V, Helfand BT, Langford GM, Vale RD, Goldman RD. Fast transport of neurofilament protein along microtubules in squid axoplasm. J Cell Sci. 2000;113:3939–3946. doi: 10.1242/jcs.113.22.3939. [DOI] [PubMed] [Google Scholar]
- Prahlad V, Yoon M, Moir RD, Vale RD, Goldman RD. Rapid movements of vimentin on microtubule tracks: kinesin-dependent assembly of intermediate filament networks. J Cell Biol. 1998;143:159–170. doi: 10.1083/jcb.143.1.159. [DOI] [PMC free article] [PubMed] [Google Scholar]
- Reinsch SS, Mitchison TJ, Kirschner MW. Microtubule polymer assembly and transport during axonal elongation. J Cell Biol. 1991;115:365–379. doi: 10.1083/jcb.115.2.365. [DOI] [PMC free article] [PubMed] [Google Scholar]
- Roy S, Coffee P, Smith G, Liem RKH, Brady ST, Black MM. Neurofilaments are transported rapidly but intermittently in axons: implications for slow axonal transport. J Neurosci. 2000;20:6849–6861. doi: 10.1523/JNEUROSCI.20-18-06849.2000. [DOI] [PMC free article] [PubMed] [Google Scholar]
- Sabry J, O'Connor TP, Kirschner MW. Axonal transport of tubulin in Ti1 pioneer neurons in situ. Neuron. 1995;14:1247–1256. doi: 10.1016/0896-6273(95)90271-6. [DOI] [PubMed] [Google Scholar]
- Shah JV, Flanagan LA, Janmey PA, Leterrier J-F. Bidirectional translocation of neurofilaments along microtubules mediated in part by dynein/dynactin. Mol Biol Cell. 2000;11:3495–3508. doi: 10.1091/mbc.11.10.3495. [DOI] [PMC free article] [PubMed] [Google Scholar]
- Slaughter T, Wang J, Black MM. Microtubule transport from the cell body into the axons of growing neurons. J Neurosci. 1997;17:5807–5819. doi: 10.1523/JNEUROSCI.17-15-05807.1997. [DOI] [PMC free article] [PubMed] [Google Scholar]
- Takeda S, Funakoshi T, Hirokawa N. Tubulin dynamics in neuronal axons of living zebrafish embryos. Neuron. 1995;14:1257–1264. doi: 10.1016/0896-6273(95)90272-4. [DOI] [PubMed] [Google Scholar]
- Takeda S, Okabe S, Funakoshi T, Hirokawa N. Differential dynamics of neurofilament-H protein and neurofilament-L protein in neurons. J Cell Biol. 1994;127:173–185. doi: 10.1083/jcb.127.1.173. [DOI] [PMC free article] [PubMed] [Google Scholar]
- Terada S, Kinjo M, Hirokawa N. Oligomeric tubulin in large transporting complex is transported via kinesin in squid giant axons. Cell. 2000;103:141–55. doi: 10.1016/s0092-8674(00)00094-5. [DOI] [PubMed] [Google Scholar]
- Terada S, Nakata T, Peterson AC, Hirokawa N. Visualization of slow axonal transport in vivo. Science. 1996;273:784–788. doi: 10.1126/science.273.5276.784. [DOI] [PubMed] [Google Scholar]
- Terasaki M, Schmidek A, Galbraith JA, Gallant PE, Reese TS. Transport of cytoskeletal elements in the squid giant axon. Proc Natl Acad Sci USA. 1995;92:11500–11503. doi: 10.1073/pnas.92.25.11500. [DOI] [PMC free article] [PubMed] [Google Scholar]
- Tytell M, Black MM, Garner JA, Lasek RJ. Axonal transport: each major component reflects the movement of distinct macromolecular complexes. Science. 1981;214:179–181. doi: 10.1126/science.6169148. [DOI] [PubMed] [Google Scholar]
- Wang L, Ho C-L, Sun D, Liem RKH, Brown A. Rapid movement of axonal neurofilaments interrupted by prolonged pauses. Nat Cell Biol. 2000;2:137–141. doi: 10.1038/35004008. [DOI] [PubMed] [Google Scholar]
- Waterman-Storer CM, Salmon ED. How microtubules get fluorescent speckles. Biophys J. 1998;75:2059–2069. doi: 10.1016/S0006-3495(98)77648-9. [DOI] [PMC free article] [PubMed] [Google Scholar]
- Watson DF, Glass JD, Griffin JW. Redistribution of cytoskeletal proteins in mammalian axons disconnected from their cell bodies. J Neurosci. 1993;13:4354–4360. doi: 10.1523/JNEUROSCI.13-10-04354.1993. [DOI] [PMC free article] [PubMed] [Google Scholar]
- Yabe JT, Chan WK-H, Chylinski TM, Lee S, Pimenta A, Shea TB. The predominant form in which neurofilament subunits undergo axonal transport varies during axonal initiation, elongation and maturation. Cell Motil Cytoskeleton. 2001;48:61–83. doi: 10.1002/1097-0169(200101)48:1<61::AID-CM6>3.0.CO;2-S. [DOI] [PubMed] [Google Scholar]
- Yabe JT, Pimenta A, Shea TB. Kinesin-mediated transport of neurofilament protein oligomers in growing axons. J Cell Sci. 1999;112:3799–3814. doi: 10.1242/jcs.112.21.3799. [DOI] [PubMed] [Google Scholar]
- Yu W, Baas PW. The growth of the axon is not dependent upon net microtubule assembly at its distal tip. J Neurosci. 1995;15:6827–6833. doi: 10.1523/JNEUROSCI.15-10-06827.1995. [DOI] [PMC free article] [PubMed] [Google Scholar]
- Yu W, Schwei MJ, Baas PW. Microtubule transport and assembly during axon growth. J Cell Biol. 1996;133:151–157. doi: 10.1083/jcb.133.1.151. [DOI] [PMC free article] [PubMed] [Google Scholar]
Associated Data
This section collects any data citations, data availability statements, or supplementary materials included in this article.