Abstract
Thyroid cancer (TC) is the most common endocrine malignancy, accounting for approximately 90% of all malignancies of the endocrine system. Despite the fact that patients with TC tend to have good prognoses, the high incidence rate and lymph node metastases remain unresolved issues. Autophagy is an indispensable process that maintains intracellular homeostasis; however, the role of autophagy in several steps of the initiation and progression of TC has not yet been elucidated. In this study, we first identified several autophagy-related genes (ARGs) that were provoked in the onset of TC. Subsequently, a bioinformatics analysis hinted that these genes were markedly disturbed in several proliferative signaling pathways. Moreover, we demonstrated that the differentially expressed ARGs were closely related to several aggressive clinical manifestations, including an advanced tumor stage and lymph node metastasis. Our study further selected prognostic ARGs and developed a prognostic signature based on three key genes (ATG9B, BID and B1DNAJB1), which displayed a moderate ability to predict the prognosis of TC. On the whole, the findings of this study demonstrate that ARGs disrupt proliferation-related pathways and consequently lead to aggressive clinical manifestations. These findings provide insight into the potential molecular mechanisms of action of ARGs and their clinical significance, and also provide classification information of potential therapeutic significance.
Keywords: autophagy, thyroid cancer, lymph node metastasis, prognosis, bioinformatics analysis
Introduction
Thyroid cancer (TC) is the most common endocrine malignancy, accounting for approximately 90% of all malignancies of the endocrine system (1,2). The morbidity associated with TC is exceedingly high, and an increasing number of asymptomatic TC cases are detected due to the wide use of routine high-resolution ultrasonography (3,4). In the United States, it is estimated that 53,990 cases of TC will be diagnosed in 2018 (2). In fact, TC has become the fifth most common type of cancer affecting women. Despite the fact that TC exhibits an indolent and non-aggressive behavior in the majority of cases, the high incidence rate and several grievous clinical manifestations, such as lymph node metastases, remain unresolved issues (4–6). Based on the histopathology, TC is classified into four main tumor types, including papillary thyroid cancer (PTC), follicular thyroid carcinoma (FTC), medullary thyroid carcinoma (MTC) and anaplastic thyroid cancer (ATC) (7,8). The different subtypes of TC have enormous heterogeneity in terms of their morphological characteristics and prognoses. Although PTC is the predominant type, accounting for 80% of all TCs, it presents a favorable prognostic tendency overall; however, the specific situation of each patient with PTC is not the same (9,10). Therefore, there is an urgent need to further reveal the molecular pathogenesis of TC.
Autophagy is a highly conserved ‘self-devouring’ process that ensures the orderly degradation of the cytoplasmic contents and the recycling of the macromolecular constituents to maintain cellular homeostasis (11). Considering the fundamental roles of autophagy in regulating cellular biological processes, it is no surprise that it plays essential roles in a wide spectrum of physiological conditions and diseases, particularly cancer (12–15). Moreover, exploring the potential mechanisms of action of autophagy would not only expose the mysterious veil of tumorigenesis, but may also aid in the identification of novel therapeutic targets for autophagy in cancer (16). Several studies have reported the probability of harnessing autophagy in the development of cancer (16–18). As regards TC, autophagy-targeted therapy is now considered to be a valuable strategy, as the regulation of the autophagy level can mediate the chemosensitivity and radiosensitivity of TC cells and can markedly affect the regulation of apoptosis (19). For example, Wang et al found that targeting autophagy sensitized BRAF-mutant TC to vemurafenib (20). In addition, it has been suggested that rapamycin can inhibit the invasive ability of TC cells (21). However, these previous studies only examined single oncogenes or suppressor genes in TCs, which reflect the partial functions of autophagy. There are very few systematic comprehensive analyses addressing the clinical significance and potential biological process of autophagy in TC (22,23).
The Human Autophagy Database (HADb) offers an exhaustive and up-to-date list of autophagy-related genes (ARGs) to satisfy the needs of researchers (24). Previously, Zhang et al calculated 74 differentially expressed ARGs, and two of these were associated with the prognosis of patients with glioma (25). However, the clinical values of 234 ARGs in TC remain unclarified. In this study, we described the expression profiles of 234 ARGs, and we identified a class of ARGs with disrupted expression statuses in the onset of TC based on the Cancer Genome Atlas (TCGA) database. Notably, we also identified the biological process pathways enriched by these genes, which may help in the development of more effective treatments. On the basis of the underlying proliferative functions of ARGs, we further emphasized the clinical significance of differentially expressed ARGs in providing novel insight into the clinical management of TC. The present study provides a deeper understanding of the role of autophagy in TC and may help to improve the clinical outcomes of patients with TC.
Materials and methods
Collection of ARGs
Our researchers acquired the ARGs from the HADb. Subsequently, we downloaded the TC gene expression dataset from the TCGA database, from which we extracted the expression levels of the ARGs. TCGA provided 502 TC and 52 non-tumor cases with gene expression profiles. Accordingly, the clinicopathological data of the patients with TC were also downloaded for use in the current study.
Calculation of the differentially expressed ARGs and the functional analysis of their enriched pathways
The edgeR software package was applied in this study to filter and normalize the expression profiles found in the TCGA database, aiming to analyze the differentially expressed ARGs, not only in TC tumors, but also in the adjacent normal tissues. The standard was a fold change of >2 and P<0.05 after correction. We constructed the network of protein-protein interactions (PPIs) with the help of STRING (https://string-db.org/) (26), an online database available to all, and we then input the interacting data derived from STRING to Cytoscape 3.5.1 (27) for visualization. In addition, enrichment analyses were conducted for a better comprehension of the biological functions of the differentially expressed ARGs in TC, which included the analyses of the Gene Ontology (GO), Kyoto Encyclopedia of Genes and Genomes (KEGG) pathways and Disease Ontology (DO). The enrichment analyses were carried out using the R clusterProfiler package (28) and the results were displayed with the GOplot package (29).
Prognosis index (PI) construction
A univariate Cox analysis was used to determine the genes associated with the survival time of the patients with TC. Subsequently, a univariate Cox analysis was performed to exclude the genes that failed to become independent prognostic biomarkers. Finally, a PI model was constructed with the eligible ARGs based on the formula in which the gene expression was multiplied by the regression coefficient. The Kaplan-Meier (KM) method was used to depict the differences in survival between the high-risk and low-risk groups, and a log-rank analysis was employed for the assessment. In order to investigate the mechanisms of action of ARGs that were consistent with the PI, we obtained the ARG expression, methylation, and copy number variations from the cBioPortal database (30), which provided the data of 508 patients with TC for analysis. We also assessed the ARG splicing events using the TCGA SpliceSeq database (http://bioinformatics.mdanderson.org/TCGASpliceSeq/).
Statistical analysis
SPSS Statistics for Windows version 24.0 (SPSS Inc., Chicago, IL, USA) and R 3.3.1 (https://www.r-project.org/) were utilized for the statistical analyses. R, GraphPad Prism 5 (GraphPad Software Inc., San Diego, CA, USA) and OriginPro 2017 (OriginLab Corp., Northampton, MA, USA) were used for the plotting. Following normalization, all the expression data were transformed to log2 (value +1). We employed an independent t-test to compare the differential expression levels of the ARGs in the TC and adjacent tissues, and to determine the associations between these genes and the clinicopathological characteristics of the patients with TC. Scatter diagrams and boxplots were used to display gene expression. In order to examine the ability of the differentially expressed ARGs to identify tumors, we applied GraphPad software for plotting and calculating the receiver operating characteristic (ROC) curves of each dataset and determining the area under the curve (AUC). The prognostic values of the ARGs were estimated using a univariate regression analysis; subsequently, the prognostic potentials of the ARGs were obtained using a multivariate Cox regression analysis for the construction of the PI model. Correlations between gene mRNA expression levels and methylation degree were examined by Pearson's correlation analysis. A value of P<0.05 was considered to indicate a statistically significant difference.
Results
Differentially expressed ARGs
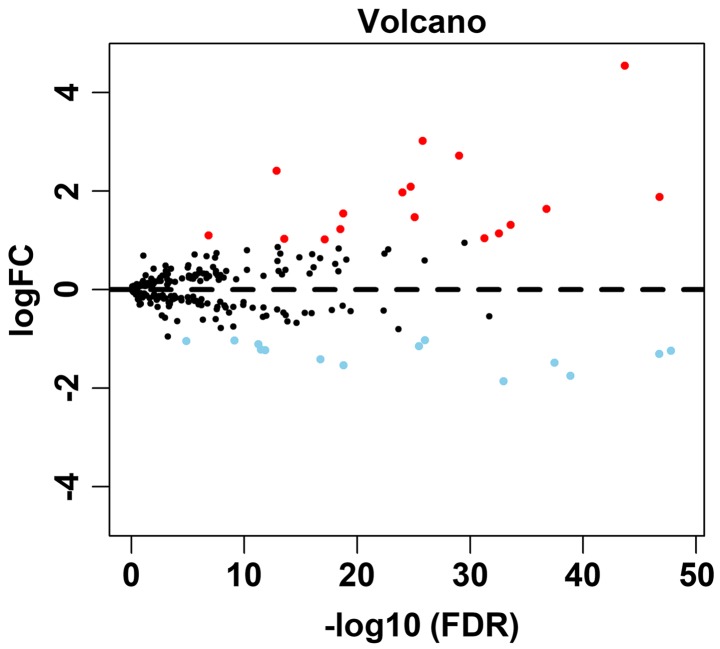
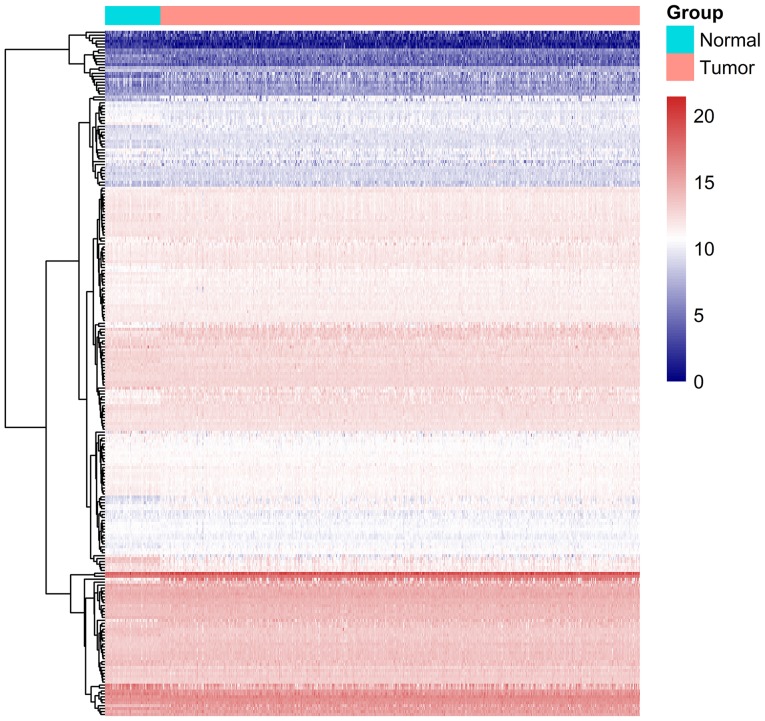
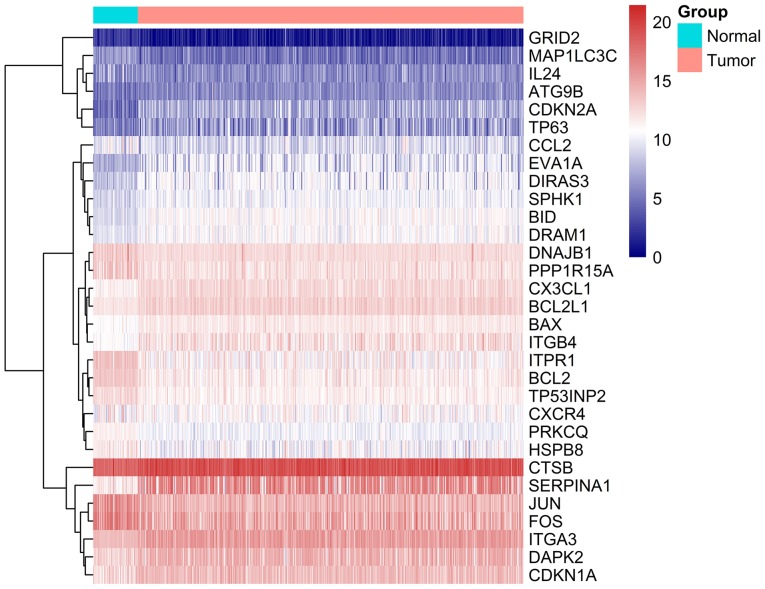
A total of 234 ARGs were obtained from the HADb database, and 502 TC cases with gene expression profiles were acquired from the TCGA database (Table I). In addition, 52 cases with adjacent normal tissue data were obtained from the TCGA database. After extracting the gene expression levels of 234 cases, we conducted the differential analysis. Conforming to the standards mentioned above, we eventually acquired 31 differentially expressed ARGs, among which 17 were upregulated, while 14 were downregulated (Figs. 1–3). All of the differentially expressed genes are listed in Table II.
Table I.
General characteristics of patients included in the present study (data downloaded from the TCGA database; number of patients for clinical significance analysis depends on the valid records).
| Variables | Number of patients | Variables | Number of patients |
|---|---|---|---|
| Age | Pathological stage | ||
| ≥60 | 120 | III–IV | 167 |
| <60 | 382 | I–II | 333 |
| Sex | T stage | ||
| Male | 135 | T3–T4 | 193 |
| Female | 367 | T1–T2 | 309 |
| Tumor status | N stage | ||
| With tumor | 44 | N1–3 | 223 |
| Tumor free | 446 | N0 | 229 |
| Primary neoplasm focus type | M stage | ||
| Multifocal | 226 | M1 | 9 |
| Unifocal | 266 | M0 | 282 |
T stage, size or direct extent of the primary tumor; N stage, degree of spread to regional lymph nodes; M stage, presence of distant metastasis.
Figure 1.
Volcano plot showing the differentially expressed genes. Red color represents upregulation and blue represents downregulation. Black color represents no differentially expressed genes.
Figure 2.
Heatmap of the 234 autophagy-related genes. Blue and red color represent the intensity of the expression level of differentially expressed genes. Blue represents a low intensity of either a low or high expression and red represents a high intensity of either a low or high expression.
Figure 3.
Heatmap of the 31 differentially expressed autophagy-related genes. Blue and red color represent the intensity of the expression level of differentially expressed genes. Blue represents a low intensity of either a low or high expression and red represents a high intensity of either a low or high expression.
Table II.
Characteristics of the differentially expressed autophagy-related genes by using edgeR (tumor vs. normal).
| Gene symbol | Entrez ID | logFC | Regulation | P-value | FDR |
|---|---|---|---|---|---|
| PRKCQ | 5588 | −1.23797 | Down | 6.81E-51 | 1.59E-48 |
| BID | 637 | 1.879533 | Up | 1.39E-49 | 1.62E-47 |
| DNAJB1 | 3337 | −1.3017 | Down | 2.27E-49 | 1.76E-47 |
| SERPINA1 | 5265 | 4.544121 | Up | 3.44E-46 | 2.00E-44 |
| JUN | 3725 | −1.74985 | Down | 2.82E-41 | 1.31E-39 |
| BCL2 | 596 | −1.48235 | Down | 8.73E-40 | 3.39E-38 |
| ITGA3 | 3675 | 1.639519 | Up | 5.04E-39 | 1.68E-37 |
| CX3CL1 | 6376 | 1.314813 | Up | 8.86E-36 | 2.58E-34 |
| ITPR1 | 3708 | −1.85687 | Down | 4.25E-35 | 1.10E-33 |
| BCL2L1 | 598 | 1.139524 | Up | 1.20E-34 | 2.80E-33 |
| BAX | 581 | 1.043169 | Up | 2.69E-33 | 5.22E-32 |
| EVA1A | 84141 | 2.717545 | Up | 5.52E-31 | 9.19E-30 |
| TP53INP2 | 58476 | −1.02698 | Down | 6.57E-28 | 1.02E-26 |
| CDKN2A | 1029 | 3.021786 | Up | 1.16E-27 | 1.59E-26 |
| PPP1R15A | 23645 | −1.14889 | Down | 2.55E-27 | 3.30E-26 |
| DRAM1 | 55332 | 1.470791 | Up | 6.77E-27 | 8.30E-26 |
| DIRAS3 | 9077 | 2.089879 | Up | 1.54E-26 | 1.80E-25 |
| ITGB4 | 3691 | 1.972199 | Up | 8.83E-26 | 9.80E-25 |
| FOS | 2353 | −1.53364 | Down | 1.92E-20 | 1.60E-19 |
| DAPK2 | 23604 | 1.544573 | Up | 2.12E-20 | 1.71E-19 |
| SPHK1 | 8877 | 1.226448 | Up | 4.12E-20 | 3.10E-19 |
| CTSB | 1508 | 1.020784 | Up | 1.17E-18 | 7.56E-18 |
| IL24 | 11009 | −1.41312 | Down | 2.78E-18 | 1.75E-17 |
| CDKN1A | 1026 | 1.033733 | Up | 6.07E-15 | 2.89E-14 |
| TP63 | 8626 | 2.410479 | Up | 3.43E-14 | 1.40E-13 |
| MAP1LC3C | 440738 | −1.22583 | Down | 3.57E-13 | 1.41E-12 |
| CCL2 | 6347 | −1.21423 | Down | 9.06E-13 | 3.35E-12 |
| CXCR4 | 7852 | −1.10962 | Down | 1.51E-12 | 5.51E-12 |
| HSPB8 | 26353 | −1.03221 | Down | 2.29E-10 | 7.50E-10 |
| ATG9B | 285973 | 1.099005 | Up | 5.72E-08 | 1.42E-07 |
| GRID2 | 2895 | −1.04415 | Down | 7.09E-06 | 1.33E-05 |
logFC, log (Fold change); FDR, false discovery rate.
Enrichment analyses of the differentially expressed ARGs
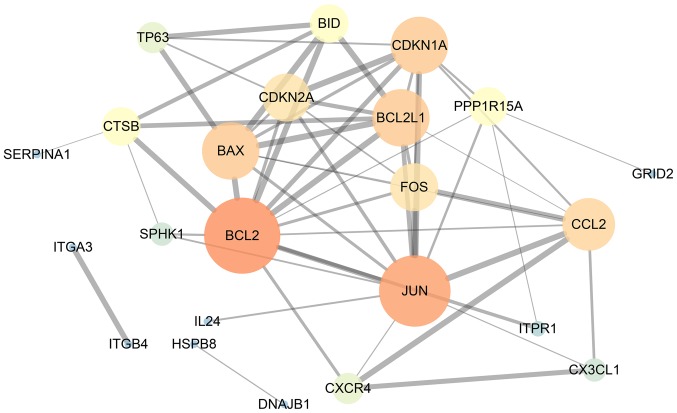
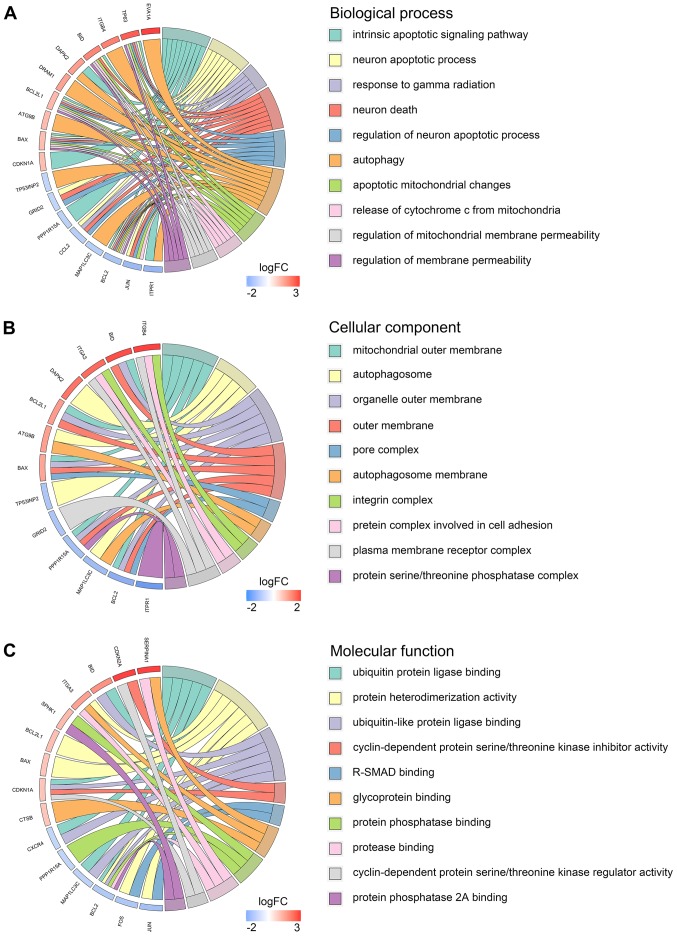
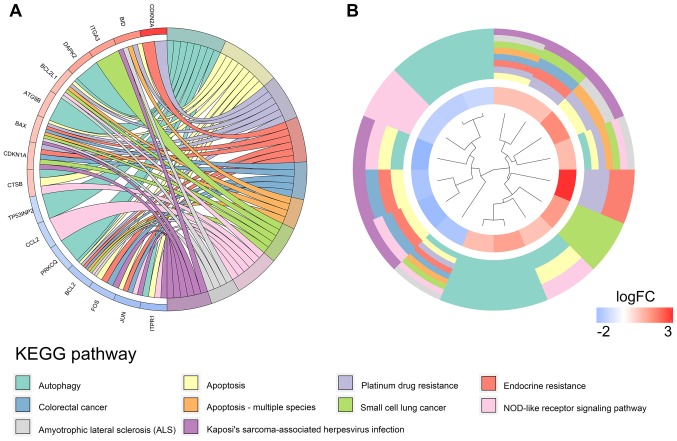
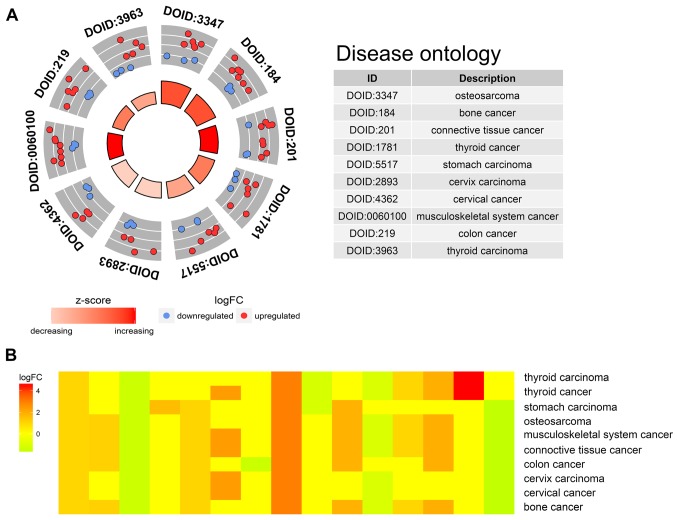
Our researchers carried out a series of gene enrichment and pathway analyses, hoping to further investigate the biological functions of autophagy in the development of TC. Using STRING and Cytoscape, we set up the PPI network for these genes (Fig. 4), and discovered the core genes, such as BCL2, JUN and CDKN1A, which cast light on the functions of autophagy in TC and laid the foundation for multi-targeted therapies. The GOplot analysis revealed that in the biological processes, these genes were related to autophagy, as well as to the intrinsic apoptotic signaling pathway, neuron apoptotic process and the response to gamma radiation (Fig. 5A). In terms of the cellular components, these genes participated in the mitochondrial outer membrane, autophagosome and organelle outer membrane functions (Fig. 5B). With regard to the molecular function, these genes played indispensable roles in certain key functions, such as ubiquitin protein ligase binding (Fig. 5C). In addition, KEGG pathway enrichment analysis indicated that these genes were mainly enriched in the pathways relevant to the cell cycle, including autophagy and apoptosis (Fig. 6). Notably, DO analysis (Fig. 7) suggested that these genes were associated with multiple tumors, other than TC, which manifested the fundamental roles of these genes in tumorigenesis and development.
Figure 4.
Protein-protein interaction network of the differentially expressed autophagy-related genes. The size of the circles represents the weight of the gene in the network. A greater size indicates a greater weight. The thickness of the lines displays the connection score between two genes. The combined score is computed by combining the probabilities from the different evidence channels. A higher score indicates a closer tie.
Figure 5.
Gene Ontology pathway analysis of the differentially expressed autophagy-related genes. (A) Biological process. (B) Cellular component. (C) Molecular function.
Figure 6.
Kyoto Encyclopedia of Genes and Genomes pathway analysis of the differentially expressed autophagy-related genes. (A) Connections between the genes and the corresponding enrichment pathways. (B) Circular heatmap of the enriched pathway.
Figure 7.
Disease Ontology (DO) analysis of the differentially expressed autophagy-related genes. (A) Top 10 significant DO terms enriched by the differentially expressed genes. Red color represents upregulation and blue represents downregulation. (B) Heatmap of enriched disease.
ARG expression in TC and the clinical significance
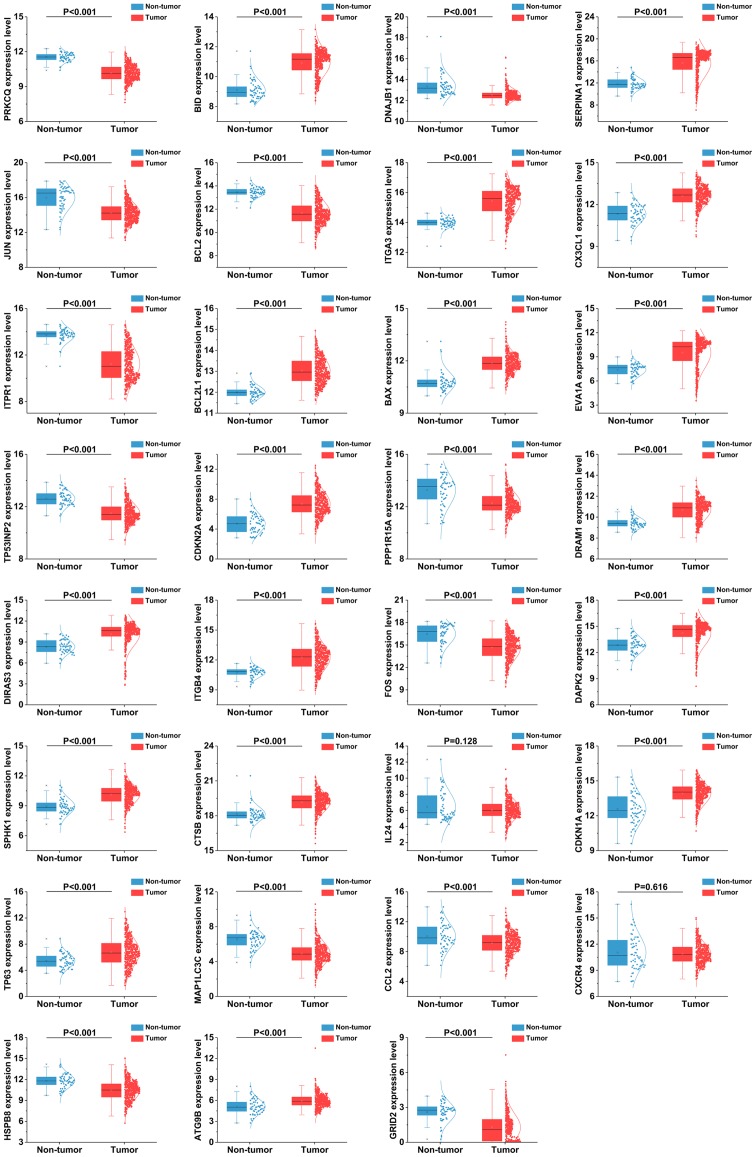
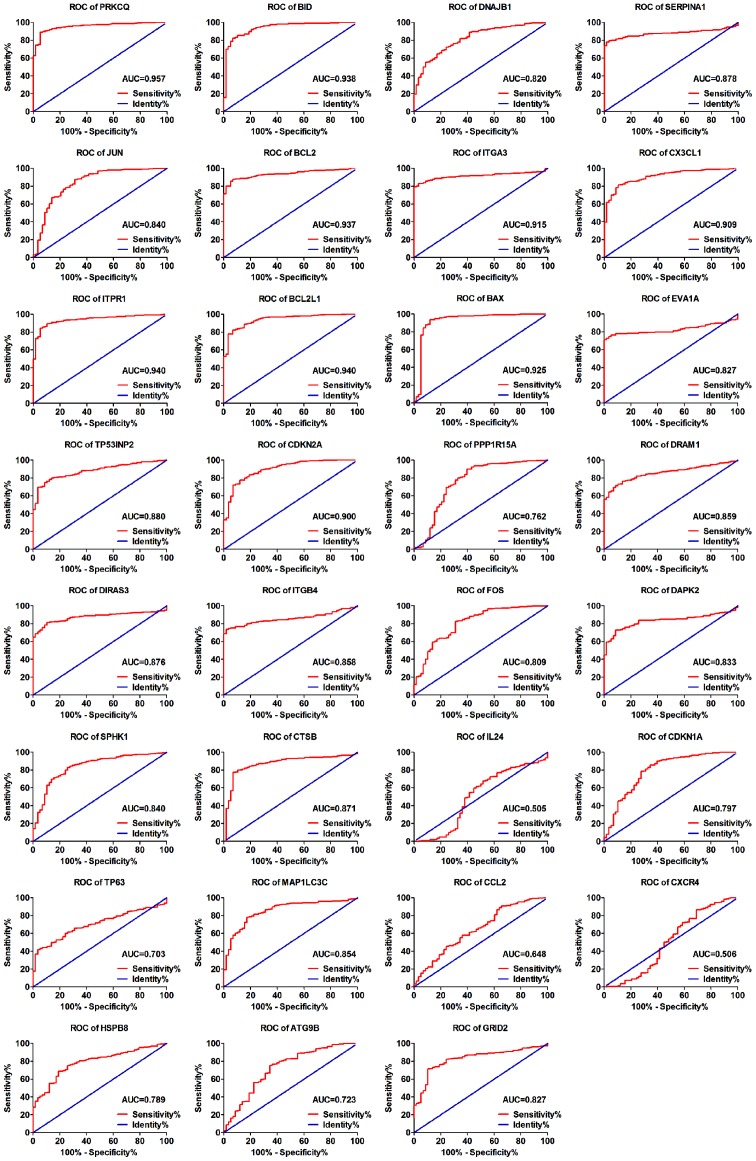
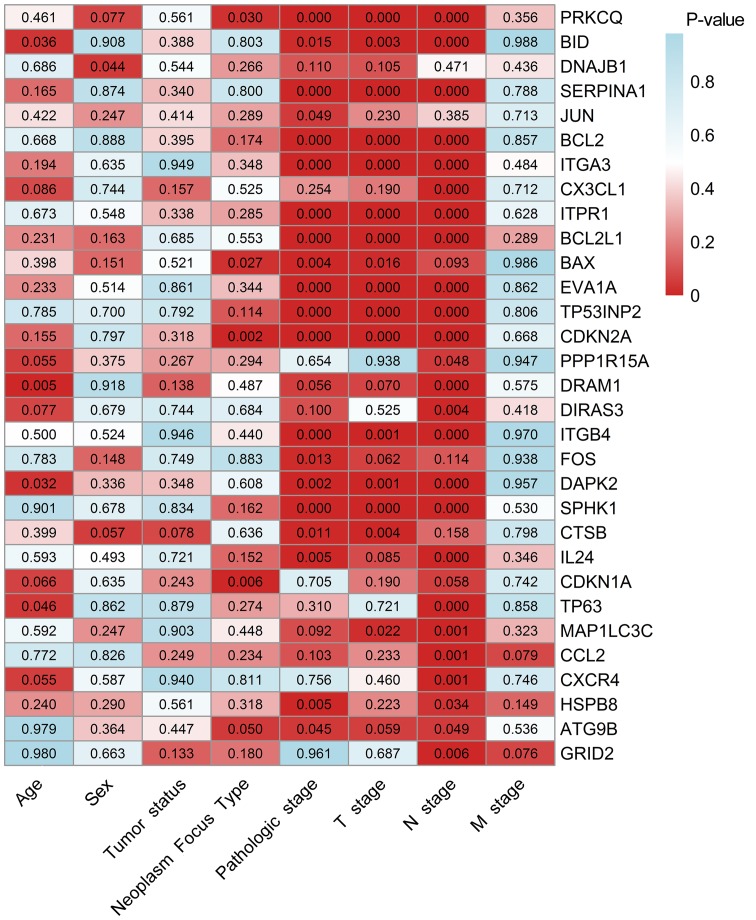
As the differentially expressed ARGs were largely enriched in tumor-related pathways, it is most likely that these genes could accelerate the development of TC. Therefore, we analyzed the expression of these genes in various clinical parameters and enquired into their associations with the clinical progress. Initially, we verified the expression of these genes in TC. The independent samples t-test and the analysis of the TCGA database indicated that the expression levels of 17 genes were markedly upregulated in the tumor tissues, including CTSB, CDKN1A, BAX, ATG9B, BCL2L1, SPHK1, CX3CL1, DRAM1, DAPK2, ITGA3, BID, ITGB4, DIRAS3, TP63, EVA1A, CDKN2A and SERPINA1. Conversely, 12 genes displayed markedly lower expression levels in the tumor tissues, including ITPR1, JUN, FOS, BCL2, NAJB1, PRKCQ, MAP1LC3C, CCL2, PPP1R15A, GRID2, HSPB8 and TP53INP2 (Fig. 8). Due to the differences between the t-test and edgeR, the IL24 and CXCR4 genes did not show statistical significance. Subsequently, we performed a ROC analysis to determine the ability to differentiate the cancerous and non-cancerous tissues. A total of 28 genes had AUC values >0.7 (Fig. 9), which suggested that these genes were useful in differentiating between cancerous and non-cancerous tissues. Based on the fact that these genes were expressed differentially in thyroid cancer, we further explored the associations between these 31 genes and some of the major clinical parameters: Age (over or under 60 years), sex (male/female), tumor recurrence (yes/no), primary tumor type (multifocal/unifocal), pathological stage (stage III, IV/stage I, II), T stage (stage III, IV/stage I, II), N stage (presence of lymphatic metastasis or not) and M stage (presence of distant metastasis or not). It was revealed that these 31 genes were closely connected with the majority of the parameters, particularly those linked with tumor progression (Table III and Fig. 10). Of these 31 genes, 25 were expressed differentially in the patients with lymphatic metastasis, and 17 displayed marked differences in expression in the T stage. However, we failed to discover the genes closely associated with distant metastasis as these samples were not sufficient for valid research (n=9).
Figure 8.
The expression patterns of the 31 differentially expressed autophagy-related genes.
Figure 9.
The receiver operating characteristic (ROC) curves of the 31 differentially expressed autophagy-related genes. AUC, area under the curve.
Table III.
Associations between the expression levels of the differentially expressed autophagy-related genes and the clinicopathological characteristics of the patients with thyroid cancer.
| Genes | Age (≥60/<60)
|
Sex (male/female)
|
Tumor status (with tumor/ tumor free)
|
Primary neoplasm focus type (multifocal/unifocal)
|
Pathological stage (III–IV/I–II)
|
T stage (T3-T4/T1-T2)
|
N stage (N1–3/N0)
|
M stage (M1/M0)
|
||||||||
|---|---|---|---|---|---|---|---|---|---|---|---|---|---|---|---|---|
| t | P | t | P | t | P | t | P | t | P | t | P | t | P | t | P | |
| PRKCQ | 0.738 | 0.461 | 1.769 | 0.077 | −0.586 | 0.561 | 2.177 | 0.030 | −4.205 | <0.001 | −4.422 | <0.001 | −7.517 | <0.001 | −0.925 | 0.356 |
| BID | −2.118 | 0.036 | 0.116 | 0.908 | −0.863 | 0.388 | 0.249 | 0.803 | 2.455 | 0.015 | 2.939 | 0.003 | 7.215 | <0.001 | 0.015 | 0.988 |
| DNAJB1 | −0.404 | 0.686 | −2.022 | 0.044 | 0.611 | 0.544 | −1.113 | 0.266 | 1.602 | 0.110 | 1.623 | 0.105 | 0.722 | 0.471 | −0.780 | 0.436 |
| SERPINA1 | −1.395 | 0.165 | −0.159 | 0.874 | −0.955 | 0.340 | −0.254 | 0.800 | 4.473 | <0.001 | 4.128 | <0.001 | 8.000 | <0.001 | −0.269 | 0.788 |
| JUN | −0.803 | 0.422 | −1.160 | 0.247 | 0.817 | 0.414 | −1.061 | 0.289 | −1.977 | 0.049 | −1.201 | 0.230 | −0.869 | 0.385 | −0.368 | 0.713 |
| BCL2 | −0.429 | 0.668 | −0.140 | 0.888 | −0.851 | 0.395 | 1.360 | 0.174 | −5.356 | <0.001 | −5.008 | <0.001 | −7.931 | <0.001 | −0.180 | 0.857 |
| ITGA3 | −1.303 | 0.194 | −0.474 | 0.635 | 0.064 | 0.949 | −0.939 | 0.348 | 4.597 | <0.001 | 4.925 | <0.001 | 8.375 | <0.001 | 0.700 | 0.484 |
| CX3CL1 | −1.720 | 0.086 | −0.327 | 0.744 | −1.417 | 0.157 | −0.636 | 0.525 | 1.142 | 0.254 | 1.311 | 0.190 | 3.531 | <0.001 | −0.369 | 0.712 |
| ITPR1 | 0.422 | 0.673 | 0.602 | 0.548 | 0.959 | 0.338 | 1.070 | 0.285 | −4.242 | <0.001 | −4.572 | <0.001 | −5.818 | <0.001 | 0.484 | 0.628 |
| BCL2L1 | −1.200 | 0.231 | 1.396 | 0.163 | −0.406 | 0.685 | −0.594 | 0.553 | 3.915 | <0.001 | 4.228 | <0.001 | 6.575 | <0.001 | −1.061 | 0.289 |
| BAX | −0.846 | 0.398 | 1.439 | 0.151 | −0.642 | 0.521 | −2.220 | 0.027 | 2.903 | 0.004 | 2.424 | 0.016 | 1.684 | 0.093 | −0.017 | 0.986 |
| EVA1A | −1.193 | 0.233 | −0.652 | 0.514 | −0.175 | 0.861 | −0.946 | 0.344 | 3.751 | <0.001 | 3.992 | <0.001 | 7.606 | <0.001 | 0.174 | 0.862 |
| TP53INP2 | 0.273 | 0.785 | 0.386 | 0.700 | 0.264 | 0.792 | 1.582 | 0.114 | −5.373 | <0.001 | −4.559 | <0.001 | −6.27 | <0.001 | −0.246 | 0.806 |
| CDKN2A | 1.427 | 0.155 | −0.257 | 0.797 | 1.009 | 0.318 | −3.076 | 0.002 | 3.555 | <0.001 | 4.166 | <0.001 | 4.892 | <0.001 | 0.429 | 0.668 |
| PPP1R15A | −1.923 | 0.055 | −0.887 | 0.375 | 1.112 | 0.267 | −1.050 | 0.294 | −0.448 | 0.654 | −0.078 | 0.938 | 1.984 | 0.048 | 0.067 | 0.947 |
| DRAM1 | −2.823 | 0.005 | 0.104 | 0.918 | −1.486 | 0.138 | 0.696 | 0.487 | 1.918 | 0.056 | 1.813 | 0.070 | 6.336 | <0.001 | −0.561 | 0.575 |
| DIRAS3 | −1.781 | 0.077 | −0.414 | 0.679 | −0.326 | 0.744 | 0.408 | 0.684 | 1.648 | 0.100 | 0.637 | 0.525 | 2.936 | 0.004 | 0.811 | 0.418 |
| ITGB4 | −0.674 | 0.500 | 0.638 | 0.524 | −0.068 | 0.946 | −0.773 | 0.440 | 3.519 | <0.001 | 3.228 | 0.001 | 6.604 | <0.001 | −0.038 | 0.970 |
| FOS | 0.275 | 0.783 | −1.45 | 0.148 | 0.320 | 0.749 | 0.147 | 0.883 | −2.484 | 0.013 | −1.871 | 0.062 | −1.584 | 0.114 | −0.078 | 0.938 |
| DAPK2 | −2.154 | 0.032 | 0.963 | 0.336 | −0.939 | 0.348 | −0.513 | 0.608 | 3.144 | 0.002 | 3.324 | 0.001 | 5.245 | <0.001 | 0.054 | 0.957 |
| SPHK1 | −0.124 | 0.901 | −0.415 | 0.678 | −0.210 | 0.834 | −1.400 | 0.162 | 5.177 | <0.001 | 4.727 | <0.001 | 5.811 | <0.001 | 0.628 | 0.530 |
| CTSB | 0.843 | 0.399 | −1.909 | 0.057 | −1.768 | 0.078 | −0.474 | 0.636 | 2.563 | 0.011 | 2.866 | 0.004 | 1.413 | 0.158 | −0.257 | 0.798 |
| IL24 | 0.535 | 0.593 | 0.686 | 0.493 | −0.357 | 0.721 | −1.435 | 0.152 | 2.83 | 0.005 | 1.724 | 0.085 | 5.371 | <0.001 | −0.944 | 0.346 |
| CDKN1A | −1.840 | 0.066 | −0.475 | 0.635 | −1.183 | 0.243 | −2.734 | 0.006 | 0.379 | 0.705 | 1.311 | 0.190 | 1.898 | 0.058 | −0.329 | 0.742 |
| TP63 | −2.005 | 0.046 | −0.174 | 0.862 | 0.152 | 0.879 | 1.096 | 0.274 | 1.017 | 0.31 | 0.358 | 0.721 | 6.862 | <0.001 | −0.185 | 0.858 |
| MAP1LC3C | 0.536 | 0.592 | −1.159 | 0.247 | 0.122 | 0.903 | −0.760 | 0.448 | −1.689 | 0.092 | −2.294 | 0.022 | −3.439 | 0.001 | −0.989 | 0.323 |
| CCL2 | 0.289 | 0.772 | −0.22 | 0.826 | −1.154 | 0.249 | −1.192 | 0.234 | 1.635 | 0.103 | 1.194 | 0.233 | 3.221 | 0.001 | −1.761 | 0.079 |
| CXCR4 | −1.925 | 0.055 | −0.543 | 0.587 | −0.075 | 0.940 | 0.239 | 0.811 | −0.311 | 0.756 | 0.739 | 0.460 | 3.417 | 0.001 | −0.325 | 0.746 |
| HSPB8 | −1.178 | 0.240 | −1.060 | 0.290 | −0.581 | 0.561 | −0.999 | 0.318 | −2.801 | 0.005 | −1.221 | 0.223 | −2.123 | 0.034 | −1.446 | 0.149 |
| ATG9B | −0.027 | 0.979 | 0.908 | 0.364 | 0.761 | 0.447 | −1.963 | 0.050 | 2.011 | 0.045 | 1.896 | 0.059 | 1.977 | 0.049 | 0.647 | 0.536 |
| GRID2 | 0.846 | 0.980 | 0.436 | 0.663 | 1.504 | 0.133 | −1.342 | 0.180 | −0.049 | 0.961 | 0.403 | 0.687 | −2.785 | 0.006 | 1.779 | 0.076 |
Figure 10.
The clinicopathological significance of the 31 differentially expressed autophagy-related genes. The number in each block represents the P-value of the statistical analysis.
ARG-based PI construction
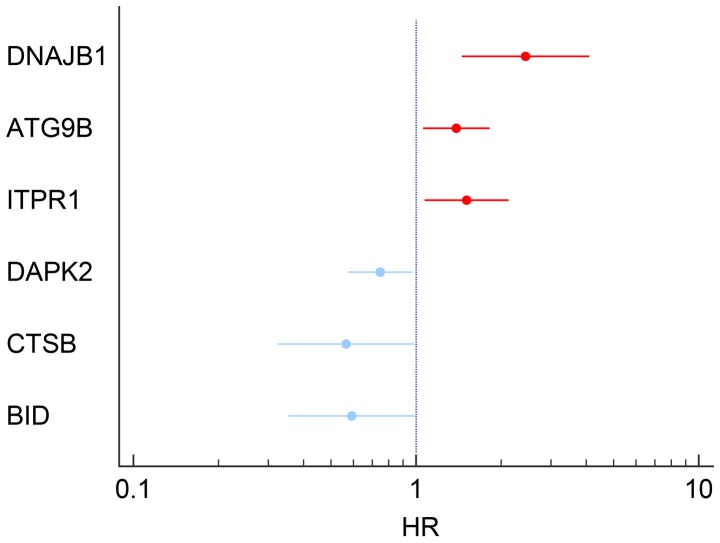
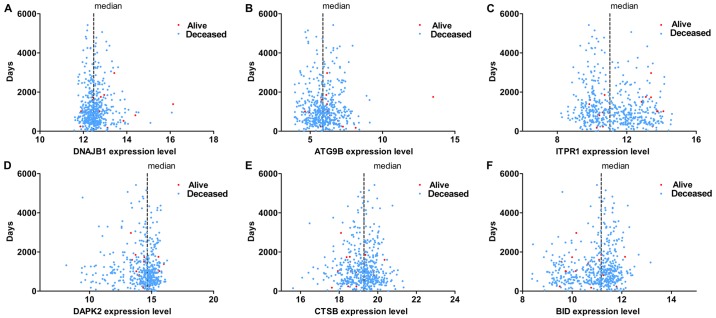
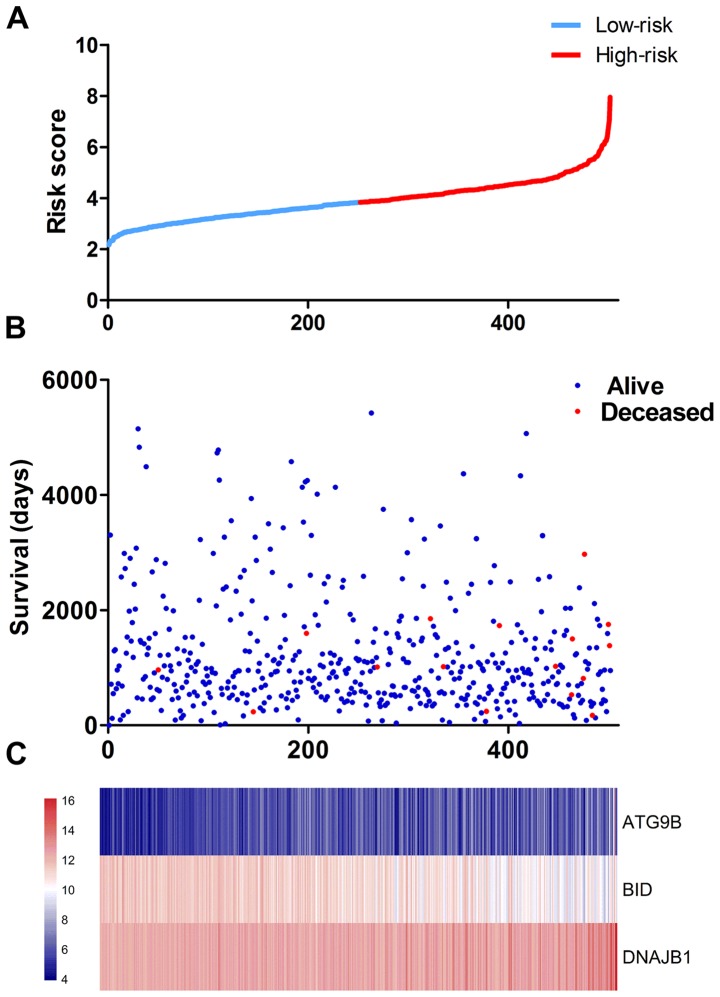
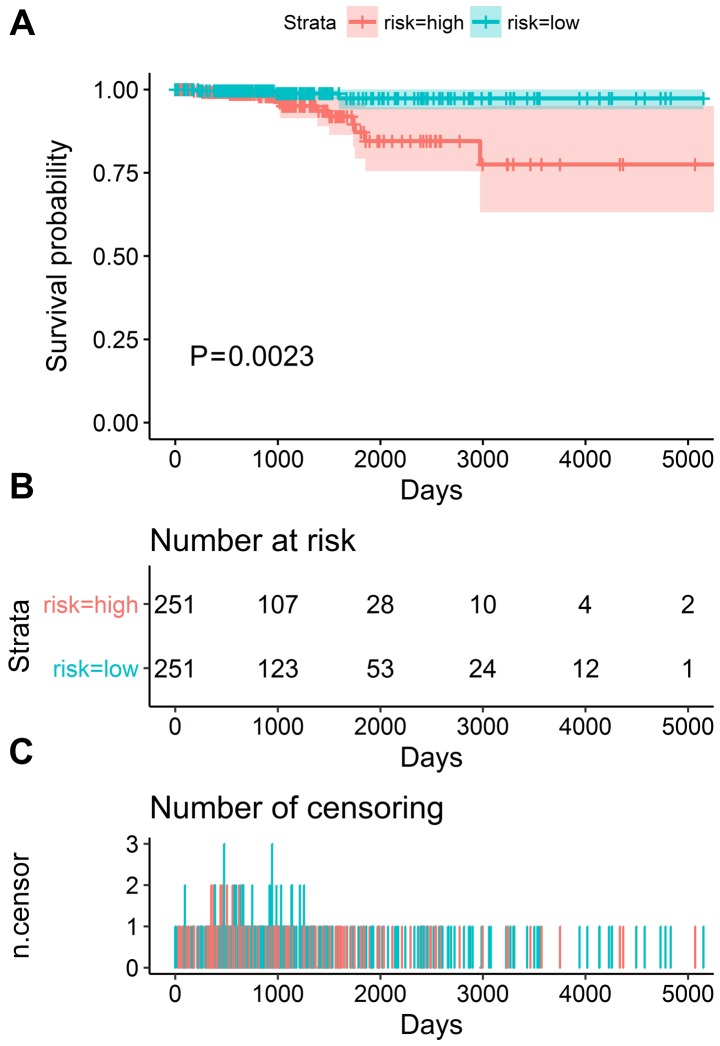
The results of univariate analysis revealed that 6 ARGs were associated with the prognosis of patients with TC (Figs. 11 and 12). To improve the accuracy and validity of the conclusion, we performed a multivariate Cox regression analysis and ultimately acquired 3 genes: ATG9B, BID and DNAJB1. Accordingly, a PI model was constructed based on these 3 genes: PI= 0.469*ATG9B expression − 0.796*BID expression + 0.782*DNAJB1 expression (Fig. 13). The median PI value was applied to divide the patients with TC into high- or low-risk groups. The KM test was employed in the current study for statistical analysis. The survival analysis revealed that the hazard ratio (HR) of the overall survival (OS) predicted by PI was 4.706 (95% CI, 1.742–12.710; log-rank, P=0.0023), which indicated that the high-risk patients had markedly shorter OS times than their low-risk counterparts (Fig. 14). Additionally, in the high-risk group, the ATG9B and DNAJB1 genes exhibited notably higher expression level s, whereas the BID gene exhibited a significantly lower expression (Fig. 15).
Figure 11.
Six differentially expressed autophagy-related genes with the prognostic values determined by univariate Cox analyses.
Figure 12.
The six prognosis-relevant gene groups influencing the survival of thyroid cancer patients.
Figure 13.
The prognostic index (PI) of the differentially expressed autophagy-related genes. (A) The PIs of each thyroid cancer patient. (B) The patient survival based on the PI. (C) Thermal mapping of the expression of 3 genes in the high-risk and low-risk groups.
Figure 14.
The prognostic differences in the high-risk and low-risk groups via the Kaplan-Meier analysis. (A) Patients in high-risk group have poorer overall survival. (B) The number of patients in different groups. (C) The number of censoring at different times.
Figure 15.
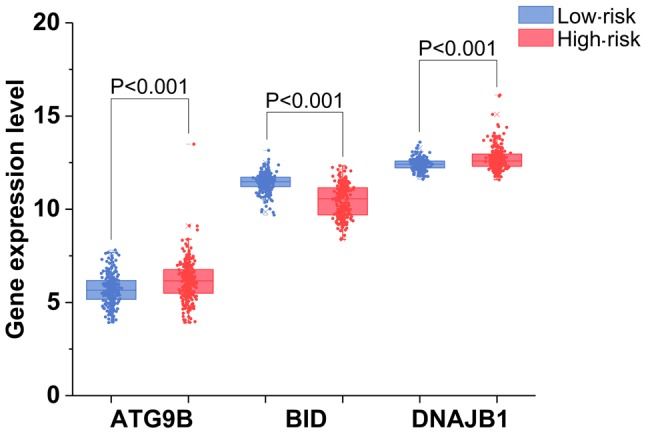
The expression of 3 autophagy-related genes with their prognostic values in the high-risk and low-risk groups.
Molecular mechanism of PI
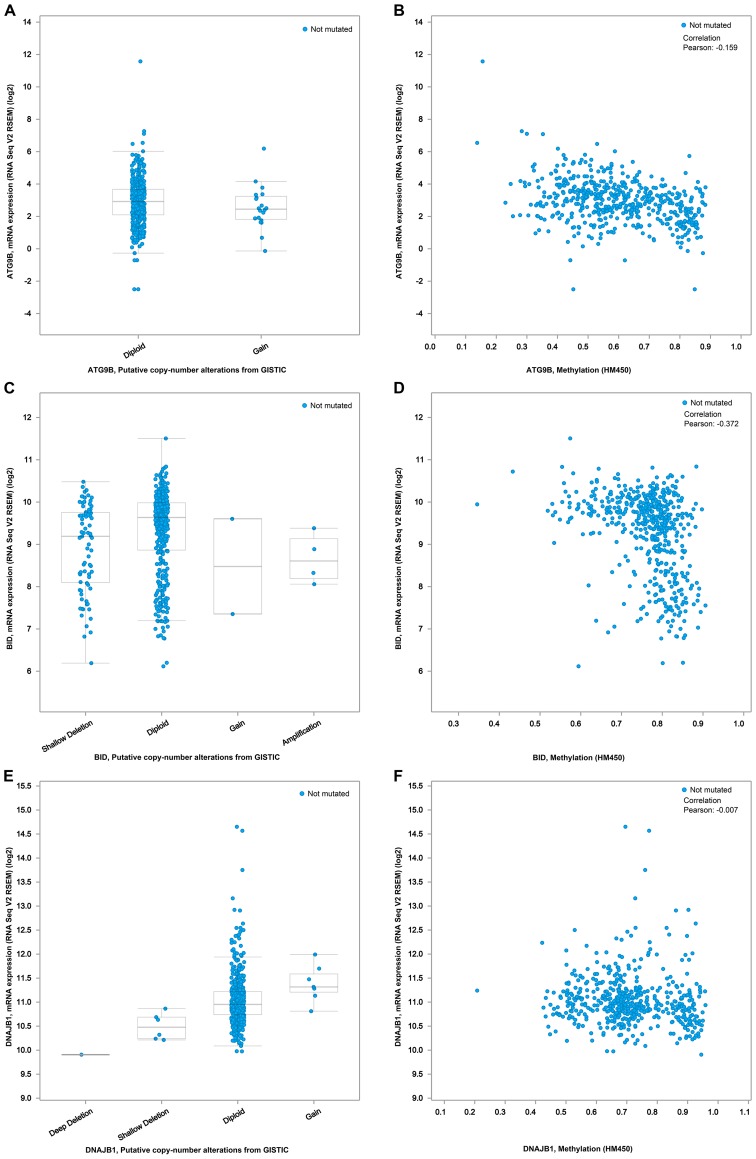
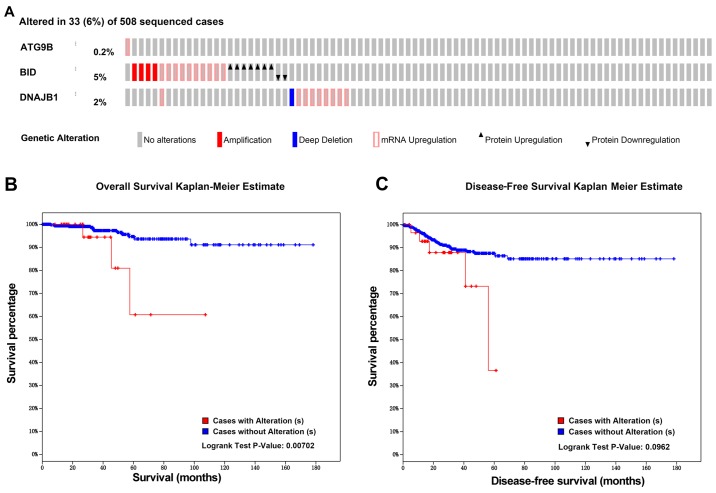
In order to investigate the molecular mechanism of the PI, we analyzed the alternative slicing, methylation, copy number variation and amplification of the ATG9B, BID and DNAJB1 genes. Using the cBioPortal program, we obtained the associations of the expression of these 3 genes with the methylation and copy number variations (Fig. 16). As shown in Fig. 17A, of the 508 TC cases, genetic alterations of these 3 genes were detected in 33 cases. According to the genetic alterations, the patients were categorized into two groups. The KM analysis suggested that the 33 patients with genetic alterations in these 3 genes were likely to have markedly lower survival times than those without the genetic alterations (Fig. 17B, P=0.007). In terms of disease-free survival, despite the fact that there was no significant difference between these two groups, the patients with the genetic alterations were prone to undesirable prognoses (Fig. 17C). Of note, Alternate Terminator was the most significant splicing events of ATG9B (exon 18). Alternate Promoter in exon 2 and exon 3 were the most significant splicing events of BID and DNAJB1 respectively (Fig. 18). However, there was no significant difference between the three alterative splicing events among the different tumor samples.
Figure 16.
The expression relationships of 3 prognosis-relevant autophagy-related genes with the methylation and copy number variations. (A) Relationship between ATG9B mRNA expression level and copy number alterations. (B) Correlation between ATG9B mRNA expression level and methylation level. (C) Relationship between BID mRNA expression level and copy number alterations. (D) Correlation between BID mRNA expression level and methylation level. (E) Relationship between DNAJB1 mRNA expression level and copy number alterations. (F) Correlation between DNAJB1 mRNA expression level and methylation level.
Figure 17.
The genetic alteration associations of 3 prognosis-relevant autophagy-related genes with the prognoses of the thyroid cancer patients. (A) The thermal mapping of the genetic variations. (B) The associations between the genetic variations and overall survival. (C) The associations between the genetic variations and disease-free survival.
Figure 18.
The most significant splicing events of three core autophagy-related genes. (A) ATG9B; (B) BID; (C) DNAJB1.
Discussion
In cellular processes, autophagy is the foundation for homeostatic regulation. An autophagy-perturbed status is common in TC, and it can contribute to tumor progression. The present study highlighted the comprehensive analysis of ARGs in patients with TC. First, we identified the differentially expressed ARGs in TC cases and normal samples. Subsequently, a functional enrichment analysis found that autophagy influenced several tumor-related pathways. We then analyzed the clinical significances of the differentially expressed genes, and found that they were closely related to lymph node metastasis and the tumor stage. It is also interesting that a risk model we proposed exhibited an excellent ability to predict the prognosis of TC. We expected to identify several clinically applicable diagnostic or prognostic biomarkers, and we provided a novel perspective of autophagy in TC.
Due to the indispensable function of autophagy, some researchers have evaluated several effects to reveal the clinical significance and corresponding molecular mechanisms in TC. However, its role in the tumorigenesis of TC remains controversial and unclear. Several scientific researchers have studied autophagy-related agents combined with other clinical treatment techniques in TC (31,32). These strategies regarding autophagy inhibition have achieved certain effects; however, there are still issues that have not been resolved. Hence, it is imperative to analyze the available data to indicate that the role of autophagy in the steps of TC onset, progression and prognosis. In the present study, a differential expression analysis was conducted among a series of ARGs to select the key mediators in the initiation of TC. In addition, we performed a functional analysis to reveal the unequivocal role of autophagy. These results revealed that in addition to autophagy, these differentially expressed genes were also involved in several proliferation-related pathways. Notably, the proliferative signaling pathways were the core of the interference. This conformed to the coordinating function of autophagy in the balance between cell growth and cell death (33–35). Not surprisingly, the DO analysis revealed that these differentially expressed ARGs also participated actively in various types of cancer. Further, the PPI network analysis indicated the existance of s interactions between these genes. BCL2, the first identified mammalian apoptotic regulator (36,37), is ranked as the core in the network. Moreover, BCL2-selective inhibitors have been approved for preclinical studies in anti-cancer treatment (38–40). The results of the functional enrichment analyses provided us with good reason to believe that these genes are common oncogenes, and that they operate as a whole to participate in the progression of the TC.
As the main purpose of this study was to reveal the clinical significance of autophagy in TC, we comprehensively analyzed the expression profiles, clinical parameters and prognostic values of these genes. As regards the 31 differentially expressed ARGs, 25 of these were significantly related to lymph node metastasis. Lymph node metastasis occurs frequently in patients with TC, and it directly affects the choice of treatment. Some previous studies have pointed to lymph node metastasis as an important indicator of TC invasion, and it was closely related with recurrence and distant metastasis (41–43), whether or not the lymph node metastasis had a great influence on the prognosis. Although there have been few studies reporting that several ARGs correlated with the lymph nodes, the majority of these research studies focused only on a signal gene (22,44,45). Our discovery that autophagy was associated with lymph node metastasis provided clues for the clinical management. However, further experimental validation, either in vivo or in vitro, is required in the future. These genes also displayed a significant correlation with the advanced tumor stage. These findings evidently show that these genes actively participate in the proliferation and invasion of TC. Therefore, these genes may be particularly useful for the assessment of the treatment response and progression surveillance.
We examined the associations between the ARG expression levels and survival using a univariate Cox regression model, and identified 6 genes as candidate prognostic biomarkers. We then submitted these genes to a multivariable Cox regression and developed a signature for predicting survival. The signature made it possible to separate the patients with TC into two groups with significantly different survivals. Three genes (ATG9B, BID and DNAJB1) included in the prognostic signature could act as clinically applicable indicators. Autophagy process is under strict control by a series of ARGs (46). Previously, it was demonstrated that the dysregulated autophagy level was closely related to tumor growth, survival and proliferation (47). Moreover, the deletion of several essential ARGs compromises the survival of tumor cells in vitro and in vivo (48,49). Therefore, the stable expression of ARGs is indispensable for inhibiting the onset of tumors. In this study, we found that several ARGs were dysregulated in the onset and progression of PTC. Therefore, these genes may play an important role in leading uncontrolled autophagy. Previously, Wang et al reported that the lack of ATG9B may facilitate the docking of both LC3 and p62 to initiate autophagy-associated degradation (50). Furthermore, this process may promote the apoptosis of hepatocytes in the initiation of hepatocellular carcinoma. Behrends et al first reported that DNAJB1 was involved in autophagy, which served as the bridge between WIPI2 and ATG2A. WIPI2 and ATG2A act with each other through DNAJB1. And depletion of WIPI2 led to reducing numbers of autophagosomes (51). In MCF-7 breast cancer cells, BID knockdown has been proved effective in the suppression of apoptosis and a shift of cell death towards autophagy (52). These findings displayed different roles of core ARGs in autophagy. Considering their expression profiles and clinical significance in PTC, these genes may also contribute to the progression of PTC via autophagy. ATG9B, BID and DNAJB1 all play multiple functions in autophagy; however, they have not been reported for their important clinical significance and molecular function in TC. These genes of less concern could provide novel insight into the clinical management and molecular mechanisms responsible for the development and progression of TC. Therefore, in this study, we used several bioinformatics methods to dig up the potential regulatory mechanism. These three genes are all significantly related to the methylation level of the CpG locus. Of note, the patients with alterations in these three genes had worse survivals when compared with the patients without alterations. Thus, we proposed the hypothesis that epigenetics and genomic alterations change the expression profiles of ARGs, thus influencing the prognosis of TC. In the present study, we also explored the associations between alterative splicing events and core ARGs. We also found the difference of alterative splicing events in each tumor samples were not huge. These findings hinted that alterative splicing events may not be the cause of significant clinical values of the three genes.
In this study, some limitations should be acknowledged. First, the underlying molecular mechanisms of the key ARGs in the TC pathogenesis are lacking, and additional experimental investigations should be conducted to uncover these. Second, although the prognostic signature we proposed was based on the expression profiles and clinical information obtained from the generally recognized TCGA database, it should be validated in other independent databases. Despite these limitations, this study highlighted the great clinical significance and potential molecular mechanisms of autophagy. These findings suggest that autophagy-targeted treatment may have a unique effect on TC, particularly in patients with lymph node metastases, and they provide insight into the complex biological functions of autophagy in TC.
Acknowledgments
The authors would like to thank the HADb and TCGA databases for the availability of the data. This study was edited by Scribendi.
Funding
This study was supported by grants from the Guangxi National Nature Science Foundation (2017GXNSFAA198253), the Guangxi Science and Technology Program (AB17195020) and the Fund of National Natural Science Foundation of China (NSFC81060202 and NSFC81260222).
Availability of data and materials
The datasets used and/or analyzed during the current study are available from the corresponding author on reasonable request.
Authors' contributions
The study was designed by GC and PL. PL, HY and YH, XJL, JJZ, WJM, DYW, QL, JBP, YQW, HYL, QYM, YPW and DHP participated in statistical analysis. PL and HY wrote the draft and GC, HY AND YH corrected the manuscript. All authors read and approved the final manuscript.
Ethics approval and consent to participate
Not applicable
Consent for publication
Not applicable
Competing interests
The authors declare that they have no competing interests.
References
- 1.van der Zwan JM, Mallone S, van Dijk B, Bielska-Lasota M, Otter R, Foschi R, Baudin E. Links TP RARECARE WG Carcinoma of endocrine organs: Results of the RARECARE project. Eur J Cancer. 2012;48:1923–1931. doi: 10.1016/j.ejca.2012.01.029. [DOI] [PubMed] [Google Scholar]
- 2.Siegel RL, Miller KD, Jemal A. Cancer statistics, 2018. CA Cancer J Clin. 2018;68:7–30. doi: 10.3322/caac.21442. [DOI] [PubMed] [Google Scholar]
- 3.Smith-Bindman R, Lebda P, Feldstein VA, Sellami D, Goldstein RB, Brasic N, Jin C, Kornak J. Risk of thyroid cancer based on thyroid ultrasound imaging characteristics: Results of a population-based study. JAMA Intern Med. 2013;173:1788–1796. doi: 10.1001/jamainternmed.2013.9245. [DOI] [PMC free article] [PubMed] [Google Scholar]
- 4.Bibbins-Domingo K, Grossman DC, Curry SJ, Barry MJ, Davidson KW, Doubeni CA, Epling JW, Jr, Kemper AR, Krist AH, Kurth AE, et al. US Preventive Services Task Force: Screening for thyroid cancer: US Preventive Services Task Force Recommendation Statement. JAMA. 2017;317:1882–1887. doi: 10.1001/jama.2017.4011. [DOI] [PubMed] [Google Scholar]
- 5.Mazeh H, Chen H. Advances in surgical therapy for thyroid cancer. Nat Rev Endocrinol. 2011;7:581–588. doi: 10.1038/nrendo.2011.140. [DOI] [PubMed] [Google Scholar]
- 6.Haugen BR, Alexander EK, Bible KC, Doherty GM, Mandel SJ, Nikiforov YE, Pacini F, Randolph GW, Sawka AM, Schlumberger M. 2015 American Thyroid Association Management Guidelines for Adult Patients with Thyroid Nodules and Differentiated Thyroid Cancer: The American Thyroid Association Guidelines Task Force on Thyroid Nodules and Differentiated Thyroid Cancer. Thyroid. 2016;26:1–133. doi: 10.1089/thy.2015.0020. [DOI] [PMC free article] [PubMed] [Google Scholar]
- 7.Carling T, Udelsman R. Thyroid cancer. Annu Rev Med. 2014;65:125–137. doi: 10.1146/annurev-med-061512-105739. [DOI] [PubMed] [Google Scholar]
- 8.Thyroid Cancer Treatment (Adult) (PDQ@) PDQ Cancer Information Summaries. Bethesda, MD: 2002. Health Professional Version. [Google Scholar]
- 9.Li LC, Liu GD, Zhang XJ, Li YB. Autophagy, a novel target for chemotherapeutic intervention of thyroid cancer. Cancer Chemother Pharmacol. 2014;73:439–449. doi: 10.1007/s00280-013-2363-y. [DOI] [PubMed] [Google Scholar]
- 10.Acquaviva G, Visani M, Repaci A, Rhoden KJ, de Biase D, Pession A, Giovanni T. Molecular pathology of thyroid tumours of follicular cells: A review of genetic alterations and their clinicopathological relevance. Histopathology. 2018;72:6–31. doi: 10.1111/his.13380. [DOI] [PubMed] [Google Scholar]
- 11.Jiang P, Mizushima N. Autophagy and human diseases. Cell Res. 2014;24:69–79. doi: 10.1038/cr.2013.161. [DOI] [PMC free article] [PubMed] [Google Scholar]
- 12.Rockel JS, Kapoor M. Autophagy: Controlling cell fate in rheumatic diseases. Nat Rev Rheumatol. 2016;12:517–531. doi: 10.1038/nrrheum.2016.92. [DOI] [PubMed] [Google Scholar]
- 13.Bravo-San Pedro JM, Kroemer G, Galluzzi L. Autophagy and mitophagy in cardiovascular disease. Circ Res. 2017;120:1812–1824. doi: 10.1161/CIRCRESAHA.117.311082. [DOI] [PubMed] [Google Scholar]
- 14.Mowers EE, Sharifi MN, Macleod KF. Functions of autophagy in the tumor microenvironment and cancer metastasis. FEBS J. 2018 Jan 21; doi: 10.1111/febs.14388. Epub ahead of print. [DOI] [PMC free article] [PubMed] [Google Scholar]
- 15.Zelenka J, Koncošová M, Ruml T. Targeting of stress response pathways in the prevention and treatment of cancer. Biotechnol Adv. 2018 Jan 12; doi: 10.1016/j.biotechadv.2018.01.007. Epub ahead of print. [DOI] [PubMed] [Google Scholar]
- 16.Levy JMM, Towers CG, Thorburn A. Targeting autophagy in cancer. Nat Rev Cancer. 2017;17:528–542. doi: 10.1038/nrc.2017.53. [DOI] [PMC free article] [PubMed] [Google Scholar]
- 17.Vlodavsky I, Singh P, Boyango I, Gutter-Kapon L, Elkin M, Sanderson RD, Ilan N. Heparanase: From basic research to therapeutic applications in cancer and inflammation. Drug Resist Updat. 2016;29:54–75. doi: 10.1016/j.drup.2016.10.001. [DOI] [PMC free article] [PubMed] [Google Scholar]
- 18.Levine B, Packer M, Codogno P. Development of autophagy inducers in clinical medicine. J Clin Invest. 2015;125:14–24. doi: 10.1172/JCI73938. [DOI] [PMC free article] [PubMed] [Google Scholar]
- 19.Wei H, Guan JL. Pro-tumorigenic function of autophagy in mammary oncogenesis. Autophagy. 2012;8:129–131. doi: 10.4161/auto.8.1.18171. [DOI] [PMC free article] [PubMed] [Google Scholar]
- 20.Wang W, Kang H, Zhao Y, Min I, Wyrwas B, Moore M, Teng L, Zarnegar R, Jiang X, Fahey TJ., III Targeting autophagy sensitizes BRAF-mutant thyroid cancer to vemurafenib. J Clin Endocrinol Metab. 2017;102:634–643. doi: 10.1210/jc.2016-1999. [DOI] [PMC free article] [PubMed] [Google Scholar]
- 21.Feng W, Jia S. Rapamycin inhibits the invasive ability of thyroid cancer cells by down-regulating the expression of VEGF-C in vitro. Cell Biochem Funct. 2012;30:487–491. doi: 10.1002/cbf.2824. [DOI] [PubMed] [Google Scholar]
- 22.Yang M, Bai L, Yu W, Sun X, Xu G, Guan R, Yang Y, Qiu M, Zhang Y, Tian J. Expression of autophagy-associated proteins in papillary thyroid carcinoma. Oncol Lett. 2017;14:411–415. doi: 10.3892/ol.2017.6101. [DOI] [PMC free article] [PubMed] [Google Scholar]
- 23.Kim HM, Kim ES, Koo JS. Expression of autophagy-related proteins in different types of thyroid cancer. Int J Mol Sci. 2017;18:18. doi: 10.3390/ijms18030540. [DOI] [PMC free article] [PubMed] [Google Scholar]
- 24.Moussay E, Kaoma T, Baginska J, Muller A, Van Moer K, Nicot N, Nazarov PV, Vallar L, Chouaib S, Berchem G. The acquisition of resistance to TNFα in breast cancer cells is associated with constitutive activation of autophagy as revealed by a transcriptome analysis using a custom microarray. Autophagy. 2011;7:760–770. doi: 10.4161/auto.7.7.15454. [DOI] [PubMed] [Google Scholar]
- 25.Zhang H, Lu X, Wang N, Wang J, Cao Y, Wang T, Zhou X, Jiao Y, Yang L, Wang X. Autophagy-related gene expression is an independent prognostic indicator of glioma. Oncotarget. 2017;8:60987–61000. doi: 10.18632/oncotarget.17719. [DOI] [PMC free article] [PubMed] [Google Scholar]
- 26.Szklarczyk D, Franceschini A, Wyder S, Forslund K, Heller D, Huerta-Cepas J, Simonovic M, Roth A, Santos A, Tsafou KP. STRING v10: Protein-protein interaction networks, integrated over the tree of life. Nucleic Acids Res. 2015;43:D447–D452. doi: 10.1093/nar/gku1003. [DOI] [PMC free article] [PubMed] [Google Scholar]
- 27.Shannon P, Markiel A, Ozier O, Baliga NS, Wang JT, Ramage D, Amin N, Schwikowski B, Ideker T. Cytoscape: A software environment for integrated models of biomolecular interaction networks. Genome Res. 2003;13:2498–2504. doi: 10.1101/gr.1239303. [DOI] [PMC free article] [PubMed] [Google Scholar]
- 28.Yu G, Wang LG, Han Y, He QY. clusterProfiler: An R package for comparing biological themes among gene clusters. OMICS. 2012;16:284–287. doi: 10.1089/omi.2011.0118. [DOI] [PMC free article] [PubMed] [Google Scholar]
- 29.Walter W, Sánchez-Cabo F, Ricote M. GOplot: An R package for visually combining expression data with functional analysis. Bioinformatics. 2015;31:2912–2914. doi: 10.1093/bioinformatics/btv300. [DOI] [PubMed] [Google Scholar]
- 30.Gao J, Aksoy BA, Dogrusoz U, Dresdner G, Gross B, Sumer SO, Sun Y, Jacobsen A, Sinha R, Larsson E, et al. Integrative analysis of complex cancer genomics and clinical profiles using the cBio-Portal. Sci Signal. 2013;6:pl1. doi: 10.1126/scisignal.2004088. [DOI] [PMC free article] [PubMed] [Google Scholar]
- 31.Yi H, Ye T, Ge M, Yang M, Zhang L, Jin S, Ye X, Long B, Li L. Inhibition of autophagy enhances the targeted therapeutic effect of sorafenib in thyroid cancer. Oncol Rep. 2018;39:711–720. doi: 10.3892/or.2017.6118. [DOI] [PubMed] [Google Scholar]
- 32.Lin CI, Whang EE, Donner DB, Du J, Lorch J, He F, Jiang X, Price BD, Moore FD, Jr, Ruan DT. Autophagy induction with RAD001 enhances chemosensitivity and radiosensitivity through Met inhibition in papillary thyroid cancer. Mol Cancer Res. 2010;8:1217–1226. doi: 10.1158/1541-7786.MCR-10-0162. [DOI] [PubMed] [Google Scholar]
- 33.Paquette M, El-Houjeiri L, Pause A. mTOR pathways in cancer and autophagy. Cancers (Basel) 2018;10:E18. doi: 10.3390/cancers10010018. [DOI] [PMC free article] [PubMed] [Google Scholar]
- 34.Xie W, Zhou J. Aberrant regulation of autophagy in mammalian diseases. Biol Lett. 2018;14:14. doi: 10.1098/rsbl.2017.0540. [DOI] [PMC free article] [PubMed] [Google Scholar]
- 35.Yu C, Li WB, Liu JB, Lu JW, Feng JF. Autophagy: Novel applications of nonsteroidal anti-inflammatory drugs for primary cancer. Cancer Med. 2018;7:471–484. doi: 10.1002/cam4.1287. [DOI] [PMC free article] [PubMed] [Google Scholar]
- 36.Tsujimoto Y, Finger LR, Yunis J, Nowell PC, Croce CM. Cloning of the chromosome breakpoint of neoplastic B cells with the t(14;18) chromosome translocation. Science. 1984;226:1097–1099. doi: 10.1126/science.6093263. [DOI] [PubMed] [Google Scholar]
- 37.Cleary ML, Smith SD, Sklar J. Cloning and structural analysis of cDNAs for bcl-2 and a hybrid bcl-2/immunoglobulin transcript resulting from the t(14;18) translocation. Cell. 1986;47:19–28. doi: 10.1016/0092-8674(86)90362-4. [DOI] [PubMed] [Google Scholar]
- 38.Leverson JD, Sampath D, Souers AJ, Rosenberg SH, Fairbrother WJ, Amiot M, Konopleva M, Letai A. Found in translation: How preclinical research is guiding the clinical development of the BCL2-selective inhibitor venetoclax. Cancer Discov. 2017;7:1376–1393. doi: 10.1158/2159-8290.CD-17-0797. [DOI] [PMC free article] [PubMed] [Google Scholar]
- 39.Liang ST, Li Y, Li XW, Wang JJ, Tan FX, Han QR, Li L, Yao XQ, Sun XG. Mechanism of colon cancer cell apoptosis induced by telocinobufagin: Role of oxidative stress and apoptosis pathway. Nan Fang Yi Ke Da Xue Xue Bao. 2016;36:921–926. In Chinese. [PubMed] [Google Scholar]
- 40.S Soderquist R, Eastman A. BCL2 inhibitors as anticancer drugs: A plethora of misleading BH3 mimetics. Mol Cancer Ther. 2016;15:2011–2017. doi: 10.1158/1535-7163.MCT-16-0031. [DOI] [PMC free article] [PubMed] [Google Scholar]
- 41.Jeon MJ, Yoon JH, Han JM, Yim JH, Hong SJ, Song DE, Ryu JS, Kim TY, Shong YK, Kim WB. The prognostic value of the metastatic lymph node ratio and maximal metastatic tumor size in pathological N1a papillary thyroid carcinoma. Eur J Endocrinol. 2013;168:219–225. doi: 10.1530/EJE-12-0744. [DOI] [PubMed] [Google Scholar]
- 42.Sung TY, Yoon JH, Song DE, Lee YM, Kim TY, Chung KW, Kim WB, Shong YK, Hong SJ. Prognostic value of the number of retrieved lymph nodes in pathological Nx or N0 classical papillary thyroid carcinoma. World J Surg. 2016;40:2043–2050. doi: 10.1007/s00268-016-3490-5. [DOI] [PubMed] [Google Scholar]
- 43.Jeon MJ, Kim TY, Kim WG, Han JM, Jang EK, Choi YM, Song DE, Yoon JH, Chung KW, Hong SJ. Differentiating the location of cervical lymph node metastasis is very useful for estimating the risk of distant metastases in papillary thyroid carcinoma. Clin Endocrinol (Oxf) 2014;81:593–599. doi: 10.1111/cen.12463. [DOI] [PubMed] [Google Scholar]
- 44.Zhang N, Li L, Wang J, Cao M, Liu G, Xie G, Yang Z, Li Y. Study of autophagy-related protein light chain 3 (LC3)-II expression levels in thyroid diseases. Biomed Pharmacother. 2015;69:306–310. doi: 10.1016/j.biopha.2014.12.021. [DOI] [PubMed] [Google Scholar]
- 45.Li X, Xu H, Ma H. Beclin 1 is highly expressed in papillary thyroid carcinoma and correlates with lymph node metastasis. Acta Chir Belg. 2013;113:175–181. doi: 10.1080/00015458.2013.11680907. [DOI] [PubMed] [Google Scholar]
- 46.Lin H, Yan J, Wang Z, Hua F, Yu J, Sun W, Li K, Liu H, Yang H, Lv Q. Loss of immunity-supported senescence enhances susceptibility to hepatocellular carcinogenesis and progression in Toll-like receptor 2-deficient mice. Hepatology. 2013;57:171–182. doi: 10.1002/hep.25991. [DOI] [PubMed] [Google Scholar]
- 47.Amaravadi R, Kimmelman AC, White E. Recent insights into the function of autophagy in cancer. Genes Dev. 2016;30:1913–1930. doi: 10.1101/gad.287524.116. [DOI] [PMC free article] [PubMed] [Google Scholar]
- 48.Guo JY, Chen HY, Mathew R, Fan J, Strohecker AM, Karsli-Uzunbas G, Kamphorst JJ, Chen G, Lemons JM, Karantza V. Activated Ras requires autophagy to maintain oxidative metabolism and tumorigenesis. Genes Dev. 2011;25:460–470. doi: 10.1101/gad.2016311. [DOI] [PMC free article] [PubMed] [Google Scholar]
- 49.Yang S, Wang X, Contino G, Liesa M, Sahin E, Ying H, Bause A, Li Y, Stommel JM, Dell’antonio G, et al. Pancreatic cancers require autophagy for tumor growth. Genes Dev. 2011;25:717–729. doi: 10.1101/gad.2016111. [DOI] [PMC free article] [PubMed] [Google Scholar]
- 50.Wang N, Tan HY, Li S, Feng Y. Atg9b deficiency suppresses autophagy and potentiates endoplasmic reticulum stress-associated hepatocyte apoptosis in hepatocarcinogenesis. Theranostics. 2017;7:2325–2338. doi: 10.7150/thno.18225. [DOI] [PMC free article] [PubMed] [Google Scholar]
- 51.Behrends C, Sowa ME, Gygi SP, Harper JW. Network organization of the human autophagy system. Nature. 2010;466:68–76. doi: 10.1038/nature09204. [DOI] [PMC free article] [PubMed] [Google Scholar]
- 52.Lamparska-Przybysz M, Gajkowska B, Motyl T. Cathepsins and BID are involved in the molecular switch between apoptosis and autophagy in breast cancer MCF-7 cells exposed to camptothecin. J Physiol Pharmacol. 2005;56(Suppl 3):159–179. [PubMed] [Google Scholar]
Associated Data
This section collects any data citations, data availability statements, or supplementary materials included in this article.
Data Availability Statement
The datasets used and/or analyzed during the current study are available from the corresponding author on reasonable request.


