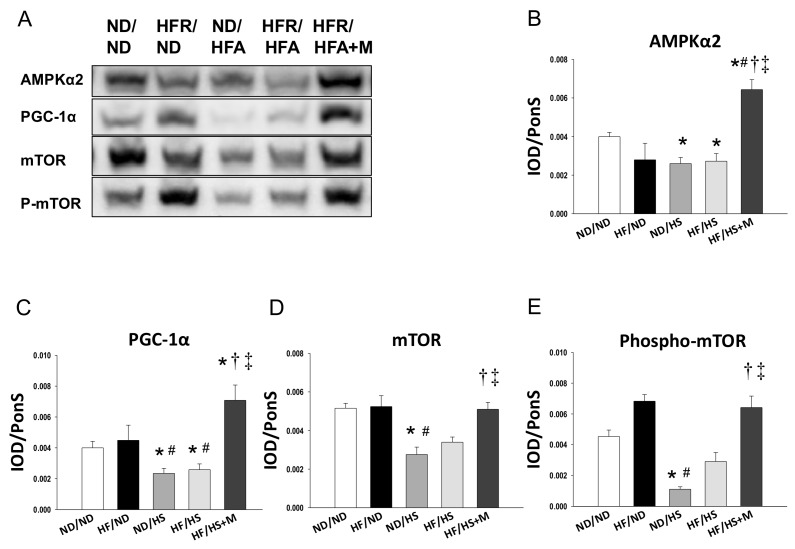
Figure 3.
(A) Representative Western blots and relative abundance of (B) AMPKα2 (63 kDa); (C) PGC-1α (90 kDa); (D) mammalian target of rapamycin (mTOR, 289kDa) and (E) phosphorylated mTOR in male offspring kidneys at 12 weeks of age. * p < 0.05 vs. ND/ND, # p < 0.05 vs. HF/ND, † p < 0.05 vs. ND/HS, ‡ p < 0.05 vs. HF/HS.

