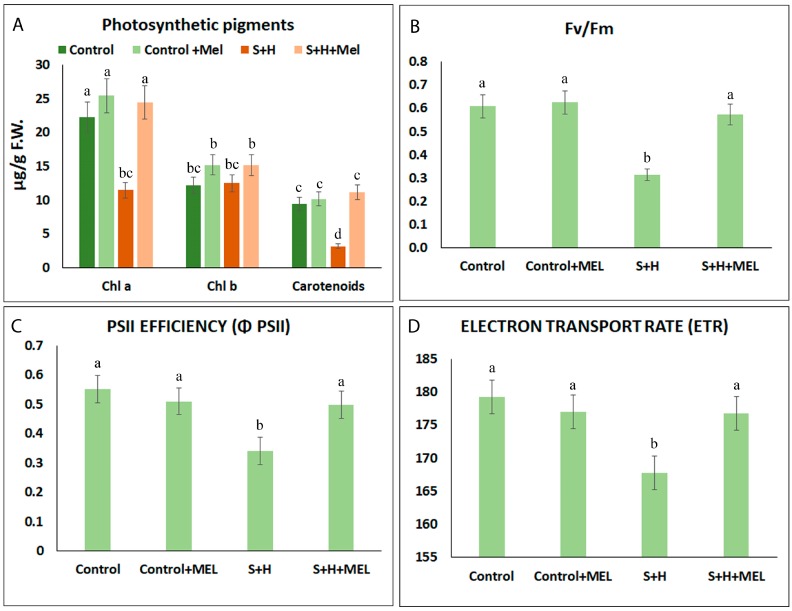
Figure 4.
Photosynthetic pigments concentration (chlorophyll a, b and carotenoids) (A) and chlorophyll fluorescence-related parameters (B–D) in leaves of tomato plants grown under control or stress combination conditions (salinity + heat, S + H) with (+Mel) or without melatonin pre-treatment; (B) Maximum photochemical yield of PSII; (C) PSII Efficiency; (D) Electron transport rate. The figure is representative of four different measurements during the experiment. Values represent means ± SE (n = 6). Bars with different letters within each panel are significantly different at p > 0.05 according to Tukey’s test.

