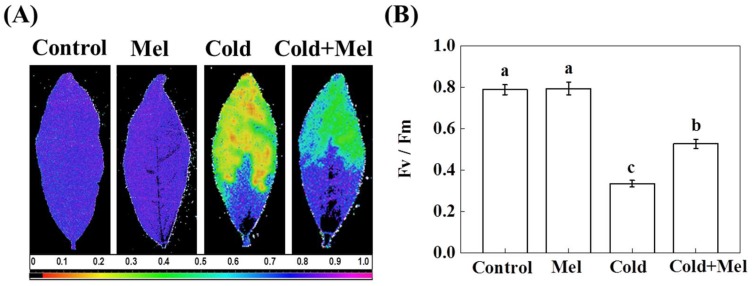
Figure 2.
Effect of melatonin application on the maximum photochemical efficiency of PSII (Fv/Fm) in tea leaves under normal and cold stress conditions. (A) Pseudo color image of Fv/Fm; and (B) Fv/Fm value under different treatments. Pseudo color gradient shown at the bottom of the image ranges from 0 (black) to 1 (purple). Mel, melatonin. Each data point presents the mean of six replicates (± S.D. (standard deviation)). Means denoted by different letters are significantly different (p < 0.05) based on the Tukey’s test.

