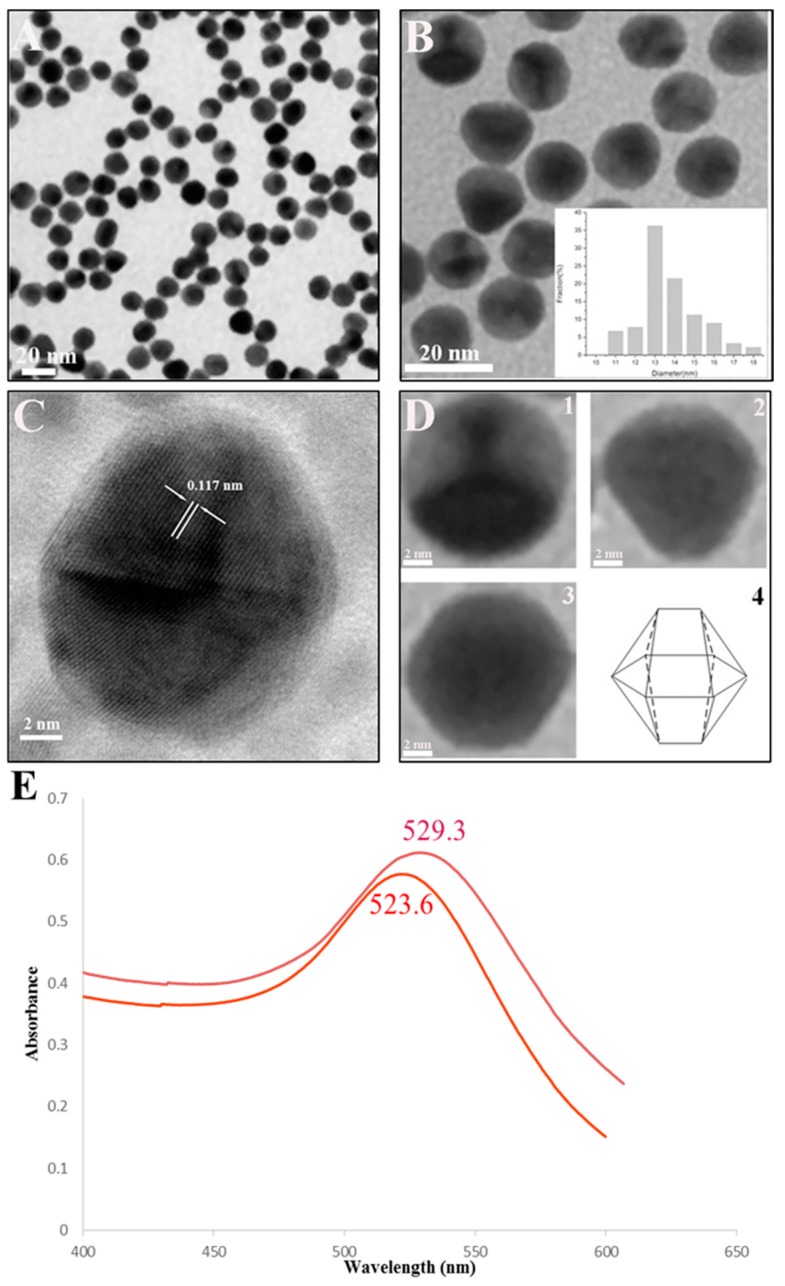
Figure 1.
Characterization of colloidal gold. (A) TEM image of gold nanoparticles (AuNPs) (100,000× magnification); (B) TEM image of AuNPs (500,000× magnification). The size distribution of the AuNPs can be seen in the TEM image. The diameter of the AuNPs ranged from 10 nm to 20 nm, with an average of approximately 18 nm; (C) High-resolution TEM (HRTEM) image of AuNPs. The HRTEM image taken of an individual AuNP shows a continuous fringe pattern with a spacing of 0.117 nm; (D) Higher magnification images of AuNPs (1–3) and a proposed model of the AuNPs with multi-aspect optimization (4); (E) UV-vis absorption spectrum of pure AuNPs with a peak at 523.6 nm. (red line) and UV-vis absorption spectrum of the monoclonal antibody (MAb)–AuNP conjugates with a peak at 529.3 nm (purple line).

