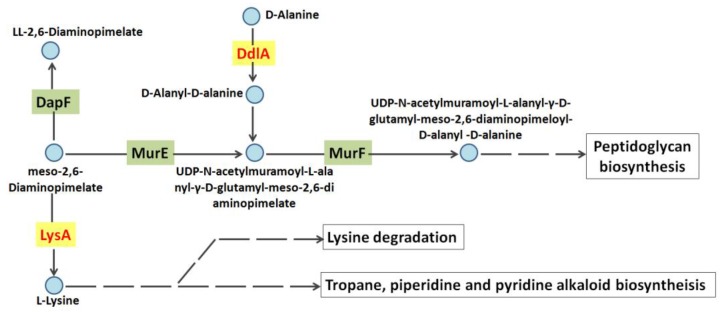
Figure 7.
A view of metabolic pathway of DdlA and LysA leading to peptidoglycan biosynthesis. The pathway was summarized from the KEGG website (http://www.kegg.jp/kegg-bin/highlight_pathway?scale=1.0&map=mtu00300&keyword=lysA and http://www.kegg.jp/kegg-bin/highlight_pathway?scale=1.0&map=mtu01502&keyword=ddlA). Single lines represent the proceeding individual biosynthesis pathway catalyzed by the highlighted gene products. Dashed lines represent a series of successive biosynthesis pathways. Round nodes displayed metabolite intermediates. The genes associated with individual reaction were highlighted in grey color.

