. 2018 Jun 15;7:e36131. doi: 10.7554/eLife.36131

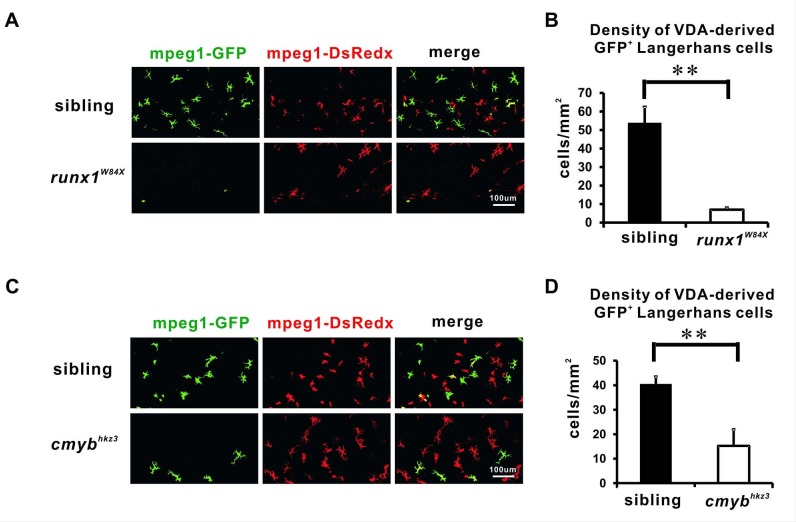
Figure 2. The VDA-derived LCs are reduced in Runx1 and cMyb mutants.

(A) Anti-GFP staining shows that the VDA-derived LCs are significantly reduced in 12 dpf runx1W84X mutants comparing with those in siblings. (B) Quantification of the density of the VDA-derived GFP+ LCs in 12 dpf runx1W84X mutants and siblings. n = 5 for siblings and n = 6 for mutants. Error bars represent mean SEM. **p<0.01. (C) Anti-GFP staining reveals a reduction of the VDA-derived LCs in 20 dpf cmybhkz3 mutants comparing with size matching siblings. (D) Quantification of the density of the VDA-derived GFP+ LCs in 20 dpf cmybhkz3 mutants and size matching siblings. n = 11 and 10 for siblings and mutants respectively. Error bars represent mean SEM. **p<0.01.

Figure 2—source data 1. Quantification of VDA derived LCs in Runx1 and cMyb mutants.
DOI: 10.7554/eLife.36131.009

Figure 2.

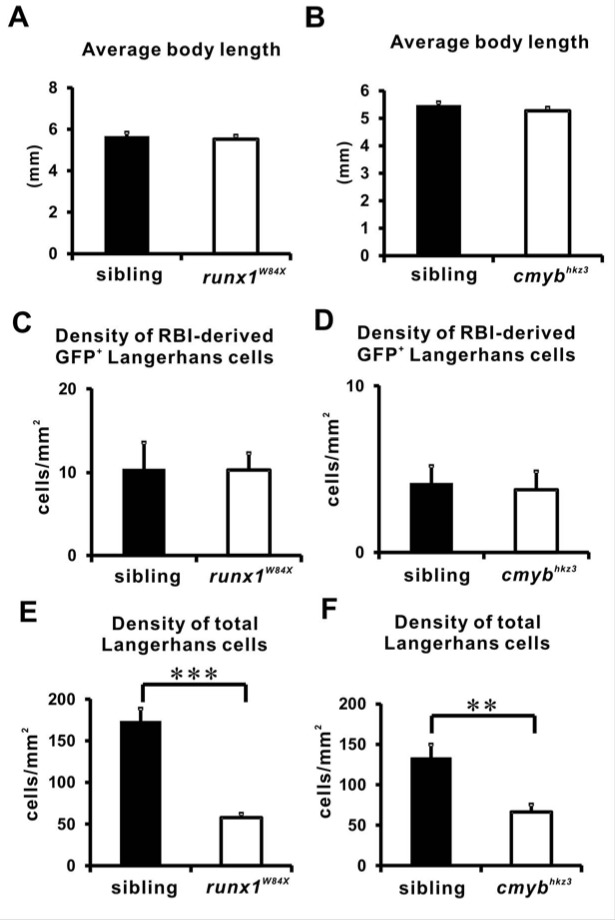
Figure 2—figure supplement 1. Quantification of body length and RBI derived LCs in Runx1 and cMyb mutants.

Figure 2—figure supplement 1.

(A) Average body length of the runx1W84X mutant and its sibling. n = 5 for siblings and n = 6 for mutants. Error bars represent mean SEM. (B) Average body length of the 20 dpf cmybhkz3 mutant and its size matched sibling. n = 11 and 10 for siblings and mutants respectively. Error bars represent mean SEM. (C) Quantification of the density of the RBI-derived GFP+ LCs in the trunk of 12 dpf runx1W84X mutants and siblings. n = 6 for siblings and mutants. Error bars represent mean SEM. (D) Quantification of the density of the RBI-derived GFP+ LCs in the trunk of 20 dpf cmybhkz3 mutants and size matched siblings. n = 5 for siblings and n = 6 for mutants. Error bars represent mean SEM. (E) Quantification of the density of total LCs in the trunk of 12 dpf runx1W84X mutants and siblings. n = 5 for siblings and n = 6 for mutants. Error bars represent mean SEM. (F) Quantification of the density of total LCs in the trunk of 20 dpf cmybhkz3 mutants and size matched siblings. n = 11 and 10 for siblings and mutants, respectively. Error bars represent mean SEM.
Figure 2—figure supplement 1—source data 1. Quantification of body length and RBI derived LCs in Runx1 and cMyb mutants.
DOI: 10.7554/eLife.36131.008