. 2018 May 29;7:e34055. doi: 10.7554/eLife.34055

Figure 9. Label-free quantification mass spectrometry comparison of M. smegmatis WT with Δcpa proteome.

(A) Results of protein abundance comparison between the wt and the cpa-knockout strain using LFQ-MS (see Figure 9—source data 1). To filter the statistically-significant proteins, the p-value threshold was set to 0.05 (horizontal dashed line) and the fold-change threshold to 1.5 (vertical dashed lines). Under standard growth conditions (left plot), 49 proteins were found to accumulate (right side of the plot) and 45 proteins were found to be decreased (left side of the plot) in the knockout cells. Under carbon starvation (right plot), 254 proteins accumulated and 251 proteins were depleted in the knockout cells. (B) Those identified proteins for which a functional association was known or predicted, classification into functional classes using the COG classification system was carried out. Class abbreviations are as follows: C – energy production and conversion, D – cell cycle control and cell division, E – amino acid metabolism and transport, F – nucleotide metabolism and transport, G – carbohydrate metabolism and transport, H – coenzyme metabolism, I – lipid metabolism, J – translation/ribosomal structure and biogenesis, K – transcription, L – replication/recombination/repair, M – cell wall/membrane/envelope biogenesis, O – post-translational modification/protein turnover/chaperone functions, P – inorganic ion transport and metabolism, Q – secondary metabolites biosynthesis and catabolism, T – signal transduction, V – defense mechanisms. Proteins without an assigned class or assigned to class S (function unknown) were not included in the plot.

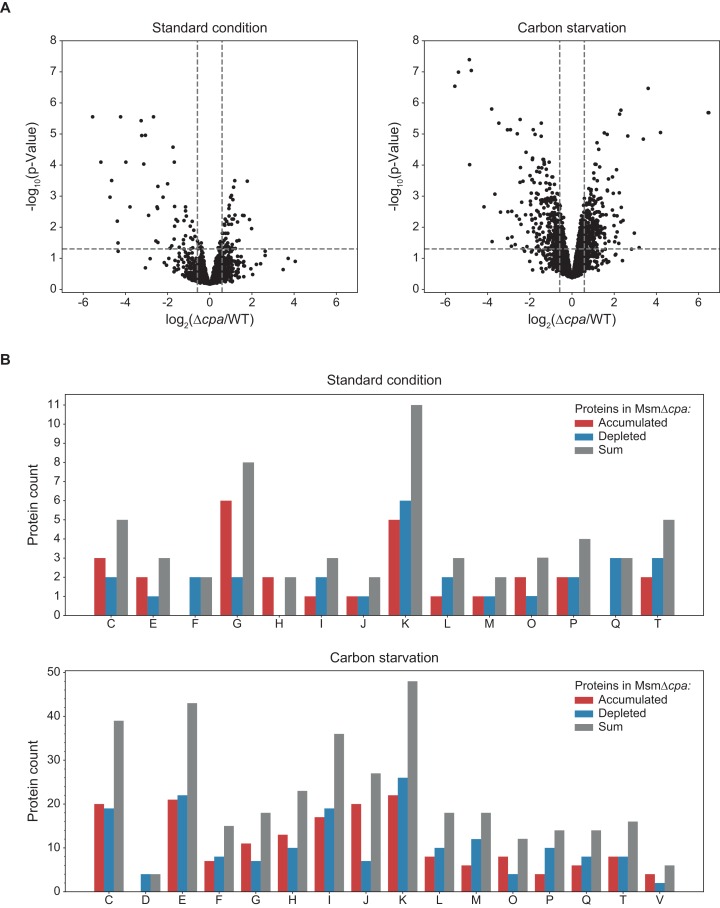
Figure 9—source data 1. Source data file for Figure 9.
DOI: 10.7554/eLife.34055.020
Figure 9—source data 2. Source data file for Figure 9.
elife-34055-fig9-data2.xlsx (817.2KB, xlsx)
DOI: 10.7554/eLife.34055.021

Figure 9.

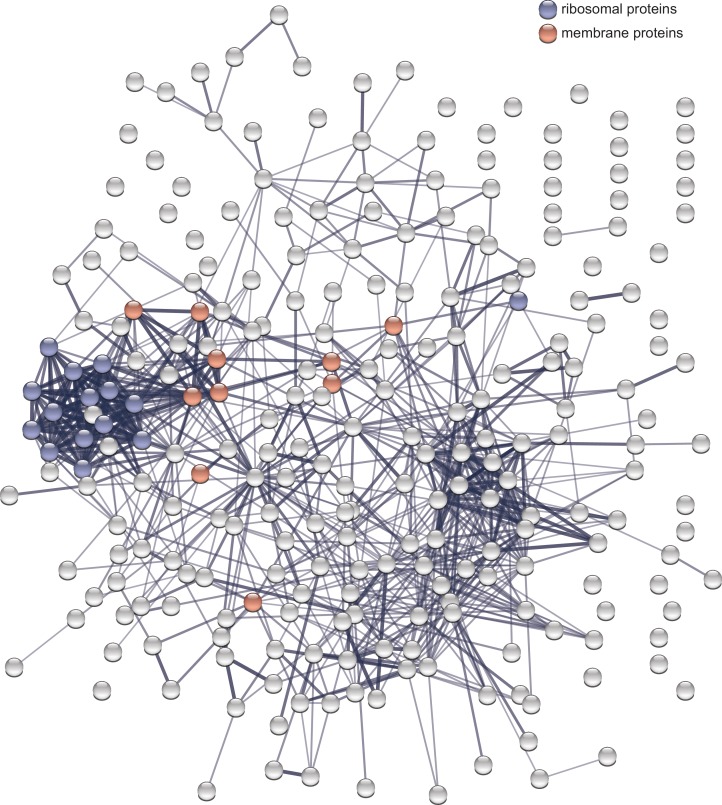
Figure 9—figure supplement 1. STRING interaction network of the proteins that accumulated in the Cpa-knockout strain during carbon starvation.

Figure 9—figure supplement 1.

The blue circles represent ribosomal proteins and the red circles correspond to membrane proteins. The entire network represents proteins identified by LFQ-MS as having increased levels in the cpa-knockout strain under carbon limitation. Edge thickness of lines between the protein nodes corresponds to interaction confidence, according to STRING confidence scores.

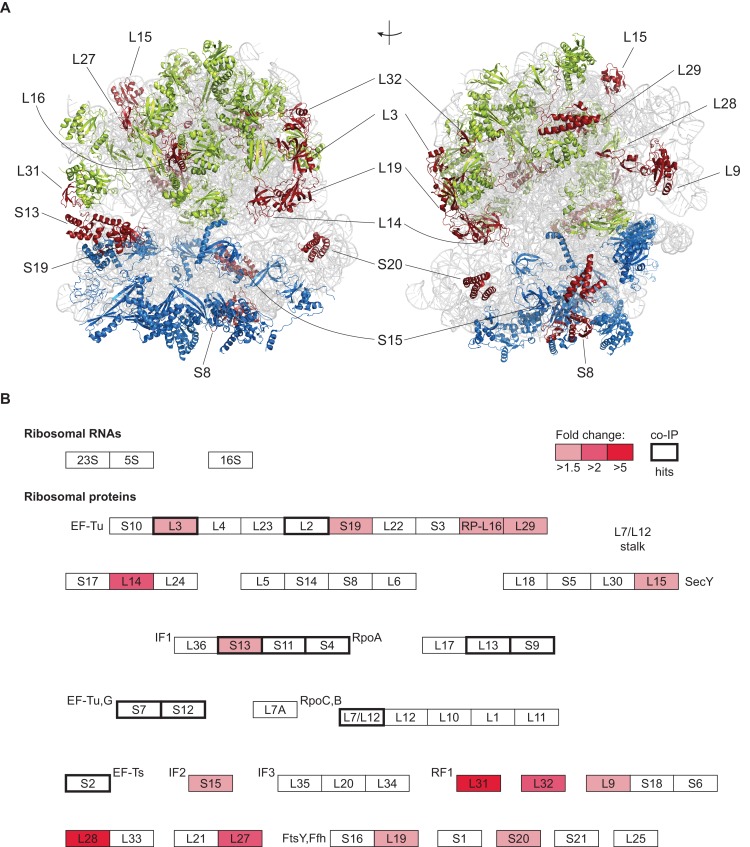
Figure 9—figure supplement 2. Ribosomal proteins accumulating in the cpa-knockout cells during starvation mapped onto the structure of the 70S mycobacterial ribosome.

Figure 9—figure supplement 2.

(A) Proteins colored green belong to the 50S subunit of the ribosome, while the blue ones belong to the 30S subunit. Red color indicates proteins that accumulated in the cpa-knockout strain during carbon starvation. For clarity, rRNA is shown in semi-transparent grey cartoon representation. The figure was generated using the recent structure of the 70S ribosome from M. smegmatis (PDB: 5O61, (Hentschel et al., 2017)). (B) Depiction of accumulating ribosomal proteins (red) in the context of the KEGG pathway map for the assembled ribosome (Kanehisa et al., 2016). Boxes framed in bold represent proteins identified in at least two out of three replicates of the co-immunoprecipitation experiment.