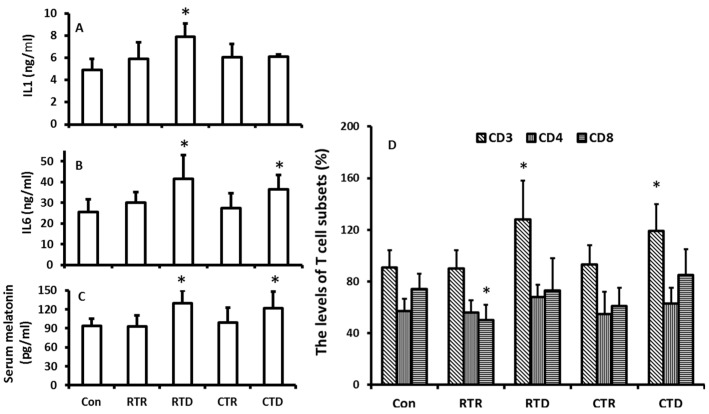
Figure 4.
Temperature changes on the melatonin production and immuno-responses of hamsters. The animals were housed in the fixed ligh/dark cycle (12/12 h) and humidity but different temperature patterns. Con: 22 ± 2 °C; RTR: rapid temperature rising; RTD: rapid temperature drop; CTR: constant temperature rising and CTD: constant temperature drop, respectively. Animal were sacrificed after 72 h of the treatments at 9–10:00 pm under dim red light. Serum was collected for the further assays. A and B: the levels of IL1 and 6, respectively; C: the serum melatonin level, D: the distributions of CD3, 4 and 8 in different treatment groups. The data were expressed as means ± SDs of eight hamsters each group. * Significant difference vs. controls.

