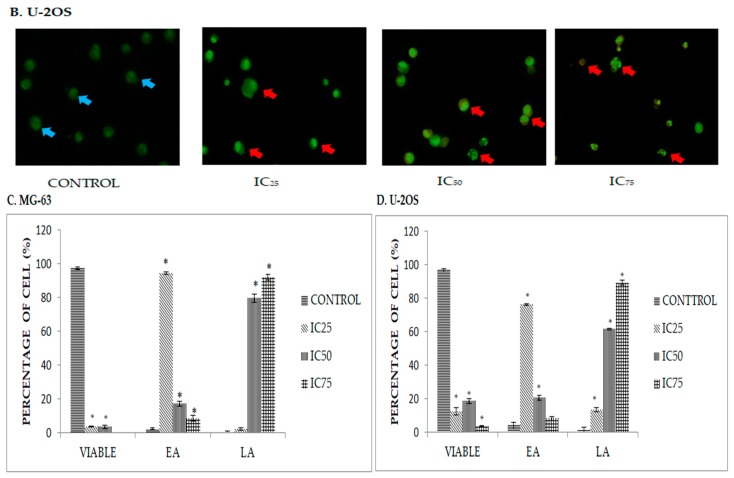
Figure 2.
(A) Distinct morphological changes in MG-63 after 48 h of treatment with DK1 (IC25 (6.6 µM), IC50 (23.8 µM), and IC75 (30 µM)); (B) Distinct morphological changes in U-2OS after 48 h treatment with DK1 (IC25 (2.2 µM), IC50 (19.6 µM) and IC75 (30 µM)); (C,D) Quantification analysis of MG-63 and U-2OS based on cells uptake of acridine orange and propidium iodide in 200 cells. (Blue arrow: viable; red arrow: apoptosis). EA (early apoptosis), LA (late apoptosis). All data are expressed as mean ± standard error mean (S.E.M). * p < 0.05 compared with corresponding controls (Magnification: 200×).


