

Abstract
Genome sequences of 247 Plasmodium falciparum isolates collected in The Gambia in 2008 and 2014 were analysed to identify changes possibly related to the scale-up of antimalarial interventions that occurred during this period. Overall, there were 15 regions across the genomes with signatures of positive selection. Five of these were sweeps around known drug resistance and antigenic loci. Signatures at antigenic loci such as thrombospodin related adhesive protein (Pftrap) were most frequent in eastern Gambia, where parasite prevalence and transmission remain high. There was a strong temporal differentiation at a non-synonymous SNP in a cysteine desulfarase (Pfnfs) involved in iron-sulphur complex biogenesis. During the 7-year period, the frequency of the lysine variant at codon 65 (Pfnfs-Q65K) increased by 22% (10% to 32%) in the Greater Banjul area. Between 2014 and 2015, the frequency of this variant increased by 6% (20% to 26%) in eastern Gambia. IC50 for lumefantrine was significantly higher in Pfnfs-65K isolates. This is probably the first evidence of directional selection on Pfnfs or linked loci by lumefantrine. Given the declining malaria transmission, the consequent loss of population immunity, and sustained drug pressure, it is important to monitor Gambian P. falciparum populations for further signs of adaptation.
Introduction
The success of malaria interventions such as artemisinin-based combination therapies (ACTs), seasonal malaria chemoprevention, long lasting insecticidal nets (LLIN) and indoor residual spraying (IRS) in reducing malaria burden has raised hopes for malaria elimination1,2. However, this enthusiasm is threatened by the emergence of artemisinin resistance (artR) in South East Asia (SEA)3, resulting into coordinated effort to limit its spread beyond SEA and detect any emergence in sub-Saharan Africa (sSA)4. Detailed surveillance for spatial and temporal trends in the frequencies of mutations associated with resistance to artemisinin and partner drugs is essential, particularly for the non-synonymous single nucleotide polymorphisms (SNP) in the Kelch propeller and BTB-POZ domains (KPBD) of the P. falciparum gene (Pfk13, Pf3D7_1343700) that have been associated with delayed parasite clearance; the artemisinin resistance phenotype5. The prevalence of Pfk13 artR polymorphisms is high in SEA but low in sSA6,7. However, there are increasing reports that suggest reduced susceptibility of P. falciparum to ACTs beyond SEA, including cases of complete treatment failure in Africa8–10. These artemisinin-tolerant parasites may have been selected by the increased use of ACTs in the last decade. Such selection would leave genetic markers of adaptation in the P. falciparum population.
Population genetics approaches to identify markers of local adaptation often include comparison of genetic variation between spatially separated populations. In sSA, this has been demonstrated in pairwise comparisons of P. falciparum genomes between The Gambia and Guinea, two sites within Ghana, and across eight locations spanning ~1000 Km in Mauritania11–13. These studies assessed the allele frequency spectra and patterns of linkage disequilibrium, allowing for the identification of signatures of differentiation and positive selection, which could be due to local adaptation. Isolates from these sites were mostly collected over a single transmission season and do not provide information on the stability of genomic structure of the populations over a longer period, during which changes may occur, including coverage of control interventions. Temporal analysis has helped in understanding the evolution of drug resistance loci14–16. In addition, candidate markers for artemisinin resistance in P. falciparum isolates from SEA were identified by examining SNPs with allele frequency shifts similar to the Pfk13-C580Y17 resistance marker. Presently, there is no reference marker for artR such as the Pfk13-C580Y for sSA parasites, so this approach may not be feasible. However, by comparing the genomes of isolates before and after the introduction of ACTs, genomic changes and signatures of sustained antimalarial drug pressure and decline in disease burden can be identified in settings such as The Gambia.
Between 2005 and 2015, the incidence of malaria in the Gambia dropped by over 75% following the widespread use of artemether-lumefantrine (AL) and high coverage of vector control interventions, namely LLINs and IRS18,19. Malaria transmission in the country has become increasingly heterogeneous, with prevalence of infection between ~5% and >40% in the west and eastern regions respectively20. AL was introduced as first-line treatment in 2008, replacing Sulfadoxine-Pyrimethamine (SP), which remains in use for intermittent preventive treatment during pregnancy and for seasonal malaria chemoprevention (SMC), combined with amodiaquine (since 2014)21. Chloroquine and other antimalarial monotherapy remains available and poorly regulated, in the private and informal sector (personal correspondence)22.
We recently reported an increasing proportion of P. falciparum isolates with ex vivo tolerance to lumefantrine in western Gambia23. Resistance to SP and other quinolines remain high23, with whole genome scans of the 2008 population showing strong signatures of selection around resistance markers of these drugs14,24,25. Building on this evidence, this study compared these earlier detected signatures to those of current populations. We detected sustained selection in genomic regions and new loci under differential selection that could have been selected for by drug pressure and other interventions.
Results
Temporal increase in linkage disequilibrium (LD), low complexity and spatial substructure between recent populations
Linkage disequilibrium between 16,629 coding SNPs was low in all three populations, decaying rapidly below an r2 of 0.05 within 5000 base pairs (Fig. 1). Long range LD was evident mainly for the 2008 and 2014 populations from Greater Banjul (GBJ), (Supplementary Fig. 1). The extent of LD decay correlated with parasite prevalence; being highest for the 2014 population from Basse followed by the 2008 and then 2014 GBJ populations. Median infection complexity determined by the inverse measure of outcrossing (Fws) was low for all populations despite a narrow reduction in Fws values for the GBJ 2014 samples (median Fws from 0.91 to 0.78) compared to 2008. Median Fws for Basse was 0.83, and not significantly different from the GBJ 2008 population. Isolates from the three populations did not form significantly distinct clusters by principal component analysis (PCA), based on 10,862 low LD SNPs. However, dimension 1 and 2 of the PCA analysis showed low-level separation of the recent 2014 spatial populations from GBJ and Basse, though with significant overlap of the geographic clusters (Supplementary Fig. 2). There was a low genome wide fixation index (0.014, SD 0.019), which confirms a lack of significant structure between the spatial population pair (GBJ and Basse from 2014). The spatial fixation index was higher than that observed between the temporal population pair of 2008 and 2014 from GBJ, which was 0.009, with a standard deviation of 0.0166.
Figure 1.
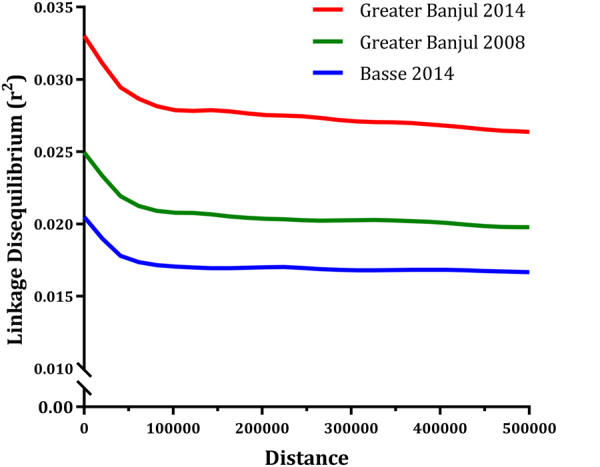
The decay of linkage disequilibrium (r2) with physical distance (kilobases) for coding single nucleotide polymorphisms in three Gambian P. falciparum populations. Each line is a smoothed fit of the pairwise linkage disequilibrium against distance per population; Greater Banjul 2008, 2014 and Basse 2014.
Consistent selective sweeps around drug resistance and antigenic loci in all populations
Regions that have undergone positive selection would show reduced heterozygosity and extended haplotypes26. Based on the standardised integrated haplotype score (|iHS|), we identified 1066SNPs within 11 regions of hard sweeps on chromosomes 1, 4, 6, 7, 8, 9, 11, 13 and 14 (Supplementary Fig. 3). There were seven consistent sweeps across all populations and these included the strongest known P. falciparum sweep that spans the chloroquine resistance transport (Pfcrt) on chromosome 7. The only two SNPs that reached the significance threshold for |iHS| in the recent 2014 population from GBJ were on coding regions of conserved proteins located 60kbp from Pfcrt (PF3D7_0710200, PF3D7_071350). The sweep on chromosome 11 spanning Pfama1 gene was only significant in the GBJ 2008 population, while that spanning the Pfmsp1 and Pftrap genes on chromosomes 9 and 13, respectively were the strongest in the 2014 Basse population. Other antigenic loci within sweep signatures included the SURFINs (1.1, 4.2 and 8.2) and merozoite surface proteins 7–like gene cluster on chromosome 13. |iHS| values are listed in Supplementary Tables (sheets: GBJ2008-2014_iHS, Basse_iHS).
Differences in signatures of positive selection between populations
Genomic loci with differences in recent selective signatures between populations were consistent for both the relative integrated extended haplotype homozygosity test between populations (Rsb) and the cross population extended haplotype homozygosity (XP-EHH) index (Fig. 2 and Supplementary Fig. 4)27. We identified 15 genomic regions (20–220 Kb, >10 SNPs and Wstat score >5) with differences in the range of extended haplotypes between population pairs (Table 1). Five of these regions on chromosomes 4, 6, 7, 8 and 13 were significantly different in both temporal and spatial comparisons of extended haplotypes. The regions on chromosome 4 and 7 spanned the known sweeps in drug resistance associates genes- Pfdhfr and Pfcrt respectively, while that on chromosome 6 had also been previously characterised28. We found relatively reduced lengths and frequencies of extended haplotypes in the 2014 populations for SNPs within the following drug resistance marker codons- Pfdhfr-S108N, Pfcrt-K76T, Pfmdr1-Y184T and Pfdhps-S436A (Supplementary Fig. 5). The bifunctional dihydrofolate synthetase–folylpolyglutamate synthetase (Pfdhfs-fpgs) located on chromosome 13 had significant differences in extended haplotype between the temporal population pair (identified only by Rsb), though it is not targeted by antifolate antimalarial regimes29.
Figure 2.

Manhattan plots of −log10 of p-values from the distribution of XP-EHH cross population test for positive selection at genome wide polymorphic coding SNP loci in P. falciparum populations from The Gambia. (a) XP-EHH derived from pairwise comparison of Greater Banjul 2008 against 2014 isolates. (b) XP-EHH derived from comparing 2014 population from Greater Banjul with that from Basse. Regions with SNP loci above a set significance threshold (p = <10−5) are marked with an asterisk.
Table 1.
Top windows of significant differences in signatures of positive selection.
| CHR | Start (kbp) | Stop (kbp) | Size (kbp) | SNPs (n) | W temp Rsb | W temp XP-EHH | W spatial Rsb | W spatial XP-EHH | Gene IDs within window |
|---|---|---|---|---|---|---|---|---|---|
| 3 | 350 | 390 | 40 | 46 | 6.2 | 6.3 | PF3D7_0307900–0309200 | ||
| 3 | 530 | 570 | 40 | 20 | 5.3 | PF3D7_0312500–0314100 | |||
| 4 | 630 | 810 | 180 | 162 | 9 | 17.4 | 20.3 | 21.9 | PF3D7_0414000–0418000* |
| 5 | 470 | 690 | 220 | 228 | 5.4 | 12.3 | PF3D7_0511200–0516600 | ||
| 6 | 1230 | 1270 | 20 | 15 | 10.3 | 12.5 | 19.2 | 12.4 | PF3D7_0629700–0630300* |
| 7 | 350 | 530 | 180 | 193 | 7 | 13.9 | 49.4 | 68.3 | PF3D7_0707500–0712000* |
| 7 | 570 | 690 | 120 | 117 | 13 | 23 | 23.3 | PF3D7_0712600–0715500* | |
| 8 | 1350 | 1370 | 20 | 30 | 8.2 | 11.7 | 5.5 | PF3D7_0831500–0831700* | |
| 9 | 210 | 290 | 80 | 69 | 7.6 | 5.7 | PF3D7_0904500–0905800 | ||
| 10 | 1430 | 1490 | 60 | 48 | 5.5 | PF3D7_1036300–1037500 | |||
| 11 | 210 | 290 | 80 | 51 | 5.8 | 6.5 | PF3D7_1104900–1106900 | ||
| 12 | 62 | 110 | 47.9 | 66 | 8.7 | PF3D7_1200700–1202000 | |||
| 13 | 1030 | 1070 | 40 | 17 | 5.4 | PF3D7_1324600–325700 | |||
| 13 | 1450 | 1530 | 80 | 94 | 8.1 | 6 | 5.4 | PF3D7_1335400–1337800* | |
| 13 | 2110 | 2130 | 20 | 29 | 11.4 | PF3D7_1352700–1353100 |
Candidate regions were defined when at least 10 SNPs within a 20kbp window had significant differences in extended haplotype homozygosity measured by cross population indices Rsb and XP-EHH between the temporal population pair from Greater Banjul (2008 versus 2014) and the spatial pair (2014 Greater Banjul and Basse populations). Physical windows (kbp)with a Wstat threshold from GenWin spline analysis between temporal and spatial pairs are represented as Wtemp and Wspatial respectively for each index. Rows with common windows between temporal and spatial pair comparisons are marked with * in the last column. The first column presents the chromosome number (CHR).
Evidence of recent positive selection on antigenic loci was also supported by Rsb and XP-EHH analyses. The signal on chromosome 8 spanned three export proteins and the invasion associated gene, Pfclag8, while that on chromosome 13 was around the Pfmsp7-like cluster and Pftrap. SNPs in the Pftrap region had the highest |iHS| in the Basse population, indicating continuous selection on these antigenic loci. Other antigenic regions of differential positive selection were coding for Pfdblmsp2 and Pflsa on chromosome 10; Pfresa and Pflsap1 on chromosome 12, which were specifically different by Rsb between temporal population pairs (Table 1). All candidate genes within positive selection windows by Rsb and XP-EHH are listed in Supplementary Tables (sheet: Rsb_XPEHH_Top Genes).
A chromosome 5 signature of positive selection in the recent GBJ-2014 population
The widest genomic region with clusters of SNPs with extended haplotype differences between the pair of temporal populations spanned 220 Kb on chromosome 5. SNPs with the highest Rsb value in this region were within the coding frame of tRNA pseudouridine synthase, putative (PF3D7_0516300), downstream of the cation transporter Pfatpase1. Examination of the decay of haplotypes in this region showed increased frequencies of haplotypes on the non-reference allele in the current GBJ 2014 population (Supplementary Fig. 6). The region codes mostly for metabolic proteins (PlasmoDB). Three of these are involved in inositol pathways, including phosphatidylinositol 3-kinase (Pfpi3k, PF3D7_0515300), which is linked to artemisinin resistance mechanisms30.
Allele frequency differences between temporal population pair
We found 6 SNPs significantly (−log10Pvalue ≥ 5) differentiating by population fixation index (FST) between our temporal population pair on chromosomes 7, 13 and 14 (Fig. 3a). The strongest evidence of temporal differentiation was observed for a non-synonymous SNP (ns-SNP) on a metabolic gene, cysteine desulfurase (Pfnfs, PF3D7_0727200), which had three ns-SNPs with high FST values. Sliding window analysis of FST values located a 27kbp haplotype around Pfnfs on chromosome 7 with significant differences in frequencies between the temporal population pair (Table 2 and Supplementary Fig. 6). SNPs in two genes upstream Pfnfs; mitochondrial import inner membrane translocase subunit TIM50, putative (Pftim50, PF3D7_0726900) and vacuolar protein sorting-associated protein 53, putative (Pfvpsa53, PF3D7_0727000) were also identified as outliers by the extended Lewontin and Krakauer (LK) test, FLK, between temporal populations (Supplementary Fig. 7a). The widest region with a cluster of differentiating SNPs between these populations was the 220 kbp selective signature identified by Rsb on chromosome 5 (Table 2). We further showed by hapFLK that haplotype frequencies around tRNA pseudouridine synthase within this chromosome 5 region differ between our temporal population pair from GBJ (Supplementary Fig. 7b). Differences in haplotype frequencies on the tRNA pseudouridine synthase on chromosome 5 and cysteine desulfarase in chromosome 7 were more significant between temporal population pair from the GBJ region. Other top hapFLK outliers included Pfclag2 on chromosome 2 and an exported protein Pfphistb next to Pfsurfin14.1 on chromosome 14. These results confirm differences in the sweep signatures detected in these regions by Rsb and XP-EHH between the temporal population pair. The chromosome 5 region is ~200 kbp upstream of the known Pfmdr1 sweep on chromosome 5, which was not detected by our genome scan.
Figure 3.

Manhattan plots the −log10 of p-values for pairwise index of fixation FST per coding SNP between temporal (Greater Banjul 2008 versus 2014) and spatial (Greater Banjul 2014 versus Basse in 2014) P. falciparum population pairs from The Gambia; (a) Weir and Cockerham’s FST between temporal populations and (b) FST between spatial populations. SNP loci with indices above the threshold of significance (p = <10−5) are marked with an asterisk.
Table 2.
Genomic windows of significant differentiation between temporal (Greater Banjul 2008 versus 2014) and spatial (Greater Banjul against Basse from 2014) P. falciparum population pairs.
| CHR | Start (kbp) | Stop (kbp) | Size (kbp) | SNPs (n) | W temp F ST | W spatial F ST | Gene IDs within window |
|---|---|---|---|---|---|---|---|
| 2 | 828.7 | 860.9 | 32.2 | 94 | 4.7 | 11.34 | PF3D7_0220600–PF3D7_0221400 |
| 4 | 630.1 | 762.3 | 132.2 | 32 | 4.53 | 5.75 | PF3D7_0414000–PF3D7_0417400 |
| 5 | 637.9 | 786.9 | 149 | 94 | 5.18 | 1.92 | PF3D7_0515400–PF3D7_0518900 |
| 6 | 1207.9 | 1242.1 | 34.2 | 18 | 5 | 3.17 | PF3D7_0629400–PF3D7_0629700 |
| 7 | 388.1 | 437.9 | 49.8 | 74 | 2.61 | 5 | PF3D7_0708500–PF3D7_0709800 |
| 7 | 1140.3 | 1167.3 | 27 | 35 | 7.27 | 1.23 | PF3D7_0726600–PF3D7_0727500 |
| 11 | 938.5 | 1058.7 | 120.2 | 78 | 1.45 | 5 | PF3D7_1123700–PF3D7_1127000 |
| 13 | 238.3 | 380.7 | 142.4 | 109 | 6.24 | 0.25 | PF3D7_1304600–PF3D7_1308400 |
Windows, in kilobase pairs (kbp), with more than 10 SNPs and Wstat threshold of at least 5 (bolded fonts) from GenWin spline analysis of FST values were considered significant and shown as Wtemp and Wspatial for temporal and spatial FST values respectively. The first column presents the chromosome number (CHR).
Allele frequency differences between spatial population pair
In line with the higher genome-wide fixation index between the spatial population pair, more SNPs (20) were significantly differentiating between GBJ and Basse isolates collected in 2014 (Fig. 3b). Half of these were located on chromosome 7, spanning the region coding for the chloroquine resistance gene (Pfcrt), (Supplementary Fig. 7c). However, the strongest indication of spatial differentiation by FST was on a s-SNP in the antigenic gene, rhoptry-associated membrane antigen (Pframa, PF3D7_0707300). High FST at ns-SNPs clustered within the coding frame of a conserved protein of unknown function (PF3D7_0710200), which has homologous domains with reticulocyte binding protein 1 (Pfrh1). This gene had significant FST values for 5 ns-SNPs and 1 s-SNP. The widest window of SNPs with high FST values between the spatial population pair was on chromosome 4, spanning the drug resistance locus Pfdhfr, which also showed sweep differences detected by Rsb and XP-EHH between the spatial population pair. SNPs around Pfdhfr were within 0.01% of top hits for haplotype frequency differences between spatial populations determined by spatial hapFLK (Supplementary Fig. 7d). Differential selection on haplotypes in the autophagy-related relate protein (Pfatg7, PF3D7_1126100) on chromosome 11 was specifically detected by hapFLK between spatial population pair. Evidence of differentiation on haplotypes common to both temporal and spatial comparisons population pairs were seen on Pfclag2 on chromosome 2, Pfset1 on chromosome 6 and Pfsurfin14.1 on chromosome 14. Indices of differentiation for SNPs are listed in Supplementary Tables file (sheets: FLK_Temporal, FLK_Spatial hapflk_temporal, hapflk_Spatial).
Directional selection of Plasmodium falciparum cysteine desulfarase variant in GBJ populations
We determined changes in frequencies of alleles at Pf3D7_07_v3:1158217 within cysteine desulfarase (Pfnfs) gene in 521 P. falciparum isolates collected yearly between 2008 and 2015. The reference allele at this locus codes for the polar charged amino acid, lysine (K) at codon 65 of Pfnfs. The alternative allele codes for the polar but uncharged amino acid, glutamine (Q). Allelic discrimination analysis of temporally collected isolates spanning this period from GBJ showed a steady increase in the frequency of the reference type allele of the Pfnfs SNP from 2010 (Fig. 4a). The Pfnfs-65K reference allele was present in 10% of clinical malaria samples from the GBJ region, at the time of introduction of ACTs in 2008 in the country. Its frequency dropped slightly to 7% by 2010 and then rose steadily to 32% of isolates by 2015. About 5–10% of isolates from mixed infections had both alleles. To explore if alleles at the Pfnfs locus have any association with drug responses, we analysed their distribution in isolates tested in vitro for susceptibility to lumefantrine in 201523. We found significantly higher IC50 concentrations for lumefantrine in P. falciparum isolates from GBJ with the reference lysine variant at Pfnfs locus (p = 0.0029), (Fig. 4b). We found lower frequencies of this variant in clinical isolates collected in 2014 and 2015 from the higher transmission region of Basse. However, the reference allele frequency also increased by 6% (from 20% to 26%) within one year in the Basse population. Allele frequencies at SNP-1,115,521 on chromosome 8 within HECT-like E3 ubiquitin ligase, putative (PF3D7_0826100) were similar for the 2008 and 2015 GBJ populations.
Figure 4.

Prevalence of variant alleles at position 1,158,217 of chromosome 7, in the cysteine desulfarase (NFS; Pf3D7_0727200) in clinical Plasmodium falciparum isolates from the Gambia; (a) the proportions of alleles in isolates from clinical malaria samples collected from Greater Banjul between 2008 and 2015. (b) Scatter plot of the lumefantrine IC50 concentrations for isolates with Pfnfs-65K (reference type) or Pfnfs-65Q (non-reference) allele.
Discussion
Plasmodium falciparum is under intense pressure from malaria control interventions across Africa and this could result in adaptation in some populations31. To identify regions of P. falciparum genome with recent signatures of selection, we compared the genomes of recently collected isolates to those collected in 2008, prior to the introduction of ACTs32. We also compared genomes across a gradient of transmission intensity to detect common selective signatures in the more recent populations as well as local signatures that could suggest an effect of variance in intervention, transmission or host characteristics between sites33,34. The population pairs analysed showed no significant structure, as expected for African populations. This indicates sustained genetic diversity within The Gambian GBJ population and significant mixing of parasites between GBJ and Basse, despite the 6-years between sampling, intense interventions and spatial separation of 350 km across the country.
Differentiation between the GBJ temporal population pair was most evident at a cysteine desulfarase gene (Pfnfs). Cysteine desulfarases are involved in the delivery of sulphur to multiple metabolic pathways, including Fe-S complex biogenesis35. Fe-S cluster-containing proteins in apicomplexans are modulated during stress conditions, drug resistance and cell development36,37. They play vital roles in housekeeping, gene expression and other cellular processes and are targeted by antimalarial drugs38,39. Moreover, iron homeostasis is essential for erythrocytic development and is implicated in drug mechanisms of quinolines40,41, same drug family like Lumefantrine. We therefore selected the SNP within the Pfnfs for an initial analysis of temporal changes in allele frequency. The frequency of the reference and minor lysine variant in Pfnfs-codon K65Q increased steadily in the GBJ population, two years after the introduction of ACTs in the country. Low transmission intensity and lower recombination in the GBJ population will favour directional selection of this allele if it confers a selective advantage. Coupled to our recent report of temporal increase in the IC50s to Lumefantrine in the GBJ Gambian population23, it is plausible that Pfnfs may be under selection from Lumefantrine. We believe this is imposed by ACTs as the IC50s to Lumefantrine for isolates carrying the lysine allele were higher in the recent GBJ population. Moreover, the increase in the lysine allele frequencies in Basse, further suggest a common driver; such as ACTs, in both populations. Determining if the driver of selection is at linked sites in Pftim50 and Pfvps53, or any of the other 7 genes within the window of differentiation could identify associated markers for Lumefantrine sensitivity monitoring. Tim50 proteins are involved in protein complex formation and trafficking across membranes42, while vps53 is a component of the heterotetrameric tethering factor named Golgi-associated retrograde protein (GARP)43. We are currently exploring these signatures in other regions of Africa with extensive Artemether-Lumefantrine use.
We found a region of extended haplotype difference between temporal populations on chromosome 5. High FST, FLK and hapFLK indices for SNPs within this window further suggest recent directional positive selection on loci in this region in the GBJ 2014 population. This is the first record of a signature of selection in this region in a recent P. falciparum population in sSA. The region codes for several metabolic proteins including Phosphatidylinositol 3-kinase, which is associated with artemisinin resistance30. The candidate SNPs in the region differentiating between temporal populations were on a tRNA pseudouridine synthase, responsible for the most abundant post-transcriptional modification of cellular RNAs44. Further analysis of this candidate region of temporal differentiation for functional association with ACT tolerance is important to determine if the genes coded for are associated with the same mechanisms mediating artemisinin resistance in SEA.
Most of the SNPs differing in frequency between the GBJ and Basse spatial populations where around the drug resistance genes, Pfcrt and Pfdhfr, suggesting differences in selective pressure from Chloroquine and SP between the sites. However, the strongest differentiating SNPs between the populations were on antigenic loci; Pframa by FST and Pftrap by differences in extended haplotype. Pframa is a GPI-anchored rhoptry protein implicated in merozoite invasion of erythrocytes while Pftrap mediates gliding motility and invasion processes of malarial sporozoites into vertebrate’s hepatocyte and mosquito’s salivary gland45–47. Selection may be imposed by differences in human population but with increased interventions against the vector, Pftrap could also be under selection by the differences in vector populations between coastal GBJ and inland Basse48. Though immune selection often results in balancing selection, we identified signatures of recent positive selection on multiple antigenic loci; Pfclag2, Pfama1, Pfmsp1, Pfdblmsp2, Pfresa, Pflsa, Pfsurfins and the Pfmsp7-like cluster. Signatures of positive selection on antigenic loci have been identified before in P. falciparum population genome scans49–51. Some of these antigenic loci are implicated in invasion mechanisms and new alleles that are occasionally introduced in a population by mutation or immigration would increase in frequency together with nearby variants before being checked by acquired immunity. These signatures were most significant in the Basse population, where exposure and immune selection could be stronger due to the relatively higher malaria transmission. Plasmodium falciparum enhances its invasion and immune evasion capacities to meet the environmental stressors, including immunity and drugs within a specific spatial or temporal population. Hence antigen haplotypes enabling fitness in the immune environment would be positively selected. Some of this complex selection pattern could be because of heterogeneity or restriction in recombination rates between allelic variants within a gene52.
Selective sweeps around drug resistance loci, Pfdhfr, Pfcrt and the extensive region on chromosome 6 that coded for Pfptps and Pfmthfd, were common across all populations analysed. This result is consistent with previous genome scans of West African populations13,14,32,53. The extent of extended haplotypes around drug resistance Pfcrt and Pfdhfr had reduced in recent GBJ population but remained strong in the Basse area with higher transmission. It is anticipated that a decay of selective sweeps would follow the withdrawal of Chloroquine and antifolates as first line treatment for malaria. However, the use of non-ACTs in rural areas such as Basse may be responsible for maintaining selective pressure on Pfcrt and Pfdhfr. Basse had a lower genome-wide LD than the GBJ population, where LD had increased between the 6 years of sampling. Higher LD in GBJ could be due to increased levels of self-fertilisation as infection prevalence and malaria transmission declined during this period. Higher LD and lower infection complexity has been reported in the Southeast Asian P. falciparum populations53,54, the epicentre of antimalarial resistance development and rapid evolution of selective sweeps. Hence, the increasing LD in GBJ and relatively lower infection complexities could favour sweeps around de novo or standing genetic variants associated with drug resistance, threatening the efficacy of antimalarials.
Conclusion
Plasmodium falciparum has a relatively short generation time and stochastic shifts in allele frequencies can occur rapidly as interventions reduce parasite populations. However, allele frequency shifts and extended haplotypes in genes implicated in pathways of adaptation can indicate a process to cope with environmental stress due to interventions. Known genomic signatures of positive selection persist in the Gambian P. falciparum population and a new extended region has been identified on chromosome 5. We found evidence of directional selection in a P. falciparum cysteine desulfarase, occurring just 6 years after introducing ACTs. Left unchecked, this could compromise Lumefantrine efficacy and ultimately, AL treatment failure. This is important and underlines the need for continuous surveillance of the role of emerging genetic variants in decreasing ACT efficacy in Africa. The association between Pfnfs-65k and Lumefantrine tolerance needs further evaluation in parasite populations from other endemic regions that rely on AL, to guide antimalarial chemotherapy policies.
Methods
Study approval
The study was reviewed and approved by MRCG scientific coordinating committee. Ethical approval for sample collection and for the use of the retrospective genomic data and samples from 2008–2011 was obtained from the Gambian Government-MRCG Joint Ethics Committee. A signed informed consent was obtained for all participants above 18 years or from parents or guardians for those below 18 years. All sample and data handling methods were performed in accordance with the relevant guidelines and regulations at MRCG.
Parasite isolates
Between 2012 and 2015, patients diagnosed with uncomplicated malaria at Brikama and Basse health centres were invited to participate in the study. After obtaining a written informed consent, a 2 ml venous blood sample was collected from each participant. Brikama is a town in the Greater Banjul (GBJ) region on the western end, while Basse is about 350 km away on the eastern end of country. These sites reflect the gradient of transmission across the country, with low transmission in the west (5–15% parasite prevalence) and moderate to high transmission in the east (15–50% parasite prevalence)20. Plasmodium falciparum isolates had been collected from western Gambia between 2008 and 2011 at the Royal Victoria Teaching Hospital in Banjul and the Brikama Health centre and stored at the Medical Research Council Unit The Gambia (MRCG) biobank. Isolates from 2008 had been sequenced and analysed previously for signatures of selection32.
Genome sequencing
Plasmodium falciparum parasite genomic DNA for sequencing was extracted from whole blood depleted of leukocytes by filtration through CF11 cellulose columns as previously described55. Sequencing was done on Illumina HiSeq platform in collaboration with the MalariaGEN consortium at the Wellcome Trust Sanger Institute, Hinxton, UK56. Paired end DNA sequence-reads (150 bp) were obtained from 44 and 124 isolates collected in 2014 from western and eastern Gambia, respectively. Together with reads from 79 isolates sequenced in 2008, they were aligned to the P. falciparum 3D7 reference genome (version 3) as previously described6,57. Nucleotide variants were called using custom in-house calling algorithms, filtering and retaining the dominant allele at bi-allelic coding variable sites in a genotype file. Each population was genotyped for 791,385 high quality SNPs supported by a minimum of five short sequence reads as defined by MalariaGEN/Pf3K pipeline. Binary haplotype data was created denoting variable nucleotides as reference (0) or non-reference (1) allele. The short reads are available via the ENA database (www.ena.org).
Population complexity, structure and linkage disequilibrium
For each isolate, infection complexity was determined by Fws as previously described57. Pairwise SNP linkage disequilibrium (LD) expressed as the coefficient of correlation (r2) between alleles at physically separated loci with a minor allele frequency (maf) of at least 2% across all populations was calculated in plink. A LOESS spline was fitted for r2 between loci within 100 kbp to compare the decay in LD with physical distance in each population. To determine if there was structure between the temporal and spatial populations, all SNPs at an LD threshold (r2) < 0.5 were used to generate a pairwise (nxn) matrix of shared alleles between isolates, with n as isolates. The matrix was employed in principal component analysis, with the first and second principal components for each isolate plotted for 2008 against 2014 GBJ populations, and for GBJ against the Basse 2014 populations.
Signatures of selection
To detect loci under recent positive selection, we calculated the extended haplotype homozygosity (EHH)–derived indices; standardised intra-population integrated haplotype score (|iHS|), and the cross-population ratio of the EHH expressed as Rsb and XP-EHH for each SNP with the R package REHH58. For iHS analysis, the reference and non-reference alleles were employed in lieu of the ancestral and derived alleles, respectively. For significance, the REHH package generates a two-sided p-value as
where Ф(iHS) represents the Gaussian cumulative distribution function. For selected significant core markers, the decay in haplotype frequencies in each population was examined with decay and bifurcation plots in R.
Population differentiation
Differentiation at SNP loci between population pairs were analysed using Wier and Cockerham’s FST per SNP, calculated with the hierfstat package in R. The variance component of FST between the pair of temporal and spatial populations were also determined in hierfstat. The significance of FST values were determined by sampling from ten million permutations of the FST distribution for each pairwise comparison. We minimised the false positive rate for differentiating loci by computing the extended Lewontin and Krakauer test, FLK, and the linked derivative hapFLK, which focuses instead on the differences of haplotype frequencies between populations59,60. The FLK index accounts for population size heterogeneity and possible hierarchical structure between populations. It computes a global FST for each SNP, but allele frequencies are first rescaled using a population kinship matrix, estimated from the observed genome wide data. With this rescaling, allele frequency differences obtained with small populations are typically down-weighted. HapFLK is an extension of FLK, integrating a multipoint linkage disequilibrium that regroups individual chromosomes into local haplotype clusters before measuring differentiation between populations59. A software for calculating FLK and HapFLK is free available on from (https://forge-dga.jouy.inra.fr/projects/hapflk). A p-value of 10−5 for FST and FLK was arbitrarily set as threshold for significance.
Outlier genomic windows of selection and differentiation
To determine genomic windows with contiguous significant signatures, we fitted a spline on FST, Rsb and XP-EHH values per chromosome with the GenWin package in R using genome-wide mean and variance values to normalise across chromosomes. GenWin defines a t-test like statistic, W, generated such that:
where x is the mean value over the window, μ is the mean value over the entire dataset, s2 is the sample variance of index across the genome, and n is the number of observations (i.e. markers) in the window61. Windows of 5000 to 25000 bp were assessed and overlapping segments with a W value > =5, with more than 10 SNPs were considered significant. Functional annotations for genes within significant windows were obtained from a combination of tools defining gene ontologies in PlasmoDB, PANTHER, DAVID, LAMP and gene ontology tools (http://geneontology.org/page/go-enrichment-analysis).
Temporal changes in allele frequency
The non-synonymous SNP at physical position 1,158,217 of chromosome 7 within the P. falciparum cysteine desulfarase gene (PF3D7_0727200) had the most significant temporal difference in allele frequency. We designed Taqman allelic discrimination assay for this polymorphism using the online assay design tool provided by life technologies (Life Technologies assay ID: AN7DRNA). We also designed an assay for a randomly chosen SNP at position 1,115,521 on chromosome 8 within HECT-like E3 ubiquitin ligase, putative (PF3D7_0826100), (Life Technologies assay ID: ANRWF4A). We genotyped these loci in 521 P. falciparum isolates from GBJ region collected in 2008 (53), 2010 (68), 2012 (57), 2013 (42), 2014 (35) and 2015 (125); and from Basse (eastern region) in 2014 (60) and 2015 (81). Furthermore, we determined the difference in Lumefantrine IC50 values for isolates with the reference or non-reference allele for 61 isolates assayed from the 2015 GBJ population. Mann Whitney t-test was used to determine the significance of the difference in mean IC50s between allele-groups with a significance level set at 0.05.
Data availability
Short sequence reads analysed are available via European Nucleotide Archive.
Electronic supplementary material
Acknowledgements
Funding for sampling was provided by the MRC/DFID/EDCTP2 via a Career Development Award to Dr Alfred Amambua-Ngwa. We are grateful to the participants, caregivers and staff of the Brikama and Basse health centres and to the National malaria Control Programme that hosted the therapeutic efficacy studies. Genome sequencing was kindly supported by the MalariaGEN programme of the Wellcome Trust Sanger Institute, Hinxton, UK.
Author Contributions
A.A.N., designed the study, analysed data and wrote the manuscript. D.J., R.A., A.W. and M.K. carried out bioinformatics analysis of sequence data. S.C., H.N., D.N. and J.O. coordinated field sampling and laboratory work. D.K. directed genome sequencing and advised on population genetics. D.C. and U.D. advised on analyses and revised the manuscript. All authors read and suggested revision on the manuscript.
Competing Interests
The authors declare no competing interests.
Footnotes
Electronic supplementary material
Supplementary information accompanies this paper at 10.1038/s41598-018-28017-5.
Publisher's note: Springer Nature remains neutral with regard to jurisdictional claims in published maps and institutional affiliations.
References
- 1.WHO. Global technical strategy for malaria 2016–2030. In WHO (ed. WHO) (2015).
- 2.Greenwood B. Review: Intermittent preventive treatment–a new approach to the prevention of malaria in children in areas with seasonal malaria transmission. Trop Med Int Health. 2006;11:983–91. doi: 10.1111/j.1365-3156.2006.01657.x. [DOI] [PubMed] [Google Scholar]
- 3.Dondorp AM, et al. Artemisinin resistance in Plasmodium falciparum malaria. N Engl J Med. 2009;361:455–67. doi: 10.1056/NEJMoa0808859. [DOI] [PMC free article] [PubMed] [Google Scholar]
- 4.WHO. The Global Plan for Artemisinin Resistance Containment (GPARC). In WHO (2010).
- 5.Ariey F, et al. A molecular marker of artemisinin-resistant Plasmodium falciparum malaria. Nature. 2014;505:50–5. doi: 10.1038/nature12876. [DOI] [PMC free article] [PubMed] [Google Scholar]
- 6.Miotto O, et al. Genetic architecture of artemisinin-resistant Plasmodium falciparum. Nat Genet. 2015;47:226–34. doi: 10.1038/ng.3189. [DOI] [PMC free article] [PubMed] [Google Scholar]
- 7.Takala-Harrison S, et al. Independent emergence of artemisinin resistance mutations among Plasmodium falciparum in Southeast Asia. J Infect Dis. 2015;211:670–9. doi: 10.1093/infdis/jiu491. [DOI] [PMC free article] [PubMed] [Google Scholar]
- 8.Kamau E, et al. K13-propeller polymorphisms in Plasmodium falciparum parasites from sub-Saharan Africa. J Infect Dis. 2015;211:1352–5. doi: 10.1093/infdis/jiu608. [DOI] [PMC free article] [PubMed] [Google Scholar]
- 9.Makanga M, Krudsood S. The clinical efficacy of artemether/lumefantrine (Coartem) Malar J. 2009;8(Suppl 1):S5. doi: 10.1186/1475-2875-8-S1-S5. [DOI] [PMC free article] [PubMed] [Google Scholar]
- 10.Group WPCS, et al. Baseline data of parasite clearance in patients with falciparum malaria treated with an artemisinin derivative: an individual patient data meta-analysis. Malar J. 2015;14:359. doi: 10.1186/s12936-015-0874-1. [DOI] [PMC free article] [PubMed] [Google Scholar]
- 11.Mobegi VA, et al. Genome-wide analysis of selection on the malaria parasite Plasmodium falciparum in West African populations of differing infection endemicity. Mol Biol Evol. 2014;31:1490–9. doi: 10.1093/molbev/msu106. [DOI] [PMC free article] [PubMed] [Google Scholar]
- 12.Duffy CW, et al. Population genetic structure and adaptation of malaria parasites on the edge of endemic distribution. Mol Ecol. 2017;26:2880–2894. doi: 10.1111/mec.14066. [DOI] [PMC free article] [PubMed] [Google Scholar]
- 13.Duffy CW, et al. Comparison of genomic signatures of selection on Plasmodium falciparum between different regions of a country with high malaria endemicity. BMC Genomics. 2015;16:527. doi: 10.1186/s12864-015-1746-3. [DOI] [PMC free article] [PubMed] [Google Scholar]
- 14.Nwakanma DC, et al. Changes in malaria parasite drug resistance in an endemic population over a 25-year period with resulting genomic evidence of selection. J Infect Dis. 2014;209:1126–35. doi: 10.1093/infdis/jit618. [DOI] [PMC free article] [PubMed] [Google Scholar]
- 15.Malmberg M, et al. Temporal trends of molecular markers associated with artemether-lumefantrine tolerance/resistance in Bagamoyo district, Tanzania. Malar J. 2013;12:103. doi: 10.1186/1475-2875-12-103. [DOI] [PMC free article] [PubMed] [Google Scholar]
- 16.Okombo J, Kamau AW, Marsh K, Sutherland CJ, Ochola-Oyier LI. Temporal trends in prevalence of Plasmodium falciparum drug resistance alleles over two decades of changing antimalarial policy in coastal Kenya. Int J Parasitol Drugs Drug Resist. 2014;4:152–63. doi: 10.1016/j.ijpddr.2014.07.003. [DOI] [PMC free article] [PubMed] [Google Scholar]
- 17.Cerqueira GC, et al. Longitudinal genomic surveillance of Plasmodium falciparum malaria parasites reveals complex genomic architecture of emerging artemisinin resistance. Genome Biol. 2017;18:78. doi: 10.1186/s13059-017-1204-4. [DOI] [PMC free article] [PubMed] [Google Scholar]
- 18.van den Hoogen LL, et al. Serology describes a profile of declining malaria transmission in Farafenni, The Gambia. Malar J. 2015;14:416. doi: 10.1186/s12936-015-0939-1. [DOI] [PMC free article] [PubMed] [Google Scholar]
- 19.Ceesay SJ, et al. Continued decline of malaria in The Gambia with implications for elimination. Plos One. 2010;5:e12242. doi: 10.1371/journal.pone.0012242. [DOI] [PMC free article] [PubMed] [Google Scholar]
- 20.Mwesigwa J, et al. Residual malaria transmission dynamics varies across The Gambia despite high coverage of control interventions. Plos One. 2017;12:e0187059. doi: 10.1371/journal.pone.0187059. [DOI] [PMC free article] [PubMed] [Google Scholar]
- 21.Bojang KA, et al. Two strategies for the delivery of IPTc in an area of seasonal malaria transmission in the Gambia: a randomised controlled trial. Plos Med. 2011;8:e1000409. doi: 10.1371/journal.pmed.1000409. [DOI] [PMC free article] [PubMed] [Google Scholar]
- 22.Frosch AE, Venkatesan M, Laufer MK. Patterns of chloroquine use and resistance in sub-Saharan Africa: a systematic review of household survey and molecular data. Malaria Journal. 2011;10:116. doi: 10.1186/1475-2875-10-116. [DOI] [PMC free article] [PubMed] [Google Scholar]
- 23.Amambua-Ngwa, A. et al. Sustained Ex Vivo Susceptibility of Plasmodium falciparum to Artemisinin Derivatives but Increasing Tolerance to Artemisinin Combination Therapy Partner Quinolines in The Gambia. Antimicrob Agents Chemother61 (2017). [DOI] [PMC free article] [PubMed]
- 24.Smalley ME, Brown J. In vitro demonstration of pyrimethamine resistance of “wild” Plasmodium falciparum in The Gambia. Trans R Soc Trop Med Hyg. 1982;76:324–8. doi: 10.1016/0035-9203(82)90181-X. [DOI] [PubMed] [Google Scholar]
- 25.Menon A, Otoo LN, Herbage EA, Greenwood BM. A national survey of the prevalence of chloroquine resistant Plasmodium falciparum malaria in The Gambia. Trans R Soc Trop Med Hyg. 1990;84:638–40. doi: 10.1016/0035-9203(90)90130-7. [DOI] [PubMed] [Google Scholar]
- 26.Voight BF, Kudaravalli S, Wen X, Pritchard JK. A map of recent positive selection in the human genome. Plos Biol. 2006;4:e72. doi: 10.1371/journal.pbio.0040072. [DOI] [PMC free article] [PubMed] [Google Scholar]
- 27.Sabeti PC, et al. Genome-wide detection and characterization of positive selection in human populations. Nature. 2007;449:913–8. doi: 10.1038/nature06250. [DOI] [PMC free article] [PubMed] [Google Scholar]
- 28.Amambua-Ngwa A, et al. Exceptionally long-range haplotypes in Plasmodium falciparum chromosome 6 maintained in an endemic African population. Malar J. 2016;15:515. doi: 10.1186/s12936-016-1560-7. [DOI] [PMC free article] [PubMed] [Google Scholar]
- 29.Salcedo E, Cortese JF, Plowe CV, Sims PF, Hyde JE. A bifunctional dihydrofolate synthetase–folylpolyglutamate synthetase in Plasmodium falciparum identified by functional complementation in yeast and bacteria. Mol Biochem Parasitol. 2001;112:239–52. doi: 10.1016/S0166-6851(00)00370-4. [DOI] [PubMed] [Google Scholar]
- 30.Mbengue A, et al. A molecular mechanism of artemisinin resistance in Plasmodium falciparum malaria. Nature. 2015;520:683–7. doi: 10.1038/nature14412. [DOI] [PMC free article] [PubMed] [Google Scholar]
- 31.Webb, J. L. A. Jr. The long shadow of malaria interventions in tropical Africa. The Lancet374, 1883–1884. [DOI] [PubMed]
- 32.Amambua-Ngwa A, et al. Population genomic scan for candidate signatures of balancing selection to guide antigen characterization in malaria parasites. PLoS Genet. 2012;8:e1002992. doi: 10.1371/journal.pgen.1002992. [DOI] [PMC free article] [PubMed] [Google Scholar]
- 33.Mwesigwa J, et al. On-going malaria transmission in The Gambia despite high coverage of control interventions: a nationwide cross-sectional survey. Malar J. 2015;14:314. doi: 10.1186/s12936-015-0829-6. [DOI] [PMC free article] [PubMed] [Google Scholar]
- 34.Wiseman V, Scott A, Conteh L, McElroy B, Stevens W. Determinants of provider choice for malaria treatment: experiences from The Gambia. Soc Sci Med. 2008;67:487–96. doi: 10.1016/j.socscimed.2008.04.007. [DOI] [PubMed] [Google Scholar]
- 35.Schwartz CJ, Djaman O, Imlay JA, Kiley PJ. The cysteine desulfurase, IscS, has a major role in in vivo Fe-S cluster formation in Escherichia coli. Proc Natl Acad Sci USA. 2000;97:9009–14. doi: 10.1073/pnas.160261497. [DOI] [PMC free article] [PubMed] [Google Scholar]
- 36.Gisselberg JE, Dellibovi-Ragheb TA, Matthews KA, Bosch G, Prigge ST. The suf iron-sulfur cluster synthesis pathway is required for apicoplast maintenance in malaria parasites. Plos Pathog. 2013;9:e1003655. doi: 10.1371/journal.ppat.1003655. [DOI] [PMC free article] [PubMed] [Google Scholar]
- 37.Dellibovi-Ragheb TA, Gisselberg JE, Prigge ST. Parasites FeS up: iron-sulfur cluster biogenesis in eukaryotic pathogens. Plos Pathog. 2013;9:e1003227. doi: 10.1371/journal.ppat.1003227. [DOI] [PMC free article] [PubMed] [Google Scholar]
- 38.van Dooren GG, Stimmler LM, McFadden GI. Metabolic maps and functions of the Plasmodium mitochondrion. FEMS Microbiol Rev. 2006;30:596–630. doi: 10.1111/j.1574-6976.2006.00027.x. [DOI] [PubMed] [Google Scholar]
- 39.Lill R, Broderick JB, Dean DR. Special issue on iron-sulfur proteins: Structure, function, biogenesis and diseases. Biochim Biophys Acta. 2015;1853:1251–2. doi: 10.1016/j.bbamcr.2015.03.001. [DOI] [PMC free article] [PubMed] [Google Scholar]
- 40.Laleve A, et al. The antimalarial drug primaquine targets Fe-S cluster proteins and yeast respiratory growth. Redox Biol. 2016;7:21–29. doi: 10.1016/j.redox.2015.10.008. [DOI] [PMC free article] [PubMed] [Google Scholar]
- 41.Naziha Bakouh SB, et al. Iron is a substrate of the Plasmodium falciparum chloroquine resistance transporter PfCRT in Xenopus oocytes. The Journal of Biological Chemistry. 2017;292:16109–16121. doi: 10.1074/jbc.M117.805200. [DOI] [PMC free article] [PubMed] [Google Scholar]
- 42.Sheiner L, Soldati-Favre D. Protein trafficking inside Toxoplasma gondii. Traffic. 2008;9:636–46. doi: 10.1111/j.1600-0854.2008.00713.x. [DOI] [PubMed] [Google Scholar]
- 43.Bonifacino JS, Hierro A. Transport according to GARP: receiving retrograde cargo at the trans-Golgi network. Trends Cell Biol. 2011;21:159–67. doi: 10.1016/j.tcb.2010.11.003. [DOI] [PMC free article] [PubMed] [Google Scholar]
- 44.Hamma T, Ferre-D’Amare AR. Pseudouridine synthases. Chem Biol. 2006;13:1125–35. doi: 10.1016/j.chembiol.2006.09.009. [DOI] [PubMed] [Google Scholar]
- 45.Topolska AE, Lidgett A, Truman D, Fujioka H, Coppel RL. Characterization of a membrane-associated rhoptry protein of Plasmodium falciparum. J Biol Chem. 2004;279:4648–56. doi: 10.1074/jbc.M307859200. [DOI] [PubMed] [Google Scholar]
- 46.Ghosh AK, et al. Malaria parasite invasion of the mosquito salivary gland requires interaction between the Plasmodium TRAP and the Anopheles saglin proteins. Plos Pathog. 2009;5:e1000265. doi: 10.1371/journal.ppat.1000265. [DOI] [PMC free article] [PubMed] [Google Scholar]
- 47.Akhouri RR, Sharma A, Malhotra P, Sharma A. Role of Plasmodium falciparum thrombospondin-related anonymous protein in host-cell interactions. Malar J. 2008;7:63. doi: 10.1186/1475-2875-7-63. [DOI] [PMC free article] [PubMed] [Google Scholar]
- 48.Caputo B, et al. Anopheles gambiae complex along The Gambia river, with particular reference to the molecular forms of An. gambiae s.s. Malar J. 2008;7:182. doi: 10.1186/1475-2875-7-182. [DOI] [PMC free article] [PubMed] [Google Scholar]
- 49.Amambua-Ngwa A, et al. SNP genotyping identifies new signatures of selection in a deep sample of West African Plasmodium falciparum malaria parasites. Mol Biol Evol. 2012;29:3249–53. doi: 10.1093/molbev/mss151. [DOI] [PMC free article] [PubMed] [Google Scholar]
- 50.Ocholla H, et al. Whole-genome scans provide evidence of adaptive evolution in Malawian Plasmodium falciparum isolates. J Infect Dis. 2014;210:1991–2000. doi: 10.1093/infdis/jiu349. [DOI] [PMC free article] [PubMed] [Google Scholar]
- 51.Mu J, et al. Plasmodium falciparum genome-wide scans for positive selection, recombination hot spots and resistance to antimalarial drugs. Nat Genet. 2010;42:268–71. doi: 10.1038/ng.528. [DOI] [PMC free article] [PubMed] [Google Scholar]
- 52.Tanabe K, et al. Allelic dimorphism-associated restriction of recombination in Plasmodium falciparum msp1. Gene. 2007;397:153–60. doi: 10.1016/j.gene.2007.04.033. [DOI] [PubMed] [Google Scholar]
- 53.Volkman SK, et al. A genome-wide map of diversity in Plasmodium falciparum. Nat Genet. 2007;39:113–9. doi: 10.1038/ng1930. [DOI] [PubMed] [Google Scholar]
- 54.Przeworski M. The signature of positive selection at randomly chosen loci. Genetics. 2002;160:1179–89. doi: 10.1093/genetics/160.3.1179. [DOI] [PMC free article] [PubMed] [Google Scholar]
- 55.Venkatesan M, et al. Using CF11 cellulose columns to inexpensively and effectively remove human DNA from Plasmodium falciparum-infected whole blood samples. Malar J. 2012;11:41. doi: 10.1186/1475-2875-11-41. [DOI] [PMC free article] [PubMed] [Google Scholar]
- 56.Bentley DR, et al. Accurate whole human genome sequencing using reversible terminator chemistry. Nature. 2008;456:53–9. doi: 10.1038/nature07517. [DOI] [PMC free article] [PubMed] [Google Scholar]
- 57.Manske M, et al. Analysis of Plasmodium falciparum diversity in natural infections by deep sequencing. Nature. 2012;487:375–9. doi: 10.1038/nature11174. [DOI] [PMC free article] [PubMed] [Google Scholar]
- 58.Gautier M, Vitalis R. rehh: an R package to detect footprints of selection in genome-wide SNP data from haplotype structure. Bioinformatics. 2012;28:1176–7. doi: 10.1093/bioinformatics/bts115. [DOI] [PubMed] [Google Scholar]
- 59.Fariello MI, Boitard S, Naya H, SanCristobal M, Servin B. Detecting signatures of selection through haplotype differentiation among hierarchically structured populations. Genetics. 2013;193:929–41. doi: 10.1534/genetics.112.147231. [DOI] [PMC free article] [PubMed] [Google Scholar]
- 60.Bonhomme M, et al. Detecting selection in population trees: the Lewontin and Krakauer test extended. Genetics. 2010;186:241–62. doi: 10.1534/genetics.110.117275. [DOI] [PMC free article] [PubMed] [Google Scholar]
- 61.Beissinger TM, Rosa GJ, Kaeppler SM, Gianola D, de Leon N. Defining window-boundaries for genomic analyses using smoothing spline techniques. Genet Sel Evol. 2015;47:30. doi: 10.1186/s12711-015-0105-9. [DOI] [PMC free article] [PubMed] [Google Scholar]
Associated Data
This section collects any data citations, data availability statements, or supplementary materials included in this article.
Supplementary Materials
Data Availability Statement
Short sequence reads analysed are available via European Nucleotide Archive.