

Abstract
Drug combinations have been proposed as a promising therapeutic strategy to overcome drug resistance and improve efficacy of monotherapy regimens in cancer. This strategy aims at targeting multiple components of this complex disease. Despite the increasing number of drug combinations in use, many of them were empirically found in the clinic, and the molecular mechanisms underlying these drug combinations are often unclear. These challenges call for rational, systematic approaches for drug combination discovery. Although high-throughput screening of single-agent therapeutics has been successfully implemented, it is not feasible to test all possible drug combinations, even for a reduced subset of anticancer drugs. Hence, in vitro and in vivo screening of a large number of drug combinations are not practical. Therefore, devising computational methods to efficiently explore the space of drug combinations and to discover efficacious combinations has attracted a lot of attention from the scientific community in the past few years. Nevertheless, in the absence of consensus regarding the computational approaches used to predict efficacious drug combinations, a plethora of methods, techniques and hypotheses have been developed to date, while the research field lacks an elaborate categorization of the existing computational methods and the available data sources. In this manuscript, we review and categorize the state-of-the-art computational approaches for drug combination prediction, and elaborate on the limitations of these methods and the existing challenges. We also discuss about the recent pan-cancer drug combination data sets and their importance in revising the available methods or developing more performant approaches.
Keywords: drug combination, cancer, predictive methods, pharmacogenomics, machine learning, drug synergy
Introduction
Chemotherapy is considered as one of the main pillars in cancer treatments, and is used for both palliative and curative purposes. Despite enormous investments during the past few decades toward identification of chemotherapeutic agents effectively killing the malignant cells, the response rate in most cancers remains low [1–5]. Advances in molecular profiling have shed light into the hallmarks of cancer [6]. Improved understanding of molecular biology of cancer and the evolution of high-throughput technology enabled the development of targeted therapies that are chemicals targeting cancer-specific proteins or pathways [2]. For instance, imatinib has been developed to inhibit tyrosine kinase, which is crucial in chronic myeloid leukemia patients with the breakpoint cluster region abl (BCR-Abl) [7], gefitinib and erlotinib for non-small-cell lung cancer patients with epidermal growth factor receptor mutations [8], or vemurafenib for patients with melanomas harboring BRAF V600E mutation [9]. Such advances accelerated the discovery of more efficient treatment strategies. However, evolution of tumors could result in resistant cancer populations owing to intra-tumor heterogeneity [10]. Different mechanisms such as mutation in the target domain and activation of alternative pathways could result in resistance to targeted therapeutics [11]. In addition, tumor subpopulations that were resistant to a therapy may survive and proliferate, giving rise to a tumor that does not respond to the assigned therapeutics anymore [12–18].
To conquer the limitations of the monotherapy regimens, combination therapeutics have been proposed a promising new therapeutic strategy [19]. The rationale behind this strategy is to overcome the complexity of cancer by targeting multiple components of the disease [1, 20]. Moreover, it may be possible to increase the efficacy of each agent in the combination without escalating doses of single agents, resulting in lower toxicities in patients, decrease in resistance to a monotherapeutic agent or decrease in the adverse effect of a monotherapy regimen [5]. For example, targeting MEK and BRAF as two components of mitogen-activated protein kinase (MAPK) pathway in patients with melanomas harboring BRAF V600E mutations shows less toxic effect and resistance with respect to targeting MAPK or BRAF inhibitors alone [11, 21, 22]. Therefore, developing drug combinations with higher efficacies with respect to monotherapeutic strategies would be a chance to improve the control of tumor growth and survival of cancer patients. In clinic, cocktails of well-known drugs, as combination of two or more drugs, have been tested to control tumor growth in patients whose tumors are resistant to monotherapies. However, most of these combinations are the fruit of intensive trials and errors, and few have been designed based on our understanding of their mechanisms of action, leaving many challenges in identifying novel efficacious drug combinations and getting approval for their clinical usage.
Although drug combinations appear to be a promising therapeutic strategy with respect to monotherapy, developing new combination regimen to the clinical setting is difficult. According to the guidelines developed by the US Food and Drug Administration (FDA), the European Medicines Agency and the World Health Organization, justification of a combination therapy should be provided relying on the biology of the disease of interest and preclinical studies (in vitro and preferably in vivo) [23]. Two most common approaches to perform preclinical tests are cell-line-based systems (in vitro) and patient-derived tumor xenografts (PDXs, as an in vivo setting). Combination of potential single agents in vitro helped the biomedical research to discover new potential and highly effective combinatorial chemotherapeutics for different types of cancers [24–27]. However, it has been shown that cancer cell lines do not fully recapitulate the molecular aberrations observed in patients [28]. In an effort to develop drug testing in vivo models, several initiatives have been launched to screen single-agent and drug combinations in PDXs [29–31]. A recent study from Novartis showed that responses of PDX models are more informative than the cell-line-based systems [31]. However, applying PDX models is more expensive and labor-intensive compared with the traditional cell-line-based systems. Consequently, widespread use of the PDX models has been hindered [32].
Although high-throughput screening of single-agent therapeutics has been successfully implemented [33–35], it is not feasible to test all possible drug combinations, even for a small subset of anticancer drugs. Assuming 1000 single agents, half a million experiments should be performed for only one dose pair with one replicate. Hence, combination of more than two drugs may require billions of experiments [36, 37]. Therefore, in vitro and in vivo screening of a large number of drug combinations are not practical. During the past decade, computational approaches have been developed to overcome the limited throughput of experimental testing [36–43]. The need to develop in silico predictive models of drug synergy resulted in launching two community challenges by the Dialogue for Reverse Engineering Assessments and Methods (DREAM) consortium [44]. The first DREAM challenge on drug combination aimed at developing in silico methods to rank 91 drug combinations from most synergistic to most antagonistic. The combinations were tested on OCI-LY3 human diffuse large B-cell lymphoma cell line [27]. More recently, AstraZeneca–Sanger Drug Combination DREAM Challenge was launched with the same purpose but containing 85 cancer cell lines, and 11 759 drug combination screening for 118 drugs [44]. The data set provided in this challenge as well as a recent drug combination study by O’Neil etal. [45], including 583 doublet combinations in 39 diverse cancer cell lines, are the only pan-cancer drug combination data sets that have been released to date.
Computational approaches and mathematical models used for analysis and prediction of combination therapies can be categorized as follows: (1) quantification methods, (2) predictive approaches and (3) methodologies for optimal designs of combinatorial treatment assays (Figure 1). More than 10 models have been developed for the quantification of experimental combination therapies [46–57], and several reviews have been dedicated to compare these models [48, 58–63]. The predictive models have been designed to differentiate synergistic, additive and antagonistic combinations and predict new synergistic combinations in silico [27, 36–43]. These computational approaches incorporate multiple data types such as transcriptomic data [42], cell signaling pathway data [42], chemical similarity between drugs as well as available data of drug combination experiments [27]. In the optimization category of methods, the computational pipelines can be used to guide the experimental study by providing a list of combinations that potentially would include more synergistic combinations [37]. Recent reviews describe a subset of the existing predictive models of drug combinations [64], system biology-based predictive methods [65] and the challenges in drug combination discovery [66]. In this review, we provide a comprehensive study of all steps in drug combination discovery in which computational biologists can contribute toward discovering novel combinations of therapies to treat cancer. The four widely used quantification methods, namely, median-effect, Loewe additivity, Bliss independence and highest single agent, are provided in enough details to use them for quantification of experimental drug combination data with enough knowledge about their similarities. Moreover, we provide the details of the predictive methods for drug combination discovery in cancer to help computational biologists choose the most adapted for their study and to improve over the state of the art. The assessment strategies are provided as well to emphasize the importance of the validation procedure. In addition, we discuss about the challenges regarding the quantification, prediction and assessment of drug combination response for cancer cells and the potential improvements to make the predictive approaches practical for clinical settings.
Figure 1.

Schematic diagram of steps in which mathematical and computational methods can contribute in drug combination development: (A) quantification of experimental drug combination; (B) potential data sources for predictive drug combination approaches; (C) predictive computational approaches.
Quantification of experimental drug combination
The purpose of quantification models is to determine a reference or ‘non-interaction level’ in which a combination of drugs is considered additive and the participated drug pair do not cooperate [63]. If drugs are non-interactive and the combination is additive, the inhibitory effect of the drug combination, obtained using the median effect metrics (Table 1), can be considered as the addition of the effect of each single agents. Deviation from the reference (or additive level) can be estimated and used to categorize the combinations into antagonistic and synergistic [46–57, 67]. There are multiple reference models including median-effect, Loewe additivity, Bliss independence and highest single agent, which can be used to quantify the experimental drug combination data and classify them as synergistic/antagonistic with more/less inhibitory effects with respect to the addition of the inhibitory effect of each drug in the combination, respectively [23, 50, 56, 57, 63, 67].
Table 1.
Definition of the median effect metrics for the effect of drug compounds on biological systems (such as tumors or cancer cells)
| Metric | Definition |
|---|---|
| IC50 (half maximal inhibitory concentration) | Drug concentration at which 50% of the cells would die with respect to DMSO |
| EC50 (half maximal effective concentration) | Drug concentration at which half of the maximum potential of the drug for inhibiting tumor growth can be seen |
| GI50 (half maximum inhibition of cell proliferation) | Drug concentration that inhibits the growth of cancer cells by 50% |
Efforts during the past decades for quantification of the effect of drug combinations with respect to the effect of the single agents resulted in several models such as median-effect, Loewe additivity and Bliss independence (definition of some of the alternative methods can be found in references [23, 63]). Different steps in assessing synergism and antagonism using these methods are schematically shown in Figure 2. In these methods, a reference or non-interactive level is defined to identify synergism and antagonism as the positive and negative difference from this reference, respectively [50, 56, 57, 67]. A continuous parameter, usually called combination index (CI), can be obtained as a measure for deviation of the inhibitory effect of the combination from additivity (Figure 2). Then, CI can be used to categorize the drug combinations as being synergistic (CI < 1), additive (CI ∼1) and antagonistic (CI > 1). These different categories can be also shown graphically in an isobologram proposed by Loewe (Supplementary Figure S2) [57]. The difference between the integral of combinatorial dose–response hyperplane and the reference hyperplane (by adding the response of single agents) estimated from experimental sensitivity data can also be used to quantify synergism [45]. Software packages enabling the computation of Loewe additivity, Bliss independence and median-effect methods are provided in Table 2.
Figure 2.

Schematic representation of steps in quantification methods: (A) median-effect method: ma, mb and mc are slopes and Dma, Dmb and Dmab are y-intercepts of the log–log diagrams (Hill-type coefficients) for drug A, drug B and their combination, respectively. DA and DB also defined as DA = (Dx)AB (a/(a + b)), DB = (Dx)AB (b/(a + b)) where a/b is the ratio of drugs A and B in the combination. Mutually exclusive drugs and non-exclusive drugs are the ones that act competitively and noncompetitively on the same target, respectively (their difference can be seen in the log–log diagrams (Supp. Fig. 1)). (B) Loewe additivity method: DA and DB are the drug doses of drugs A and B in the combination, which can cause the assumed inhibitory effect (such as 50% inhibition). (C) Bliss independence method: Ea, Eb and Eab are the inhibitory effects of drugs A and B and their combination. Eadd is also the reference measure or additive effect of the combination of drugs. Eobserved is also the observed inhibitory effect of the combination of drugs A and B with the considered doses a and b [23, 50, 56, 57, 63, 67].
Table 2.
Software packages implementing the Loewe additivity, Bliss independence and median-effect methods
| Method | Software and packages | References and Web sites |
|---|---|---|
| Loewe additivity | drc (R), SYNERGY(R), Chalice, CombiTool, PharmacoGx, GeneData, Combenefit | |
| Bliss independence | Chalice, CombiTool, PharmacoGx, GeneData, Combenefit | |
| Median-effect | CompuSyn, CalcuSyn, PharmacoGx, GeneData |
Median-effect approach
Based on the median effect principle of the mass action law [57, 67], this approach constructs the median effect plot as shown in Supplementary Figure S1 using the fundamental equation in this method fa/fu = (D/Dm)m where fa is the affected (inhibited) fraction of the cancer cell population, fu (fu= 1-fa) is the corresponding unaffected fraction, D is the drug dose, Dm is dose required to produce the median effect (IC50, EC50) and m is a Hill-type coefficient signifying the sigmoidicity of the dose–effect curve [67]. Then, the equation Dx = Dm(fa/(1-fa))(1/m) is applied to obtain Dx, which is used to define CI as shown in Figure 2A.
Loewe additivity method
Single drug doses and combination doses for the considered inhibitory effect (such as IC50) are used to obtain CI for each combination (Figure 2B).
Bliss independence approach
In this method, the additive effect is calculated as the summation of the effect of the single agents in the given doses and compared with the observed inhibitory effect of the same drug dose combination as shown in Figure 2C.
Highest single-agent approach
In this method, CI can be obtained easily as the maximum effect of the single agents in the combination over the inhibitory effect of the drug combination (max(Ea, Eb)/Eab) [23].
Despite years of effort in the quantification of the effect of combination of compounds in biological systems, there is still no standardized approach for identification of synergistic, additive and antagonistic combinations [23, 47, 63], and the widely used methods (shown in Figure 1) have some limitations and problems. Loewe additivity model relies on accurately estimated dose–response curve and the response has to fall between the estimated Emin and Emax after using four-parameter logistic model [23, 47, 63]. When dose–response curves are not accurately estimated, usually because of noise or insufficient sample size, Bliss independence provides a more accurate estimate of the effect of combination because Bliss Independence assess each combination dose and is not a representative measure for the entire tested dose space. This strategy is useful in high-throughput screening where the number of data points is sometimes low [23, 47]. Nevertheless, Bliss-independence model estimations are prone to false-positive results because the variability of the response measures is neglected [23, 47]. Median-effect model also relies on linearity of the median-effect plot (Supplementary Figure S1), which may not be relevant in some diseases (or tissue types) or combination of some agents [72]. As presented in Figure 2, the CI defined in median-effect method for mutually exclusive drugs is the same as the definition of CI in Loewe additivity approach. All these strategies can be used to quantify the experimental data that comprise the target measures predicted by predictive drug combination approaches. There are various data types that can be used to predict the quantified measures of the drug combination efficacy. Those data types are discussed in the following section.
Potential data sources for predictive drug combination approaches
The process of drug discovery includes three important primary steps: (1) the discovery of drug targets, (2) development of a library of potential compounds and (3) investigation of the interactions between the compounds and the target [73]. To identify synergistic, or antagonistic drug combinations, these data would be available for the single agents in the combinations (Figure 3). This information can be used to predict the effect of the agents in combination and discover highly synergistic combinations. The identified combinations can be validated in vitro, and combinations with verified synergistic inhibition can be passed to the next steps of drug development. Moreover, the predictive approaches can be used to recognize the antagonistic combinations, which have to be avoided in the clinic. The four main categories of data that can potentially be used to predict the efficacy of drug combinations are as follows.
Figure 3.

Potential data for predictive in silico pipelines of drug combinations prediction including information about drugs, targets as well as response of the cell lines or tumor cells to drugs as single agent or in combination with other agents.
Target–Target
Interaction of target could be a direct interaction or an indirect interaction via downstream pathways. Data regarding the potential drug targets and their interactions, which have been used in the literature to predict efficacious drug combinations, can be molecular profiling of tumor, such as genomic and proteomic and their processed form such as signaling pathways and interaction networks [40, 41].
Drug–Target
Putative targets of the single agents in a combination have also been used to predict efficacy of drug combinations [27, 42]. Bioassays are the common tests for drug target identification [73]. Existence of drug targets in the same pathway was shown to be predictive of synergism [1]. For example, inhibition of MEK and BRAF as two druggable targets in MAPK pathway have been shown to be synergistic in melanomas harboring BRAF V600E mutations [21]. Drugs in general can be categorized as single target and multi-targets [1]. In the case of multi-target drugs, combinations could be even more efficacious than the combination of targeted agents, as they can target a large number of features and pathways crucial to cancer cells [1].
Drug–Drug
Chemical information about drugs, such as similarity of structure and biochemical properties between drugs, and their functional classification, such as anatomical therapeutic classification (ATC), can be used to improve predictions of effective combination therapies.
Pharmacological
Response of the cancer cells to the drugs, under monotherapy and/or combination therapy, can be used to obtain the potential targets with similar response to the same drug or the drugs with similar mechanisms of action [26, 42]. Response of cancer cells to drug combinations can be helpful to use supervised learning algorithm, while lack of such data for most cancer cell lines or tumor types causes difficulties to use supervised methods in predicting the effect of drug combinations.
Resources for each of these data types, along with its related tools, are provided in Supplementary Table S1.
Predictive computational approaches
In the absence of consensus regarding the computational approaches used to estimate and predict drug synergism, a plethora of methods, techniques and hypotheses have been developed to date, and even benchmarked in the community-wide DREAM challenge [27]. We categorize the applied approaches by their mainly varying aspects, as follows: (1) assumptions about drug combination synergism, (2) using a systems-based versus an isolated perspective to the problem, (3) exploring pairwise combination versus cocktail of drugs, (4) connectivity mapping (CMap) utilization and (5) the applied computational methods (Table 3).
Table 3.
A summary of computational approaches for drug combination prediction
| Category | Publication | Method summary | Assumptions | Systems versus isolated | Combination type | CMap |
|---|---|---|---|---|---|---|
| Explicit Mathematical Methods |
|
|
|
|
|
|
| Stochastic Search algorithms |
|
|
|
|
|
|
| Machine Learning |
|
|
|
|
|
Assumptions about synergism
The underlying mechanisms of efficacious combinations are complex and highly dependent on the drugs of interest. Hence, the research community has used various intuitive assumptions about compounds’ crucial characteristics that can lead to synergistic combinations. Bansal et al. have reviewed the approaches applied by the groups that participated in the 2014 drug combination DREAM challenge, and categorized the main assumptions as follows: (i) similar compound activity, (ii) dissimilar compound activity, (iii) combination of similar and dissimilar activity and (iv) pursuing more complex synergistic relationships [27]. The three best-performing methods, recognized by the DREAM challenge, used the first and third aforementioned assumptions. Studies performed before the DREAM challenge had applied similar assumptions. For instance, applying the first assumption, Zhao et al. compiled a set of commonly enriched patterns in molecular and pharmacological data of known effective combinations, and used the patterns for determining synergism for new combinations [43]. Similarly, Li et al. assumed that combining drugs acting on the same or related functional pathways can result in synergistic behavior [74]. Alternatively, drugs with independent actions, or drugs targeting different disease-related pathways, have also been assumed to have synergistic or complementary effects [39, 41].
Systems-based versus isolated perspective
A systems-based approach views cancer as a complicated disease resulting from interactions between many genomics, proteomics, transcriptomics and metabolomics modules in the cellular system. Similarly, the drug combination problem can be viewed holistically as a systems biology problem. The interacting modules may reveal more information regarding the underlying mechanisms of action for synergistic/antagonistic drugs. Systems-based approaches manifest the aforementioned modular interactions by constructing various cellular networks [39–42, 74, 75], and assume drug administration affects and modifies certain pathways, subnetworks and modules of these networks [75]. Therefore, capturing those modifications and comparing them with the same cellular networks constructed for the effective combinations can provide insight into mechanisms of actions of single drugs, as well as suggesting effective approaches to combine them. In contrast, some computational approaches to drug combination prediction have opted for an isolated perspective. These approaches may either rely on one single data type for the prediction [39, 75], or applying multiple data types, they do not use a holistic view, and do not take the interactions into account [43].
Pairwise or cocktail of drugs combination
Cocktail of drugs addresses combination of more than two drugs. Hence, the number of possible combinations, to be explored, is even larger than the number of pairwise combinations. Furthermore, possible dosing schedules of each single agent participating in the combination must be explored and optimized as well. Therefore, the cocktail problem is computationally more difficult and costly to tackle. Furthermore, possible dosing schedules of each single agent participating in the combination must be explored and optimized as well. Nevertheless, it is common to use combination of more than two drugs in clinical settings [76–78]. While most of the efforts in the computational research community target the pairwise combination problem, some of the approaches can handle drug combination of arbitrary size as well [37, 74, 75, 79]. However, to make the cocktail of drugs problem tractable, these approaches have to restrict the problem, for instance, by limiting the number of individual compounds [37, 75, 79].
Using CMap
CMap [80] is one the large-scale pharmacogenomics data sets that have revolutionized computational pharmacogenomics area, single drug-repurposing and novel drug discovery [80, 81], and have provided an important tool for computational drug combination as well. CMap comprises two components: (i) drug-induced gene expression profiles (also called genetic perturbations), and (ii) statistical pattern matching algorithms to measure similarity between expression profiles induced by drugs, diseases, etc. We categorize computational combination approaches according to whether they use CMap framework. However, CMap may be used as either a single fundamental data resource [39] or in integration with other data sources [41, 42, 75].
Computational methods
Three main categories of computational methods are recognized in the drug combination literature, which are the explicit mathematical methods, stochastic search algorithms and machine learning methods.
Explicit mathematical methods
Explicit mathematical methods refer to pipelines that apply one or several direct mathematical models and statistical tests to predict the synergism in drug combination effects. The two best-performing methods in the 2014 drug combination DREAM challenge, such as Drug Induced Genomic Residual Effect (DIGRE) and IUPUI_CCBB methods, belong to this category [27]. In contrast to machine learning approaches, these methods do not rely on positive and negative samples to predict synergy between drugs. Explicit mathematical methods aim to explicate the relationship between drug combination synergy and transcriptomic changes induced by individual drugs via direct and simplistic mathematical models. Therefore, success rates of these methods mainly depend on the quality of assumptions behind the models.
While the compounds were administered simultaneously in the experimental assays for the DREAM challenge, for DIGRE’s development, Yang et al. modeled synergy sequentially, and assumed that treating cell by compound A (before compound B) would affect the drug-induced transcriptomic changes by compound B [27]. DIGRE comprises three steps. First, a compound–compound similarity measure is computed by comparing the perturbation profiles after treatment by individual drugs and by overlapping profiles with genes associated with the cell-growth-related pathways, extracted from KEGG database. Second, drug-response curve information and the similarity score are integrated via a mathematical model to estimate induced cell death by the compound combination. Finally, the induced cell death is calculated for both possible sequences of compound treatments. The two cell death values are averaged and used as the final cell death or synergistic score.
For IUPUI_CCBB, Goswami and Li assumed that a core subset of genes is responsible for drug inhibitory effects [27]. They identified differentially expressed genes for each drug treatment by comparing gene expression profiles measured at time point 6 h versus control. All the significantly expressed genes were combined to compile a unique gene list that formed the ‘core’ gene set. Members of the core gene set that were significantly differentially expressed by both drugs were determined. Genes with the same and opposite direction of regulation in both drugs were determined as synergistic and antagonistic genes, respectively. Subsequently, an interaction score was calculated based on the number of synergistic and antagonistic genes. The higher the score the more synergistic is a combination. Probabilistic concordance index (PC-index) [82] was used to measure performance of the methods. DIGRE and IUPUI_CCBB both scored ∼0.61, that is statistically significantly better than random.
Lee et al. applied a CMap-based approach to the prediction of drug combinations [39]. The authors assumed that combination of two drugs, regulating two different disease-specific pathways, can be synergistic. First, a ‘query signature’, that is a list of genes whose expression is significantly associated with a disease state or other condition of interest [80], is provided and highly enriched pathways in the query signature are identified by performing gene set enrichment analysis. Next, gene expression pattern matching is performed to measure similarity between the query signature and drug perturbation profiles in CMap. For each identified pathway, enrichment analysis was performed on the CMap drug profiles, and the drugs were rank-ordered accordingly. Assume two pathways P1 and P2 are highly enriched in profiles of two drugs, A and B, respectively. The authors assumed that the drug pair could behave synergistically or complementarily, if P2 is enriched in the profile of the drug A, and vice versa. The methods applied in this study were all statistical tests such as hypergeometric and Kolmogorov–Smirnov.
Wei et al. generated a gene expression signature associated with glucocorticoid resistance in acute lymphoblastic leukemia cells [83]. Using CMap, the authors identified the mTOR inhibitor rapamycin as a potential small molecule that reverses the resistance signature. Rapamycin is an FDA-approved drug, and it has been given safely in combination with glucocorticoids to patients with organ transplant. The authors hypothesized and demonstrated that rapamycin induces glucocorticoid sensitivity via MCL1 modulation in lymphoid malignancy cells as well.
Stochastic search algorithms
Initial computational methods to tackle the drug combination prediction comprised a category of stochastic search algorithms, named genetic algorithms [84]. In contrast to machine learning methods, stochastic search algorithms do not require positive and negative samples (training data) to tackle an optimization problem. Applying genetic algorithms, Zinner et al. showed feasibility of screening drug combinations of arbitrary size [37]. The authors aimed at discovering the most effective cocktail of drugs from a set of 19 drugs. For the first iteration, 18 randomly formed combinations comprised the first generation of candidate solutions. At each iteration, level of fitness of each candidate combination solution was calculated by experimentally measuring the proportion of cells surviving (after treatment with the combination) relative to the control (no treatment). The pool of candidates for the next generation is formed by the fittest solution in the current generation and its one-mutant combinations, i.e. combinations generated by adding each of the drugs to or subtracting them from the fittest combination. The algorithm converged fairly quickly (in the fourth generation), and the enormous search space of all permutations/combinations of the initial 19 drugs (2^19) was explored efficiently through only 72 experimental assay evaluations. Similarly, Wong et al. applied genetic algorithms to the combination problem, but along with an alternative fitness function [79]. The authors explored a space of 1 million dose permutations of six drugs at 10 different doses rather than the space of all combinations of the six drugs. One major advantage of these methods is applicability to drug combinations of arbitrary size. However, it is likely that these search algorithms converge to a local optima rather than a global optima, as the entire landscape is not fully explored.
Machine learning methods
Using machine learning approaches, one can generate predictive models by learning associations between input data (drug–drug, drug–target and target–target) and drug combination inhibitory effect that can be ‘labeled’, ‘unlabeled’ or a mixture of both. The type of labels determines whether a ‘supervised’, ‘unsupervised’ or ‘semi-supervised’ learning framework is suitable. Performance of machine learning approaches for drug combination problem has suffered from lack of sufficient experimental drug combination data. However, these data are gradually becoming more abundant and available [31, 44, 45]. This will open up new horizons for application of machine learning methods. Furthermore, machine learning methods facilitate complex integrations of various data types. Computational drug combination studies have shown that systems-based approaches and integration of multiple data types such as pharmacological and omic play key roles in successful prediction [38, 42]. Therefore, machine learning methods provide an important category of the computational methods for the drug combination problem.
Supervised methods
Supervised machine learning methods aim at learning patterns from a set of labeled examples (training data) to predict unknown labels of arbitrary cases. In other words, the method learns a function that describes association between input measures and the labels [85]. Currently, lack of labeled drug combination data, that is, known effective/ineffective or antagonistic/additive/synergistic drug combinations, is a major obstacle in application of supervised machine learning methods. However, a few studies have focused on using supervised learning methods to predict the label, class or quality of drug combinations [38, 43].
For the first time, Zhao et al. aimed to devise a predictive model that could provide insight into drug combinations’ underlying mechanisms of action based on a set of 184 already approved pairwise combinations of 238 drugs [43]. The authors, first, determined the enriched patterns in several pharmacological and molecular properties of the approved combinations. The enrichment of a pattern was determined and scored according to frequency of that pattern’s occurrences in the effective combinations. Then, based on the enriched patterns, Zhao et al. designed a set of predictive features to predict novel combinations. The set of features contained target proteins and corresponding downstream pathways, medical indication areas, therapeutic effects as represented in the Anatomical Therapeutic Chemical (ATC) Classification System and side effects. Applying F-measure maximization, Zhao et al. predicted a set of effective combinations, 60% of which have been indicated as synergistic combinations in the literature [43].
Li et al. applied a Bayesian network approach to integrate chemical and pharmacological features of drugs from a set of known effective drug combinations (EDCs) [38]. First, two lists of drugs, i.e. EDCs and undesirable drug–drug interactions (UDDIs), are compiled from the known drugs pairs. UDDIs refer to drug pairs that can cause an adverse effect, such as an increase in toxicity or a decrease of effect. The authors collected 656 EDCs spanning 375 drugs and 1536 UDDIs involving 313 drugs for which six drug–drug similarity measures (three drug-based and three target-based) could be computed. Hence, for each arbitrary drug pair, the six similarity features can be computed to describe similarity to a known drug pair. The six similarity features are combined via a Bayesian network to compute a probabilistic measure for similarity to every known drug pair. Then, all probabilistic similarity scores to the known drugs are summed up over each set (EDC and UDDI). Therefore, for each drug pair, two similarity scores to EDC and UDDI categories can be assigned, and the scores can be used to determine the category that the new drug pair belong. Using the EDC set as the gold standard, the method performed predictions with high specificity and sensitivity [an area under the receiver operating characteristic curve (AUC) of 0.90].
Unsupervised methods
In contrast to the supervised methods, for the unsupervised methods, the drug combination labels are not available, and the goal mainly is to describe how the data are organized and what is the hidden structure of the given data [85]. Applying an unsupervised method, Huang et al. combined drugs that target multiple disease-specific signaling pathways [41]. First, the authors constructed a drug–drug interaction network based on perturbation profiles, obtained from CMap. Then, they identified communities within the drug network using Bayesian non-negative matrix factorization approach. A network-based recommendation approach was applied on the drug communities to predict unknown drug targets according to the known ones. On the other hand, a disease-specific signaling network was constructed by integrating genomic and interactome data. Using the disease network and the predicted targets, Huang et al. determined drugs whose targets were enriched in complementary modules of the disease signaling network. Those drugs were assumed to be synergistic by the authors.
Parkkinen and Samuel’s unsupervised method was a novel probabilistic CMap [40] that basically extends the original CMap’s methodology [80]. The main idea of the probabilistic model is to extract and differentiate between cell-specific and shared information among the cell lines, in contrast to other methods that aggregate information over all the cell lines. The authors viewed the pattern matching of drug perturbation profiles from multiple cell lines as a multi-source information retrieval task. They defined a new relevance measure for retrieving drugs with the most relevant profiles to a single query signature. The new measure was devised based on group factor analysis (GFA) and probabilistic latent factor models. The probabilistic CMap method compares favorably with the original CMap in retrieving functionally and chemically similar drugs. Furthermore, the authors showed application of the new method in drug combination by retrieving multiple similar drugs that match different parts of a given query signature.
Semi-supervised methods
One major issue in the drug combination field is data imbalance, i.e. lack of sufficient number of positive/negative samples (i.e. effective/ineffective combinations) and prevalence of unlabeled data. Sun et al. overcame this issue by applying a semi-supervised method, named Ranking-system of Anti-Cancer Synergy (RACS) [42], based on a manifold ranking method proposed by Zhou et al. [86]. Sun et al. compiled a set of 14 features describing pharmacological and genomic aspects of drugs and their targets. The data used for this study comprised 26 effective combinations spanning >33 individual drugs. By reshuffling the 33 drugs, the authors obtained a set of 502 pairs of unlabeled samples. Seven features of 14 were identified as significantly predictive features. The authors then applied a two-step method to rank drug pairs and refine them as follows. First, the manifold ranking-based method obtained a preliminary ranking system for the drug pairs based on similarities to the positive samples. Next, the ranking was further refined by filtering out drug pairs with insignificant coverage of specific cancer pathways and insignificant overlap between their transcriptomic profiles retrieved from CMap. The authors validated their method by data provided for the 2014 drug combination DREAM challenge data, and achieved the highest prediction score with an AUC value of 0.85. RACS outperformed DIGRE, the best-performing method of the challenge, and other well-known computational methods proposed for the combination problem.
Assessment strategies
Drug combination screening is an elaborate and costly procedure. Considering six doses for each drug in a pairwise combination, 36 measurements are required while 6 measurements are enough for monotherapy response of each drug separately. Because of this issue, only a few drug combination data set have been generated so far. Hence, computational predictions that primarily rely on small data sets are hard to be validated computationally and experimentally. Previously tested combinations may be used to assess correctness of the predictions, as in supervised machine learning methods [41]. Alternatively, one may predict synergy measures or categorize the combinations using the available biological knowledge of the target cell lines [38, 42]. However, two large pan-cancer drug combination data sets have been recently released [44, 45], which may help the scientists validate their approaches based on a richer data source containing multiple tissue types and check the robustness of their predictions.
Various correlations and accuracy measures have been introduced in mathematical and statistical literature to test the performance of predictive models using the available data sets. Application of these accuracy measures depends on the strategy of interest for assessment of the computational pipelines. For the classification strategy, contingency table [87] and its corresponding measures such as Cramer’s V and phi coefficients could be used as potential methods to check the accuracy of the predictive drug combination methods (Figure 4). For the score estimation strategy, a common approach consists in ranking the drug combinations and measuring the correlation of the predicted rankings versus the gold standard using Spearman correlation, concordance index (as the generalization of AUC) [82, 88] and its modified form, named PC-index [27].
Figure 4.
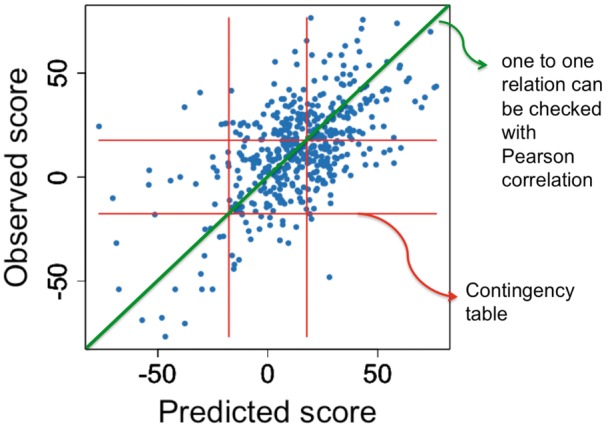
Accuracy measures for different assessment strategies.
Challenges
Lack of consensus definition for drug synergy
There have been community efforts during the past two decades to make a consensus on the quantification of experimental data and definition of synergy [89]. No single quantification method necessarily reflects the whole spectrum of possible drug combination modes of action. Hence, the available methods for synergy estimation are exploratory in nature, which complexifies the development of predictors for potential synergy between drugs. Quantification methods such as Bliss independence and Loewe additivity have been used to quantify the experimental data and validate the predictive methods [27, 37, 29]. However, using other estimators of synergy is likely to result in different quality assessment of predictive methods. In this regard, reaching a consensus on the definition of synergy is one of the biggest challenges that the field is currently facing. Previous attempts have failed to provide a standard definition for drug synergy, including the Saariselkä agreement [90]. However, a recent review from Tang et al. described a simple approach to combine the Bliss independence model and the Loewe additivity model into a ‘interaction barometer’ [89]. This approach not only avoids the hard choice of a single synergy quantification method, but also provides an interpretable scale for drug interactions. More efforts in this direction will make the development of synergy predictors more robust and comparable across studies.
Continuous versus discrete measures of drug combination synergy
Applying a computational approach for predicting combination effect with respect to the reference, one can predict CI as a continuous variable or categorize the combination as synergistic, additive or antagonistic. Although predicting CI as a continuous variable can be complex, it helps in eliminating the issue of thresholding in quantification of observed inhibitory effect of drug combinations. For instance, assume two combinations with CI values 0.98 and 1.05, solely relying on the definition of synergism (CI = 1), one cannot determine whether the aforementioned combinations are synergistic and antagonistic, respectively. A CI value close to 1, with due attention to the ranges of CI for synergism and antagonism (synergism: 0 < CI < 1; antagonism: CI > 1), makes the comparison difficult and challenging.
Instead of summarizing the drug combination inhibitory effects in a continuous variable or categorizing it as being synergistic/additive/antagonistic, considering the inhibitory effect of drug combination at each combination dose may be more relevant to drug development and clinical setting. A recent extension of the ‘PharmacoGx’ package (Table 1) includes the four main quantification methods described in the ‘Quantification of experimental drug combination’ section, such a unified implementation of methods will help the cancer community compare the quantified combination effects at each combination dose and check the consistency of the existing quantification approaches.
Inconsistency of pharmacological profiling
Experimental protocols used to generate pharmacological profiles of single agents or drug combinations are complex and potentially noisy. Therefore, the procedure can generate potentially inconsistent measures of drug sensitivities and synergism [91–95]. Such inconsistencies affect the performance of models for drug combination prediction. Therefore, it is of the utmost importance to control the technical and biological variability of the pharmacological assay carefully and to standardize experimental protocols to substantially increase the quality of drug sensitivity data. Furthermore, combination of multiple independent data sets holds the potential to develop more accurate predictive models, and constitutes an essential step toward more EDC discovery.
Data sparsity
Many initiatives have been undertaken to generate large data sets of (i) targets, such as the molecular profiles of cancer cell lines; (ii) drugs, such as ChEMBL databases [88]; and (iii) cell lines’ pharmacological response. However, the data are still highly sparse, not all drug combinations within a data set have been tested and the screening is usually focused on one cancer type. Differences in molecular profiles of the cancer cell lines between tumor types and their signaling pathway activity are among the important factors that make existence of cancer-specific data types essential for further predictions on the same cancer. Recently, two pan-cancer data sets for drug combination response, containing multiple cancer types, have been released [43, 44]. These new data sets provide a unique opportunity to investigate why drug combinations yield different response in specific cancer types. However, it is important to note that is no or little data regarding drug combinations tested on liquid tumors, such as acute myeloid leukemia.
Generalizability of computational approaches
One concern with the current computational approaches lies in their lack of generalizability to combination of new drugs and other cancer cell lines. Interactions between drugs are already complex in in vitro models and hard to capture by the existing computational methods. Hence, generalizability of these methods to in vivo models and patients will be challenging. To be applicable to in vivo setting, other data types such as pharmacokinetic parameters may need to be considered in the existing predictive computational approaches. Intra-tumor heterogeneity observed in many cancer types also complexifies the translation of in vitro prediction to in vivo settings as tumor subclones are likely to yield different levels of sensitivity to specific drugs, in both mono- and combination therapeutic strategies. In this regard, new single-cell RNA-Seq data [96] may be helpful to investigate the response of the tumor subclones to drugs [97].
Performance assessment of predictive models
Assessing generalizability of the predictive computational pipelines of drug combination in cancer is challenging owing to the lack of rigorous experimental validation. Most of the methods’ predictions have been validated by weak evidence of synergistic combinations in the literature. Although the first drug combination DREAM challenge [27] was a breakthrough in this regard, only 91 drug combinations in one B cell lymphoma were provided. Nevertheless, the recent large pan-cancer drug combination data sets [44, 45] will be crucial for the community to assess the robustness and generalizability of the developed predictive approaches.
Future directions
Most of the developed predictive methods for drug combination efficacy rely on a subset of molecular profiles of cancer cell lines such as transcriptomic profiles [27, 42]. However, integration of other data types, such as mutation and copy number variation (as suggested by Astrazeneca-Sanger DREAM Challenge), may improve the performance of the methods [27]. Moreover, the ultimate goal in cancer community is to provide more effective therapeutics for cancer patients. With due attention to the differences between model systems and patient tumors, the models that are relying on the data types only available for cell lines, such as connectivity-mapping-based methods, would have less potential in clinical practice.
New data types
High-throughput molecular profiles (also called ‘omics’) hold the potential to elucidate the complex functionality of healthy and diseased cells. Among these molecular data, transcriptomic profiles [27, 40–42], interaction networks at the genomic and proteomic levels [38, 39] as well as biological pathways [27, 43] have already been used to predict the efficacy of drug combinations. However, other informative molecular data can be leveraged to predict the effect of combination therapies on the target cells. Mutation, copy number variation and methylation data are new data types, which have been provided by Astrazeneca-Sanger DREAM Challenge for use in the drug combination prediction pipelines developed by the participants (https://www.synapse.org/#!Synapse:syn4231880/wiki/235651). Although challenging, one can integrate these multiple data types to predict the efficacy of combinatorial cancer treatments and ultimately matching the drug combinations to the patients with the desirable effect. For instance, functions of the target proteins may differ between their wild-type and mutated type. Hence, targeting mutated proteins may cause synergy, while targeting their wild-type does not or vice versa. Although expression of genes can be determined using RNA-Seq or microarray technologies [98], copy number variation and methylation of the gene promoters provide complementary data regarding the expression of a gene. These data can be helpful in determining the activity and regulation of the target genes. For example, investigating methylation data are essential to study the effects of epigenetic drugs in a monotherapy or combination therapy strategy [99].
Translation to clinic
Translating computational predictions into clinical practice can be conceptualized with multiple stages, i.e. testing the drug combination predictions in in vitro and in vivo (both in genetically engineered mouse models and patient-derived xenografts) settings. Afterward, moving to the stage of clinical trials and testing the drugs, which have been passed the preclinical trials, on cancer patients. Despite the successful validation of drugs in model systems, most of them fail to reach the approval of the FDA for the clinical use [100]. The bottlenecks associated with the computational approach can be considered as 2-fold. First, the molecular profiles such as the transcriptional profiles, obtained based on in vitro assays, that would be used in predictive computational approaches are distinct from the profiles of patients. To make the predictions more applicable in clinics, there is a need to figure out the similarities between in vitro and patient data in a personalized setting. Second, the methodologies that are relying on sparser data types, such as CMap-based models for which the data are only available for few cells lines in restricted tissue types, makes the models less extensible and practical in clinical settings. Conclusively, computational predictive models that rely on data types with more similarity between in vitro setting and patients as well as less dependent on the data types not available in a personalized clinical setting would increase the applicability of the models in clinical practice.
Although the preclinical studies and predictive computational approaches focus on developing and predicting synergistic drug combinations, respectively, there are other concerns in clinical settings such as reducing acquired resistance to a monotherapy agent, or decrease its adverse effect [22]. Unfortunately, the preclinical studies and the predictive approaches have not yet addressed these important issues.
Conclusions
Finding EDCs for different cancer types, overcoming the limitations of monotherapy, is an elaborate and costly process. In this review, we presented the current state of the art of computational drug combination development. Although there has been a remarkable progress in the performance of predictive approaches, there are still many challenges mainly owing to lack of experimental drug combination data. Nevertheless, the recent pan-cancer drug combination data sets will be crucial sources for improving and extending existing methods, as well as developing new approaches in the near future.
Key Points
We synthesize the different aspects of the available computational and mathematical models used in drug combination development.
Various data types, including genomic, proteomic, chemical structure and pharmacological, are publicly available for developing predictive drug combination approaches.
Recent pan-cancer drug combination data sets will be crucial for developing the next generation of predictive drug combination methods.
Supplementary Data
Supplementary Material
Acknowledgement
We thank Dr Aaron Schimmer for his clinical expertise in drug repurposing and combination therapies.
Funding
Connaught International Scholarships for Doctoral Students (to S.A.M.T.); Canadian Cancer Society Research Institute (grant #703886 to L.S.G.); US National Institutes of Health (subaward #236136 to V.S.K.M.); Gattuso Slaight Personalized Cancer Medicine Fund at Princess Margaret Cancer Centre, the Canadian Institutes of Health Research, the Natural Sciences and Engineering Research Council of Canada and the Ministry of Economic Development and Innovation/Ministry of Research & Innovation of Ontario (Canada) (to B.H.-K.).
Seyed Ali Madani Tonekaboni is a PhD student in the Medical Biophysics Department of the University of Toronto. His main research focuses on developing a new framework for estimating proper drug combinations as a more efficient and less toxic chemotherapy.
Laleh Soltan Ghoraie is a postdoctoral fellow in Dr Haibe-Kains’ lab at Princess Margaret Cancer Center. She received her PhD in Computer Science from University of Waterloo, Canada. She is interested in applications of Machine Learning in Bioinformatics, focusing on computational drug repurposing.
Venkata Satya Kumar Manem is a postdoctoral fellow in Dr Haibe-Kains’ lab. His research interests are in mathematical oncology, evolutionary dynamics, quantitative modeling of tumor signaling networks using -omics data and identification of drugs that inhibit these signals.
Benjamin Haibe-Kains, trained as a computer scientist, leads the Bioinformatics and Computational Genomics laboratory at the Princess Margaret Cancer Centre, focusing on the development of machine learning methods for prognosis and drug response prediction in cancer from high-throughput molecular profiling data.
References
- 1. Zimmermann GR, Lehár J, Keith CT.. Multi-target therapeutics: when the whole is greater than the sum of the parts. Drug Discov Today 2007;12:34–42. [DOI] [PubMed] [Google Scholar]
- 2. Bozic I, Reiter JG, Allen B, et al. Evolutionary dynamics of cancer in response to targeted combination therapy. Elife 2013;2: e00747.. [DOI] [PMC free article] [PubMed] [Google Scholar]
- 3. Yadav B, Bhagwan Y, Krister W, et al. Searching for drug synergy in complex dose–response landscapes using an interaction potency model. Comput Struct Biotechnol J 2015;13: 504–13. [DOI] [PMC free article] [PubMed] [Google Scholar]
- 4. Gottesman MM. Mechanisms of cancer drug resistance. Annu Rev Med 2002;53:615–27. [DOI] [PubMed] [Google Scholar]
- 5. DeVita VT Jr, Young RC, Canellos GP.. Combination versus single agent chemotherapy: a review of the basis for selection of drug treatment of cancer. Cancer 1975;35:98–110. [DOI] [PubMed] [Google Scholar]
- 6. Hanahan D, Douglas H, Weinberg RA.. Hallmarks of cancer: the next generation. Cell 2011;144:646–74. [DOI] [PubMed] [Google Scholar]
- 7. Gadzicki D, Dorothea G, von Neuhoff N, et al. BCR-ABL gene amplification and overexpression in a patient with chronic myeloid leukemia treated with imatinib. Cancer Genet Cytogenet 2005;159:164–7. [DOI] [PubMed] [Google Scholar]
- 8. Lim SH, Lee JY, Sun J-M, et al. Comparison of clinical outcomes following gefitinib and erlotinib treatment in non-small-cell lung cancer patients harboring an epidermal growth factor receptor mutation in either exon 19 or 21. J Thorac Oncol 2014;9:506–11. [DOI] [PubMed] [Google Scholar]
- 9. Fisher R, Larkin J.. Vemurafenib: a new treatment for BRAF-V600 mutated advanced melanoma. Cancer Manag Res 2012;4: 243–52. [DOI] [PMC free article] [PubMed] [Google Scholar]
- 10. Sun X-X, Yu Q.. Intra-tumor heterogeneity of cancer cells and its implications for cancer treatment. Acta Pharmacol Sin 2015;36:1219–27. [DOI] [PMC free article] [PubMed] [Google Scholar]
- 11. Holohan C, Van Schaeybroeck S, Longley DB, et al. Cancer drug resistance: an evolving paradigm. Nat Rev Cancer 2013;13:714–26. [DOI] [PubMed] [Google Scholar]
- 12. Hochhaus A, Kreil S, Corbin AS, et al. Molecular and chromosomal mechanisms of resistance to imatinib (STI571) therapy. Leukemia 2002;16:2190–6. [DOI] [PubMed] [Google Scholar]
- 13. Apperley JF. Part I: mechanisms of resistance to imatinib in chronic myeloid leukaemia. Lancet Oncol 2007;8:1018–29. [DOI] [PubMed] [Google Scholar]
- 14. Engelman JA, Zejnullahu K, Mitsudomi T, et al. MET amplification leads to gefitinib resistance in lung cancer by activating ERBB3 signaling. Science 2007;316:1039–43. [DOI] [PubMed] [Google Scholar]
- 15. Chaft JE, Oxnard GR, Sima CS, et al. Disease flare after tyrosine kinase inhibitor discontinuation in patients with EGFR-mutant lung cancer and acquired resistance to erlotinib or gefitinib: implications for clinical trial design. Clin Cancer Res 2011;17:6298–303. [DOI] [PMC free article] [PubMed] [Google Scholar]
- 16. Pao W, William P, Wang TY, et al. KRAS mutations and primary resistance of lung adenocarcinomas to Gefitinib or Erlotinib. PLoS Med 2005;2:e17.. [DOI] [PMC free article] [PubMed] [Google Scholar]
- 17. Bardelli A, Siena S.. Molecular mechanisms of resistance to Cetuximab and Panitumumab in Colorectal cancer. J Clin Oncol 2010;28:1254–61. [DOI] [PubMed] [Google Scholar]
- 18. Diaz LA Jr, Williams RT, Wu J, et al. The molecular evolution of acquired resistance to targeted EGFR blockade in colorectal cancers. Nature 2012;486:537–40. [DOI] [PMC free article] [PubMed] [Google Scholar]
- 19. Kummar S, Chen HX, Wright J, et al. Utilizing targeted cancer therapeutic agents in combination: novel approaches and urgent requirements. Nat Rev Drug Discov 2010;9:843–56. [DOI] [PubMed] [Google Scholar]
- 20. Keith CT, Borisy AA, Stockwell BR.. Multicomponent therapeutics for networked systems. Nat Rev Drug Discov 2005; 4:71–8. [DOI] [PubMed] [Google Scholar]
- 21. Flaherty KT, Infante JR, Daud A, et al. Combined BRAF and MEK inhibition in melanoma with BRAF V600 mutations. N Engl J Med 2012;367:1694–703. [DOI] [PMC free article] [PubMed] [Google Scholar]
- 22. Eroglu Z, Ribas A.. Combination therapy with BRAF and MEK inhibitors for melanoma: latest evidence and place in therapy. Ther Adv Med Oncol 2016;8:48–56. [DOI] [PMC free article] [PubMed] [Google Scholar]
- 23. Foucquier J, Guedj M.. Analysis of drug combinations: current methodological landscape. Pharmacol Res Perspect 2015;3: e00149.. [DOI] [PMC free article] [PubMed] [Google Scholar]
- 24. Mathews Griner LA, Rajarshi G, Paul S, et al. High-throughput combinatorial screening identifies drugs that cooperate with ibrutinib to kill activated B-cell–like diffuse large B-cell lymphoma cells. Proc Natl Acad Sci USA 2014;111: 2349–54. [DOI] [PMC free article] [PubMed] [Google Scholar]
- 25. Fidock DA, Rosenthal PJ, Croft SL, et al. Antimalarial drug discovery: efficacy models for compound screening. Nat Rev Drug Discov 2004;3:509–20. [DOI] [PubMed] [Google Scholar]
- 26. Demidem A, Aicha D, Tammy L, et al. Chimeric Anti-CD20 (IDEC-C2B8) monoclonal antibody sensitizes a B Cell Lymphoma cell line to cell killing by Cytotoxic Drugs. Cancer Biother Radiopharm 1997;12:177–86. [DOI] [PubMed] [Google Scholar]
- 27. Bansal M, Yang J, Karan C, et al. A community computational challenge to predict the activity of pairs of compounds. Nat Biotechnol 2014;32:1213–22. [DOI] [PMC free article] [PubMed] [Google Scholar]
- 28. Gillet J-P, Varma S, et al. The clinical relevance of cancer cell lines. J Natl Cancer Inst 2013;105:452–8. [DOI] [PMC free article] [PubMed] [Google Scholar]
- 29. Scott CL, Becker MA, Haluska P, et al. Patient-derived xenograft models to improve targeted therapy in epithelial ovarian cancer treatment. Front Oncol 2013;3:295. [DOI] [PMC free article] [PubMed] [Google Scholar]
- 30. Hidalgo M, Amant F, Biankin AV, et al. Patient-derived xenograft models: an emerging platform for translational cancer research. Cancer Discov 2014;4:998–1013. [DOI] [PMC free article] [PubMed] [Google Scholar]
- 31. Gao H, Korn JM, Ferretti S, et al. High-throughput screening using patient-derived tumor xenografts to predict clinical trial drug response. Nat Med 2015;21:1318–25. [DOI] [PubMed] [Google Scholar]
- 32. Choi SYC, Lin D, Gout PW, et al. Lessons from patient-derived xenografts for better in vitro modeling of human cancer. Adv Drug Deliv Rev 2014;79–80:222–37. [DOI] [PubMed] [Google Scholar]
- 33. Seashore-Ludlow B, Rees MG, Cheah JH, et al. Harnessing connectivity in a large-scale small-molecule sensitivity dataset. Cancer Discov 2015;5:1210–23. [DOI] [PMC free article] [PubMed] [Google Scholar]
- 34. Garnett MJ, Edelman EJ, Heidorn SJ, et al. Systematic identification of genomic markers of drug sensitivity in cancer cells. Nature 2012;483:570–5. [DOI] [PMC free article] [PubMed] [Google Scholar]
- 35. Barretina J, Caponigro G, Stransky N, et al. The cancer cell line encyclopedia enables predictive modelling of anticancer drug sensitivity. Nature 2012;483:603–7. [DOI] [PMC free article] [PubMed] [Google Scholar]
- 36. Fang H-B, Chen X, Pei X-Y, et al. Experimental design and statistical analysis for three-drug combination studies. Stat Methods Med Res 2015, doi: 10.1177/0962280215574320. [DOI] [PubMed] [Google Scholar]
- 37. Zinner RG, Barrett BL, Popova E, et al. Algorithmic guided screening of drug combinations of arbitrary size for activity against cancer cells. Mol Cancer Ther 2009;8:521–32. [DOI] [PubMed] [Google Scholar]
- 38. Li P, Huang C, Fu Y, et al. Large-scale exploration and analysis of drug combinations. Bioinformatics 2015;31:2007–16. [DOI] [PubMed] [Google Scholar]
- 39. Lee J-H, Kim DG, Bae TJ, et al. CDA: combinatorial drug discovery using transcriptional response modules. PLoS One 2012;7: e42573.. [DOI] [PMC free article] [PubMed] [Google Scholar]
- 40. Parkkinen JA, Kaski S.. Probabilistic drug connectivity mapping. BMC Bioinformatics 2014;15:113.. [DOI] [PMC free article] [PubMed] [Google Scholar]
- 41. Huang L, Li F, Sheng J, et al. DrugComboRanker: drug combination discovery based on target network analysis. Bioinformatics 2014;30:i228–36. [DOI] [PMC free article] [PubMed] [Google Scholar]
- 42. Sun Y, Sheng Z, Ma C, et al. Combining genomic and network characteristics for extended capability in predicting synergistic drugs for cancer. Nat Commun 2015;6:8481. [DOI] [PMC free article] [PubMed] [Google Scholar]
- 43. Zhao X-M, Iskar M, Zeller G, et al. Prediction of drug combinations by integrating molecular and pharmacological data. PLoS Comput Biol 2011;7:e1002323.. [DOI] [PMC free article] [PubMed] [Google Scholar]
- 44. DREAM Challenges. F1000Research Channels.
- 45. O’Neil J, Benita Y, Feldman I, et al. An unbiased oncology compound screen to identify novel combination strategies. Mol Cancer Ther 2016;15:1155–62. [DOI] [PubMed] [Google Scholar]
- 46. Tallarida RJ. An overview of drug combination analysis with isobolograms. J Pharmacol Exp Ther 2006;319:1–7. [DOI] [PubMed] [Google Scholar]
- 47. Zhao W, Sachsenmeier K, Zhang L, et al. A new bliss independence model to analyze drug combination data. J Biomol Screen 2014;19:817–21. [DOI] [PubMed] [Google Scholar]
- 48. Chou TC, Talaly P.. A simple generalized equation for the analysis of multiple inhibitions of Michaelis-Menten kinetic systems. J Biol Chem 1977;252:6438–42. [PubMed] [Google Scholar]
- 49. Chou TC. On the determination of availability of ligand binding sites in steady-state systems. J Theor Biol 1977;65:345–56. [DOI] [PubMed] [Google Scholar]
- 50. Chou T-C, Ting-Chao C.. Derivation and properties of Michaelis-Menten type and Hill type equations for reference ligands. J Theor Biol 1976;59:253–76. [DOI] [PubMed] [Google Scholar]
- 51. Chou T. Relationships between inhibition constants and fractional inhibition in enzyme-catalyzed reactions with different numbers of reactants, different reaction mechanisms, and different types and mechanisms of inhibition. Mol Pharmacol 1974;10:235–47. [PubMed] [Google Scholar]
- 52. Loewe S. The problem of synergism and antagonism of combined drugs. Arzneimittelforschung 1953;3:285–90. [PubMed] [Google Scholar]
- 53. Nordling CO. A new theory on the cancer-inducing mechanism. Br J Cancer 1953;7:68–72. [DOI] [PMC free article] [PubMed] [Google Scholar]
- 54. Finney DJ, Probit Analysis. J Am Pharm Assoc, Cambridge University Press 1952;41:627. [Google Scholar]
- 55. Reed LJ, Joseph B.. The application of the logistic function to experimental data. J Phys Chem 1928;33:760–79. [Google Scholar]
- 56. Bliss CI. The toxicity of poisons applied jointly1. Ann Appl Biol 1939;26:585–615. [Google Scholar]
- 57. Loewe S, Muischnek H.. Über Kombinationswirkungen. Archiv Für Experimentelle Pathologie Und Pharmakologie 1926;114: 313–26. [Google Scholar]
- 58. Grindey GB, Moran RG, Werkheiser WC.. Approaches to the rational combination of antimetabolites for cancer chemotherapy. Drug Design 1975;169–249. [Google Scholar]
- 59. Sartorelli AC. Approaches to the combination chemotherapy of transplantable Neoplasms. Prog Tumor Res 1965;228–88. [DOI] [PubMed] [Google Scholar]
- 60. Venditti JM, Abraham G.. Drug synergism in antineoplastic chemotherapy. Adv Chemother 1964;397–498. [DOI] [PubMed] [Google Scholar]
- 61. Burger A, Alfred B.. Drugs in our society. J Med Chem 1964;7:835. [Google Scholar]
- 62. Veldstra H. Synergism and potentiation with special reference to the combination of structural analogues. Pharmacol Rev 1956;8:339–87. [PubMed] [Google Scholar]
- 63. Chou T-C. Drug combination studies and their synergy quantification using the Chou-Talalay method. Cancer Res 2010;70:440–6. [DOI] [PubMed] [Google Scholar]
- 64. Bulusu KC, Guha R, Mason DJ, et al. Modelling of compound combination effects and applications to efficacy and toxicity: state-of-the-art, challenges and perspectives. Drug Discov Today 2016;21:225–38. [DOI] [PubMed] [Google Scholar]
- 65. Ryall KA, Tan AC.. Systems biology approaches for advancing the discovery of effective drug combinations. J Cheminform 2015;7:7. [DOI] [PMC free article] [PubMed] [Google Scholar]
- 66. Lopez JS, Banerji U.. Combine and conquer: challenges for targeted therapy combinations in early phase trials. Nat Rev Clin Oncol 2016, doi: 10.1038/nrclinonc.2016.96. [DOI] [PMC free article] [PubMed] [Google Scholar]
- 67. Chou T-C, Ting-Chao C, Paul T.. Analysis of combined drug effects: a new look at a very old problem. Trends Pharmacol Sci 1983;4:450–4. [Google Scholar]
- 68. Lee JJ, Kong M, Ayers GD, et al. Interaction index and different methods for determining drug interaction in combination therapy. J Biopharm Stat 2007;17:461–80. [DOI] [PubMed] [Google Scholar]
- 69. Ritz C, Christian R, Streibig JC.. Bioassay analysis using R. J Stat Softw 2005;12:1–22. [Google Scholar]
- 70. Dreβler V, Valeska D, Gerhard M, et al. CombiTool—a new computer program for analyzing combination experiments with biologically active agents. Comput Biomed Res 1999;32: 145–60. [DOI] [PubMed] [Google Scholar]
- 71. Smirnov P, Petr S, Zhaleh S, et al. PharmacoGx: an R package for analysis of large pharmacogenomic datasets. Bioinformatics 2015;32:1244–46. [DOI] [PubMed] [Google Scholar]
- 72. Laskey SB, Siliciano RF.. A mechanistic theory to explain the efficacy of antiretroviral therapy. Nat Rev Microbiol 2014; 12:772–80. [DOI] [PubMed] [Google Scholar]
- 73. Hughes JP, Rees S, Kalindjian SB, et al. Principles of early drug discovery. Br J Pharmacol 2011;162:1239–49. [DOI] [PMC free article] [PubMed] [Google Scholar]
- 74. Li P, Chen J, Wang J, et al. Systems pharmacology strategies for drug discovery and combination with applications to cardiovascular diseases. J Ethnopharmacol 2014;151:93–107. [DOI] [PubMed] [Google Scholar]
- 75. Wu Z, Zhao X-M, Chen L.. A systems biology approach to identify effective cocktail drugs. BMC Syst Biol 2010;4(Suppl 2):S7.. [DOI] [PMC free article] [PubMed] [Google Scholar]
- 76. Cunningham D, Chau I, Stocken DD, et al. Phase III randomized comparison of gemcitabine versus gemcitabine plus capecitabine in patients with advanced pancreatic cancer. J Clin Oncol 2009;27:5513–18. [DOI] [PubMed] [Google Scholar]
- 77. Moore MJ, Goldstein D, Hamm J, et al. Erlotinib plus gemcitabine compared with gemcitabine alone in patients with advanced pancreatic cancer: a phase III trial of the National Cancer Institute of Canada Clinical Trials Group. J Clin Oncol 2007;25:1960–6. [DOI] [PubMed] [Google Scholar]
- 78. Marsh RDW, Talamonti MS, Katz MH, et al. Pancreatic cancer and FOLFIRINOX: a new era and new questions. Cancer Med 2015;4:853–63. [DOI] [PMC free article] [PubMed] [Google Scholar]
- 79. Wong PK, Yu F, Shahangian A, et al. Closed-loop control of cellular functions using combinatory drugs guided by a stochastic search algorithm. Proc Natl Acad Sci USA 2008;105: 5105–10. [DOI] [PMC free article] [PubMed] [Google Scholar]
- 80. Lamb J, Crawford ED, Peck D, et al. The connectivity map: using gene-expression signatures to connect small molecules, genes, and disease. Science 2006;313:1929–35. [DOI] [PubMed] [Google Scholar]
- 81. Sirota M, Dudley JT, Kim J, et al. Discovery and preclinical validation of drug indications using compendia of public gene expression data. Sci Transl Med 2011;3:96ra77.. [DOI] [PMC free article] [PubMed] [Google Scholar]
- 82. Harrell FE Jr, Lee KL, Mark DB.. Multivariable prognostic models: issues in developing models, evaluating assumptions and adequacy, and measuring and reducing errors. Stat Med 1996;15:361–87. [DOI] [PubMed] [Google Scholar]
- 83. Wei G, Twomey D, Lamb J, et al. Gene expression-based chemical genomics identifies rapamycin as a modulator of MCL1 and glucocorticoid resistance. Cancer Cell 2006;10:331–42. [DOI] [PubMed] [Google Scholar]
- 84. Forrest S. Genetic algorithms: principles of natural selection applied to computation. Science 1993;261:872–8. [DOI] [PubMed] [Google Scholar]
- 85. Hastie T, Tibshirani R, Friedman J. The Elements of Statistical Learning: Data Mining, Inference, and Prediction. Springer series in statistics Springer, Berlin, 2013.
- 86. Zhou X, Xueyuan Z, Mikhail B, et al. An iterated graph laplacian approach for ranking on manifolds. In: Proceedings of the 17th ACM SIGKDD International Conference on Knowledge Discovery and Data Mining - KDD ’11, 2011.
- 87. Bartlett MS. Contingency table interactions. Suppl J R Stat Soc 1935;2:248–52. [Google Scholar]
- 88. Kang L, Chen W, Petrick NA, et al. Comparing two correlated C indices with right-censored survival outcome: a one-shot nonparametric approach. Stat Med 2015;34:685–703. [DOI] [PMC free article] [PubMed] [Google Scholar]
- 89. Tang J, Jing T, Krister W, et al. What is synergy? The Saariselkä agreement revisited. Front Pharmacol 2015;6:181. [DOI] [PMC free article] [PubMed] [Google Scholar]
- 90. Greco W, Unkelbach HD, Pöch G, et al. Consensus on concepts and terminology for combined-action assessment: the Saariselkä agreement. Arch Complex Environ Stud 1992; 4:65–9. [Google Scholar]
- 91. Safikhani Z, Zhaleh S, Nehme E-H, et al. Assessment of pharmacogenomic agreement. F1000Res 2016. [DOI] [PMC free article] [PubMed]
- 92. Haverty PM, Lin E, Tan J, et al. Reproducible pharmacogenomic profiling of cancer cell line panels. Nature 2016;533: 333–7. [DOI] [PubMed] [Google Scholar]
- 93. Cancer Cell Line Encyclopedia Consortium, Genomics of drug sensitivity in cancer consortium. Pharmacogenomic agreement between two cancer cell line data sets. Nature 2015;528:84–7. [DOI] [PMC free article] [PubMed] [Google Scholar]
- 94. Hatzis C, Bedard PL, Birkbak NJ, et al. Enhancing reproducibility in cancer drug screening: how do we move forward? Cancer Res 2014;74:4016–23. [DOI] [PMC free article] [PubMed] [Google Scholar]
- 95. Haibe-Kains B, El-Hachem N, Birkbak NJ, et al. Inconsistency in large pharmacogenomic studies. Nature 2013;504:389–93. [DOI] [PMC free article] [PubMed] [Google Scholar]
- 96. Hebenstreit D, Daniel H.. Methods, challenges and potentials of single Cell RNA-seq. Biology 2012;1:658–67. [DOI] [PMC free article] [PubMed] [Google Scholar]
- 97. Kim K-T, Lee HW, Lee H-O, et al. Application of single-cell RNA sequencing in optimizing a combinatorial therapeutic strategy in metastatic renal cell carcinoma. Genome Biol 2016;17:80.. [DOI] [PMC free article] [PubMed] [Google Scholar]
- 98. Marguerat S, Samuel M, Jürg B.. RNA-seq: from technology to biology. Cell Mol Life Sci 2009;67:569–79. [DOI] [PMC free article] [PubMed] [Google Scholar]
- 99. Szyf M, Moshe S.. Epigenetics, DNA methylation, and chromatin modifying drugs. Annu Rev Pharmacol Toxicol 2009;49: 243–63. [DOI] [PubMed] [Google Scholar]
- 100. Kola I, Landis J.. Can the pharmaceutical industry reduce attrition rates? Nat Rev Drug Discov 2004;3:711–15. [DOI] [PubMed] [Google Scholar]
Associated Data
This section collects any data citations, data availability statements, or supplementary materials included in this article.