. 2018 Jun 5;7:e37231. doi: 10.7554/eLife.37231

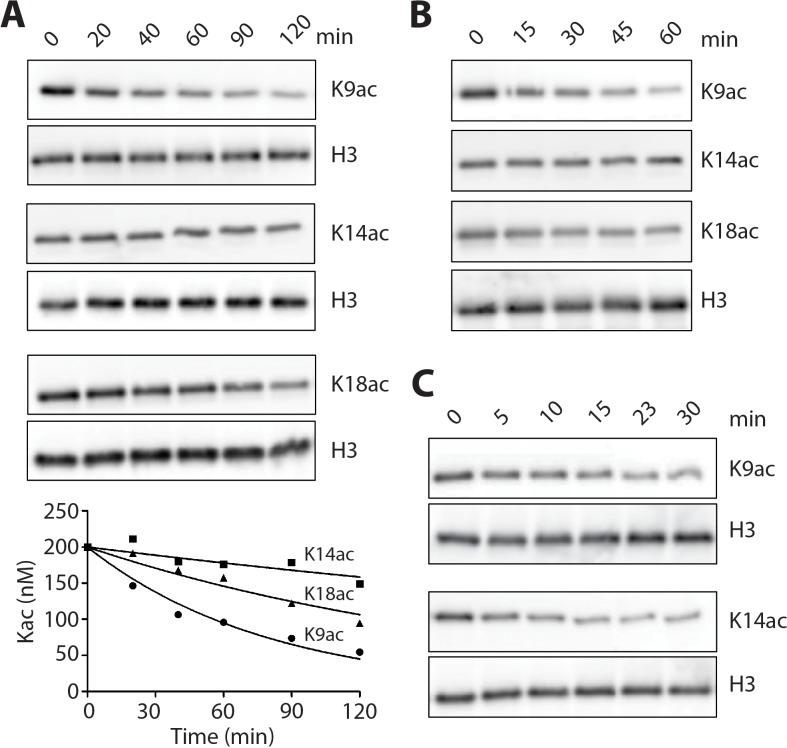
Figure 6. LHC deacetylation of nucleosomes and isolated histone H3 containing Kac.

(A) The deacetylation of 100 nM monoacetylated nucleosomes by 20 nM LHC. The quantified bands of Kac are measured in the plot below. (B) Deacetylation of 200 nM triacetylated H3K9acK14acK18ac nucleosomes by 40 nM LHC. (C) The deacetylation of 1 μM monoacetylated semisynthetic histone H3s possessing either K9ac or K14ac by 1 nM LHC. These assays were performed at three times (n = 3) in A and B and twice (n = 2) in C on separate occasions.

Figure 6.

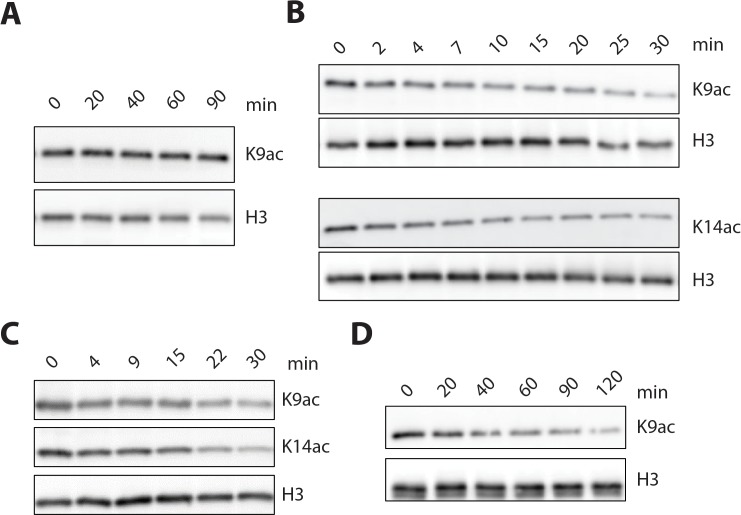
Figure 6—figure supplement 1. LHC and isolated HDAC1 deacetylation of nucleosomes and isolated histone H3 containing Kac.

Figure 6—figure supplement 1.

(A) His-FLAG-HDAC1 (50 nM) showed no detectable deacetylation of H3K9ac nucleosome substrate (100 nM). (B) His-FLAG-HDAC1 (5 nM) showed robust deacetylation of both H3K9ac and H3K14ac histone H3 substrates (1 μM). (C) Deacetylation of the H3K9K14K18 triacetylated histone H3 (1 μM) by 1 nM LHC. (D) Deacetylation of 100 nM H3K9ac nucleosomes (lacking H3K4me2 modification) by 20 nM LHC. Each of these panels shows western blots with the relevant site-specific and total H3 Abs. (n = 3 for all measurements except n = 2 for A and B).
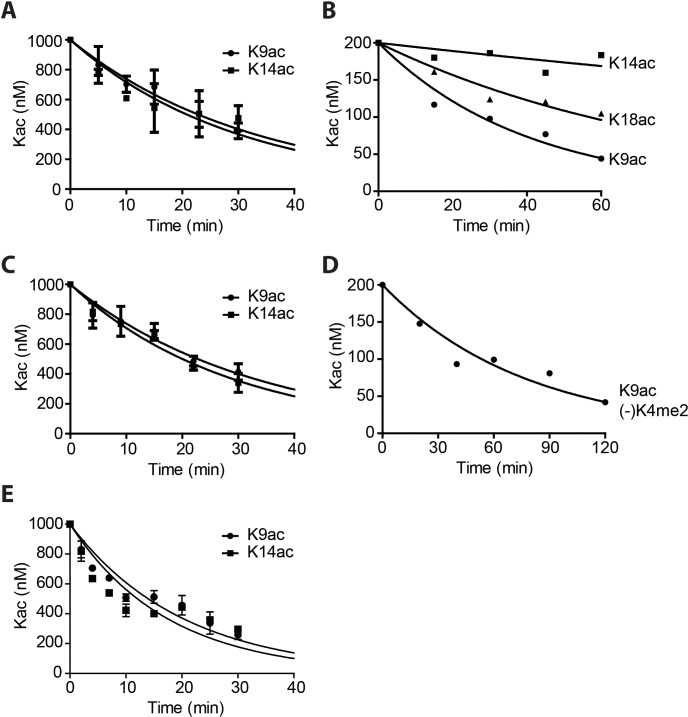
Figure 6—figure supplement 2. Quantification and curve fitting of the deacetylation assays.

Figure 6—figure supplement 2.

(A) Deacetylation of 1 μM Kac histone H3 by 1 nM LHC. (B) Deacetylation of 100 nM H3K9K14K18 triacetylated nucleosomes by 40 nM LHC. (C) Deacetylation of 1 μM H3K9K14K18 triacetylated histone H3 by 1 nM LHC. (D) Deacetylation of 100 nM H3K9ac nucleosomes without H3K4me2 by 20 nM LHC. V/[E]=0.14 ± 0.0045 min−1. (E) The deacetylation of 1 μM Kac histone H3 by 5 nM His-FLAG-HDAC1; (n = 3 for all measurements except n = 2 for A and C); Error bars represent S.E.M.