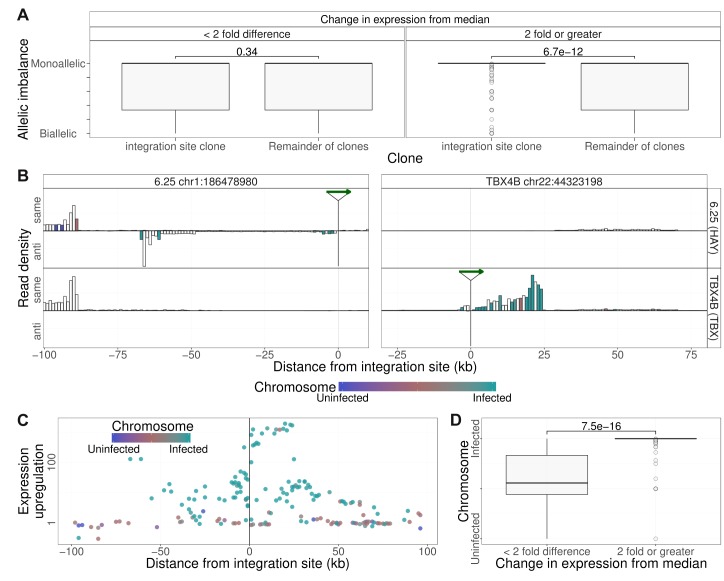
Figure 5. Clone-specific host transcription is derived from the infected chromosome.
(A) Allelic imbalance (AI) denotes the degree of monoallelic usage of identified SNPs: AI = 0 indicates biallelic transcription; AI = 0.5 indicates monoallelic transcription. In each clone, the AI was quantified in transcripts within 2 Mb of the proviral integration sites and compared with the value at that site in all other clones. Clone-specific transcription (transcription density in the clone carrying the provirus, 2-fold or greater than the median; 1 kb bins) was monoallelic; shared transcription was biallelic. While there was no significant difference between the allelic imbalance in those bins for which there was little or no change in transcription from median, for those bins where clone specific expression was observed (two fold or greater increase), the allelic imbalance was significantly greater (more monoallelic) in the integration site clone compared to remainder of clones (p=6.7 * 10−12, Wilcoxon test). (B) Transcription density depicted as in Figure 4A, analysed by haplotype (see Figure 2). Columns are coloured by the mean frequency of infected or uninfected alleles (1 kb bins). White columns did not include SNPs that could be assigned to a single haplotype. (C) Median ratio of transcription density (log scale) in 1 kb bins containing a heterozygous SNP coloured by the frequency of alleles derived from the infected (green) or uninfected (blue) haplotypes. (D) The SNP alleles expressed at ≥2 × median level were over-represented in the infected haplotype.

