Abstract
The three-state model of tropomyosin (Tm) positioning along filamentous actin allows for Tm to act as a gate for myosin head binding with actin. The blocked state of Tm prevents myosin binding, while the open state allows for strong binding. Intermediate to this transition is the closed state. The details of the transition from the blocked to the closed state and then finally to the open state by Tm have not been fully accessible to experiment. Utilizing steered molecular dynamics, we investigate the work required to move the Tm strand through the extant set of proposed transitions. We find that an azimuthal motion around the actin filament by Tm is most probable in spite of increased initial energy barrier from the topographical landscape of actin.
Graphical abstract
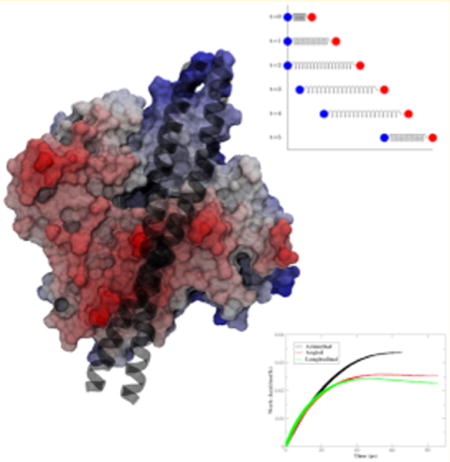
Actin, tropomyosin (Tm), and cardiac troponin (cTn) create the cardiac thin filament (CTF). This protein assembly is a molecular machine that plays a key role in regulating cardiac contraction and relaxation via the motion of Tm on the surface of actin to alternatively reveal and cover myosin binding sites during contraction and relaxation of the heart. The mechanism by which Tm moves across the surface of actin is poorly understood. Here we employ our all-atom model of the CTF1 to investigate this poorly understood mechanism central to the function of this complex machine. Filamentous actin (F-actin) is a coiled-coil dimer of polymerized globular actin subunits that creates the myosin binding sites needed for the powerstroke that results in cardiac contraction.2–4 F-actin also creates a scaffold for the Tm, a chain of repeating coiled-coil dimers including an overlap region consisting of the last 11 amino acids of the C-terminus of one Tm dimer and the first 11 amino acids of the N-terminus of the next Tm dimer.4 Tm wraps around F-actin in a periodic fashion, in which Tm consists of 7 quasirepeats along the length of the coiled-coil dimer and each quasirepeat interacts with the coiled-coil dimer of polymerized globular actin subunits in a similar manner. Tm is stabilized in the blocked position by seven electrostatic interactions. The interactions consist of similar paired interactions between negatively charged carboxyl side chains of aspartic and glutamic acids and positively charged amine side chains of arginine and lysine.
The long held understanding is that there are three distinct equilibrium states that control the contraction of cardiac muscle: blocked, closed, and open.5,6 The third distinct protein complex of the CTF is cTn consisting of a calcium-binding domain (cTnC), an inhibitory domain (cTnI), and a domain interacting with the Tm overlap region (cTnT). In the absence of calcium binding, the C-terminus of cTnI is thought to locate on the actin filament in a fashion to inhibit the Tm chain from transitioning from the blocked state to the closed state. Figure 1 shows a graphical representation of the locations of the Tm in all three states with respect to the actin filament and a myosin head in the strongly bound state. While in the blocked state, Tm blocks the myosin binding sites on actin, therefore preventing the cross-bridge cycle, the central biophysical component of work generation in cardiac (or other) muscle tissue. Once calcium is bound, the C-terminus of cTnI detaches from actin, and Tm can transition to the closed state, the first state in the process of force generation. In the closed state, Tm no longer fully blocks the myosin binding sites on actin and allows the weak binding of the lower 50 kDa region of the myosin head. From here, Tm can further transition to the open position, which allows for strong binding of the myosin head. This occurs when the upper 50 kDa region lowers onto the lower 50 kDa region, thus closing the cleft of the myosin head, and both regions interact with the binding site on actin.7–10 In the past, we have developed a full atomistic CTF model1,11 and imposed disease-causing mutations on the wild-type form. By comparing the wild-type and the mutated models, we develop an understanding of how single-point mutations can alter the function of the complex molecular machinery of the CTF.1,12–16 In this Letter, we face a far more basic problem. While the basic outline for Tm control of actin binding is accepted, the physical nature of this mechanism remains opaque because no currently available experimental technique is able to elucidate the transition mechanism. The work we describe herein begins an exploration of that mechanism.
Figure 1.
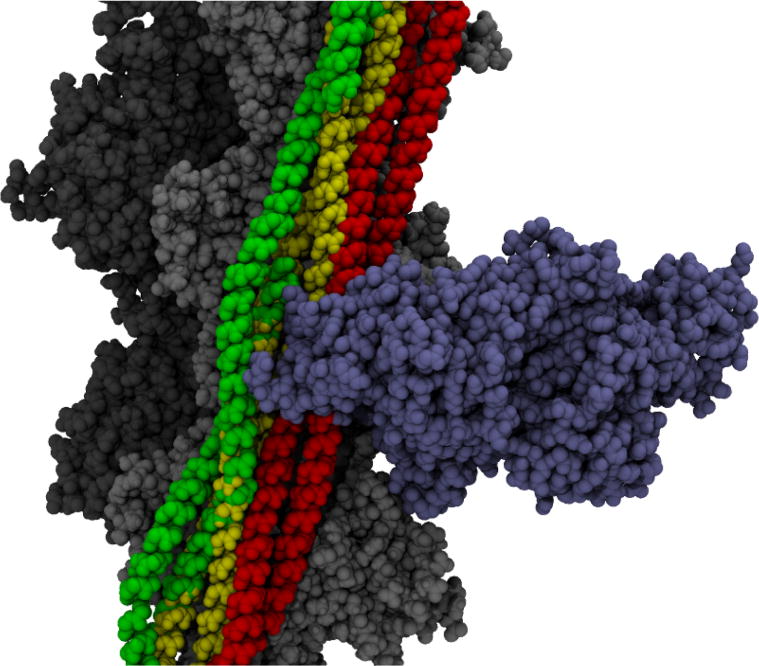
Three-state model of Tm on actin with myosin. The actin filament is shown in light and dark gray. All three states of tropomyosin are shown in red for the blocked state, yellow for the closed state, and green for the open state. A myosin head (blue) is shown in the position at which it is strongly bound. The open state is available; however, both the blocked and closed states are impeded by the myosin head binding.
Utilizing our atomistic CTF model and steered molecular dynamics (SMD), we are able to obtain relative free energies that predict the most likely process involved in the transition of Tm across actin. We emphasize that we do not expect the numerical values of these calculated free energies to be exact, but rather to show relative likelihood of the different paths studied. As stated above, this information is not currently accessible directly to experiment. Each of the seven periods of Tm interact with actin predominantly through seven electrostatic interactions. The total free-energy barrier to transition from the blocked state to the closed state is large and predominantly composed of the energy required to break the electrostatic interactions we have just described. The mechanical or thermodynamic manner in which this barrier is overcome is unknown. However, the manner in which the Tm moves once overcoming the energy barriers is also unknown and a topic of debate. One central question is whether Tm moves via a sliding motion or a rolling motion. The sliding method would require that the Tm chain maintain its rotational orientation with respect to the actin filament. The residues on Tm that interact with actin in the blocked state would potentially drag across F-actin until reaching the closed and then open states.17 The rolling method would in turn require that the Tm chain roll in the direction of travel along F-actin, which would result in the interacting residues changing as the rotation occurs.
The interaction energies required for these rolling transitions have been described,17 and it has been proposed that the sliding method likely produced a lower potential energy barrier and allowed for geometric stability of the ends of the chains. In contradistinction, if the coiled-coil dimer rolled with stationary ends the transition would necessarily cause super coiling of the Tm chain. A second crucial question, and the one answered by the work reported in this Letter, is the detailed manner in which the transition occurs as Tm traverses F-actin. One proposed pathway is a predominately azimuthal transition across actin. The azimuthal transition would entail a movement mostly involving rotation around the F-actin cylindrical axis. Another proposed transition is a longitudinal transition across actin. The longitudinal transition would in turn be a movement parallel to the cylindrical axis of F-actin. There is also suggestion of a combination of the two types of transition that involves an “angular” path resulting in movement both predominately in the longitudinal direction with azimuthal as well.18 Figure 2 shows the three models of Tm transition across actin. Table 1 shows the deviations that each of the transitions make to go from the blocked position to the closed position.
Figure 2.
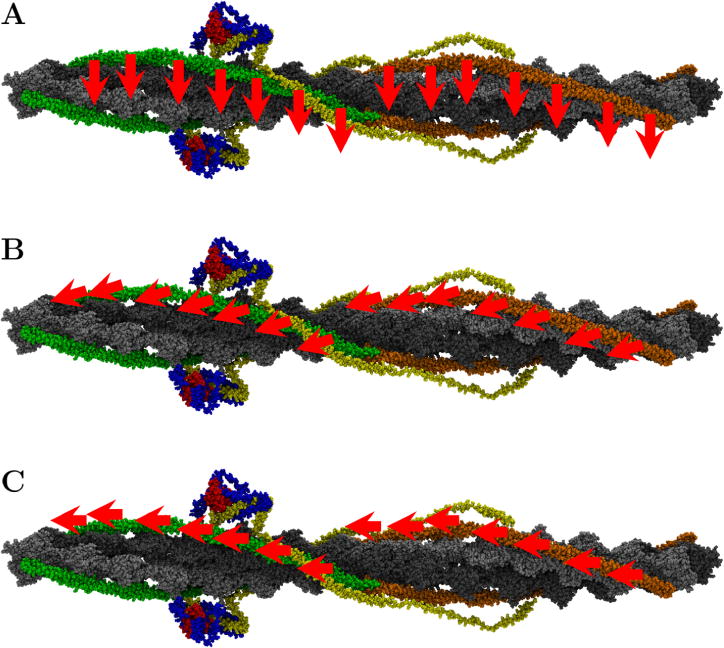
Tm transitions across actin. The red arrows represent the direction that the tropomyosin would be pulled with SMD. (A) The azimuthal transition, (B) the angled transition, and (C) the longitudinal transition with respect to the actin filament.
Table 1.
Average Deviations for the Tm Quasirepeats for the Three SMD Transitionsa
| transition name | azimuthal rotation | longitudinal shift | pseudorotation |
|---|---|---|---|
| azimuthal | 27.75° | 7.87 Å | 0° |
| angled | 2.23° | 35.64 Å | 0° |
| longitudinal | 0° | 37.5 Å | 0° |
The azimuthal rotation is the degree of rotation around the actin filament. The longitudinal shift is the distance traveled along the actin filament. The pseudorotation is the rotation of the Tm coiled-coil dimer with respect to the actin filament.
To calculate the interaction between the actin subunit and the Tm, the electrostatic and van der Waals interaction energy was measured utilizing NAMD 2.1219 with the CHARMM 27 force field.20 The average equilibrium interaction energy at a single quasirepeat was measured to be 432 kcal/mol for the full CTF, which must be overcome before Tm can leave the blocked position on actin.
To understand the most likely manner in which the Tm transitions from the blocked state to the closed state, SMD was employed. (We note these transitions would not be accessible on a standard computational time scale, and so some form of rare event/accelerated MD is needed; we choose SMD.) SMD is a method of MD that includes the addition of a virtual spring that is attached to a virtual atom and the atoms desired to be pulled. When pulling the virtual atom at a constant velocity, the work on the spring can be attributed to the free energy.21,22 Because each of the 28 periodic interactions are similar, the work required for a single quasirepeat site was calculated and then averaged to find the amount of work required to pull the Tm from the blocked position to the closed position. The ensemble consists of 10 different simulations with each containing two separate Tm dimers in which the average work per quasirepeat of the 14 repeats was calculated.
Figure 3 is the ensemble average work per quasirepeat per step with the standard error shown. As shown in Figure 3, the azimuthal transition method showed the largest energy barrier; however, the total is only 1646.6 kcal/mol. While the longitudinal transition showed the lowest energy barrier and the angled transition was intermediate with an energy barrier slightly larger than that of the longitudinal, their total work required for the transition are 1985.1 and 2038.3 kcal/mol, respectively. The similarity of the longitudinal and angled transitions can be attributed to the fact that the path taken for both is similar, but with slightly different end points. The azimuthal traveled the shortest distance, 20.5 Å, to reach the targeted end point. The angled and the longitudinal traveled 35.8 and 37.5 Å, respectively, to reach their targeted end point.
Figure 3.
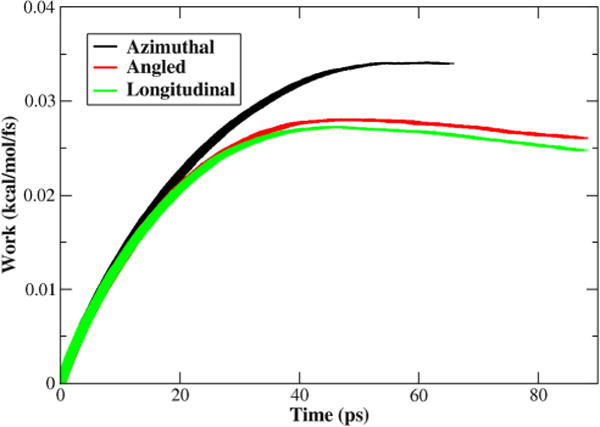
Calculated average work for the Tm transitions per quasirepeat from SMD. The work shown is the work of the virtual spring for each time step, with the width of the curve representative of the standard error. The azimuthal has the highest initial barrier but is the shortest transition. The longitudinal has the lowest barrier, with the angled slightly higher that the longitudinal, but both take longer to reach the target end points than the azimuthal.
When the Tm was pulled from the original equilibrium position in the blocked state, the interactions between the actin and the Tm all have to be overcome. A two-stage SMD simulation was employed to determine if the interactions could be alleviated first, and if, in turn, that would alter the results of the previous single-stage method. Because much of the work is from breaking the Tm–actin interactions, the two-stage simulations impose an initial pull on Tm perpendicular to F-actin. Omitting the first stage, Figure S1 shows the work for the second stage with an initial 25 ps vertical SMD pull. The results for the two-stage SMD simulations with the 10 and 25 ps perpendicular stage are similar to the above SMD results, which is due to not overcoming the initial interactions. The COM moved away from actin only 1.1 Å of potentially 5 Å and 4.4 Å of potentially 12.5 Å, respectively. Preliminary testing showed a 35 ps first stage still did not succeed, but 50 ps would break the interactions. While the perpendicular pull imposes artificial elongation on Tm, fully breaking the interactions results in Tm being too far above actin that the work is just the drag from the solvent. Table S1 shows the integrated total work to be similar to the SMD because of the first stage not altering the initial energy barrier of the interactions.
A third method of SMD was implemented in which the constant velocity of the applied force was decreased from 0.0005 Å/fs to 0.00005 Å/fs. To alleviate strain on the actin that causes deformation at the Tm–actin interactions due to the applied force, harmonic constraints were applied to the backbone atoms of actin. A harmonic constraint of 100 kcal/(mol·Å2) helps to anchor the actin backbone atoms, therefore allowing the Tm to be pulled away from them. Figure 4 is the ensemble average work per quasirepeat with the standard error shown. Figure 4 shows that the results are still similar to that of the previous methods; however, the resulting energy barriers are lower because of the slower velocity and the constraints on actin. The total energy per quasirepeat was 336.7 kcal/mol for azimuthal, 460.0 kcal/mol for angled, and 392.6 kcal/mol for longitudinal. Because of the increased time scale, only three individual simulations were conducted for each transition.
Figure 4.
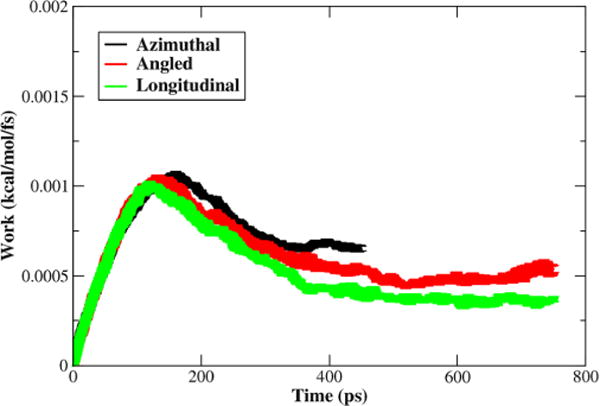
Calculated average work for the Tm transitions per quasirepeat from slower SMD. The work shown is the work of the virtual spring for each time step, with the width of the curve representative of the standard error. The azimuthal has the highest initial barrier but is the shortest transition. The longitudinal has the lowest barrier, with the angled slightly higher that the longitudinal, but both take longer to reach the target end points than the azimuthal.
In this Letter we have studied possible movements of Tm on actin that allow transition from the blocked to the closed state. Our goal was to provide computational evidence either favoring (or not) one type of motion versus another. We found significant free-energy differences between an azimuthal motion and both the longitudinal motion and a motion that combined the two. This may be explained by the topography of the actin subunit and the geometry of Tm binding currently accepted. Tm sits in a “valley” on the actin subunit, and to make the transition azimuthally, the path would go over a “mountain”. In Figure 5, this is shown graphically to the left of the Tm, and surmounting this potential (and free) energy barrier requires greater work initially; however, because of the shorter path required to reach the end point, the total energy is less overall. Because of the extra work involved in traversing longitudinally along F-actin resulting in 33% longer transitions, the azimuthal transition seems to be favored over the longitudinal based transitions. During the SMD simulation which pulled Tm, the cTn stayed stationary; therefore, we did not observe cTn contributing to the energy needed. We again note that there is still no explanation for the energy required to break the interactions to allow motion of any kind. Likely this process may be initiated or promoted by binding of myosin to actin, which mechanically destabilizes these interactions. This could disrupt electrostatic interactions to the extent that longitudinal motion is made possible by a combination of thermal energy and further myosin binding.
Figure 5.
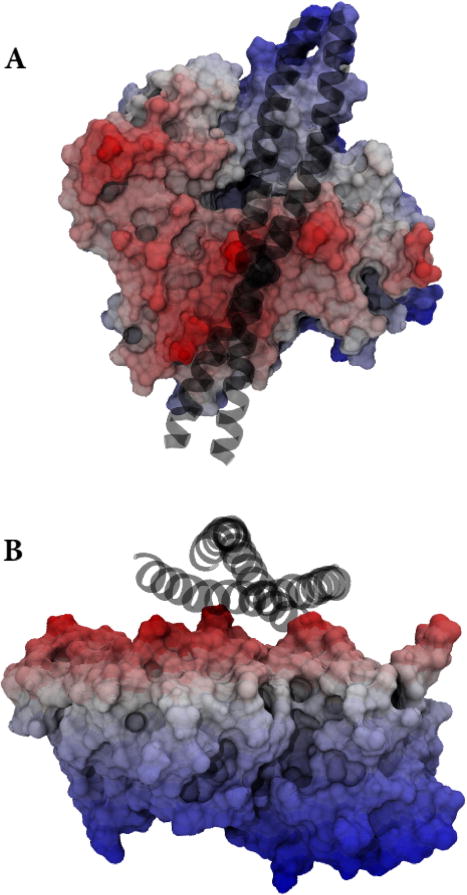
Topography of actin with tropomyosin. (A) The top-down view and (B) side profile view of Tm (the black coils) in the blocked state on a single actin monomer. The red, white, and blue scale is elevation; therefore, the peaks that are creating a channel for Tm are red, and the lower portion is blue. The peaks appear to trap the Tm in a valley. The angled and longitudinal transitions move along the valley, while the azimuthal transition has to move over the left ridge that results in an increased initial energy barrier.
COMPUTATIONAL METHODS
To understand the potential transitions, some experimental basis is needed. In particular, at a minimum we require the starting and end points between which Tm travels. Von der Ecken et al.23,24 found such end points described by PDB entries 3J8A and 5JLH, respectively, in the protein database. Relative to the actin subunit, the Tm backbone atoms’ position is utilized to determine the starting and ending positions. The 3J8A structure contains a five subunit actin filament with Tm in a final (closed) position, in which the transition occurs mostly azimuthally around F-actin, which we reference as azimuthal. The 5JLH structure was produced by a large longitudinal shift along F-actin with some azimuthal rotation, which we reference as angled. Another proposed transition progresses further in a purely longitudinal shift that minimizes Tm’s position in the myosin binding pocket, which we reference as longitudinal. The different transitions allow us to study various routes from the “starting point” to this end point. Using the PDB entries as a template, the structure was aligned using the three middle subunits, to each of the actin subunits of our full atomistic CTF model using VMD 1.92.25 Once the aligned coordinates were saved, a full CTF model with Tm in the closed position could be made.
SMD simulations were conducted using NAMD 2.1219 with the CHARMM 27 force-field parameters20 on the equilibrated structure of the full atomistic CTF model. Three methods of SMD constant velocity pulling were applied. A faster SMD constant velocity of 0.0005 Å/fs was applied to minimize actin disruption without constraints. The two-stage SMD of both 10 and 25 ps was applied at 0.0005 Å/fs, followed by the same settings as above. A slower SMD velocity of 0.00005 Å/fs was applied with harmonic constraints to actin. All SMD methods employed a time step of 1 fs and a virtual spring constant of 7.0 kcal/(mol·Å2). Table S1 contains the parameter used for each SMD method.
More detail about structural setup, simulation parameters, and energy calculations can be found in the Supporting Information.
Supplementary Material
Acknowledgments
We acknowledge the support of the NIH through Grant R01HL107046
Footnotes
Supporting Information The Supporting Information is available free of charge on the ACS Publications website at DOI: 10.1021/acs.jpclett.8b00958.
Detailed computational methods and additional calculated work (PDF)
ORCID
Steven D. Schwartz: 0000-0002-0308-1059
Notes
The authors declare no competing financial interest.
References
- 1.Williams MR, Lehman SJ, Tardiff JC, Schwartz SD. Atomic resolution probe for allostery in the regulatory thin filament. Proc Natl Acad Sci U S A. 2016;113:3257–3262. doi: 10.1073/pnas.1519541113. [DOI] [PMC free article] [PubMed] [Google Scholar]
- 2.Holmes KC. Structural biology: actin in a twist. Nature. 2009;457:389–390. doi: 10.1038/457389a. [DOI] [PubMed] [Google Scholar]
- 3.Holmes KC. 50 years of fiber diffraction. J Struct Biol. 2010;170:184–191. doi: 10.1016/j.jsb.2010.01.004. [DOI] [PubMed] [Google Scholar]
- 4.Li XE, Holmes KC, Lehman W, Jung H, Fischer S. The shape and flexibility of tropomyosin coiled coils: implications for actin filament assembly and regulation. J Mol Biol. 2010;395:327–339. doi: 10.1016/j.jmb.2009.10.060. [DOI] [PubMed] [Google Scholar]
- 5.McKillop DFA, Geeves MA. Regulation of the interaction between actin and myosin subfragment 1: Evidence for three states of the thin filament. Biophys J. 1993;65:693–701. doi: 10.1016/S0006-3495(93)81110-X. [DOI] [PMC free article] [PubMed] [Google Scholar]
- 6.Poole KJV, Lorenz M, Evans G, Rosenbaum G, Pirani A, Craig R, Tobacman LS, Lehman W, Holmes KC. A comparison of muscle thin filament models obtained from electron microscopy reconstructions and low-angle X-ray fiber diagrams from non-overlap muscle. J Struct Biol. 2006;155:273–284. doi: 10.1016/j.jsb.2006.02.020. [DOI] [PubMed] [Google Scholar]
- 7.Rayment I, Holden HM, Whittaker M, Yohn CB, Lorenz M, Holmes KC, Milligan RA. Structure of the actin-myosin comples and its implications for muscle contraction. Science. 1993;261:58–65. doi: 10.1126/science.8316858. [DOI] [PubMed] [Google Scholar]
- 8.Huxley HE. Fifty years of muscle and the sliding filament hypothesis. Eur J Biochem. 2004;271:1403. doi: 10.1111/j.1432-1033.2004.04044.x. [DOI] [PubMed] [Google Scholar]
- 9.Fischer S, Windshugel B, Horak D, Holmes KC, Smith JC. Structural mechanism of the recovery stroke in the Myosin molecular motor. Proc Natl Acad Sci U S A. 2005;102:6873–6878. doi: 10.1073/pnas.0408784102. [DOI] [PMC free article] [PubMed] [Google Scholar]
- 10.Lorenz M, Holmes KC. The actin-myosin interface. Proc Natl Acad Sci U S A. 2010;107:12529–12534. doi: 10.1073/pnas.1003604107. [DOI] [PMC free article] [PubMed] [Google Scholar]
- 11.Manning EP, Tardiff JC, Schwartz SD. A model of calcium activation of the cardiac thin filament. Biochemistry. 2011;50:7405–7413. doi: 10.1021/bi200506k. [DOI] [PMC free article] [PubMed] [Google Scholar]
- 12.Ertz-Berger BR, He H, Dowell C, Factor SM, Haim TE, Nunez S, Schwartz SD, Ingwall JS, Tardiff JC. Changes in the chemical and dynamic properties of cardiac troponin T cause discrete cardiomyopathies in transgenic mice. Proc Natl Acad Sci U S A. 2005;102:18219–18224. doi: 10.1073/pnas.0509181102. [DOI] [PMC free article] [PubMed] [Google Scholar]
- 13.Guinto PJ, Manning EP, Schwartz SD, Tardiff JC. Computational Characterization of Mutations in Cardiac Troponin T Known To Cause Familial Hypertrophic Cardiomyopathy. J Theor Comput Chem. 2007;06:413–419. doi: 10.1142/S0219633607003271. [DOI] [PMC free article] [PubMed] [Google Scholar]
- 14.Manning EP, Tardiff JC, Schwartz SD. Molecular effects of familial hypertrophic cardiomyopathy-related mutations in the TNT1 domain of cTnT. J Mol Biol. 2012;421:54–66. doi: 10.1016/j.jmb.2012.05.008. [DOI] [PMC free article] [PubMed] [Google Scholar]
- 15.Manning EP, Guinto PJ, Tardiff JC. Correlation of molecular and functional effects of mutations in cardiac troponin T linked to familial hypertrophic cardiomyopathy: An integrative in silico/in vitro approach. J Biol Chem. 2012;287:14515–14523. doi: 10.1074/jbc.M111.257436. [DOI] [PMC free article] [PubMed] [Google Scholar]
- 16.McConnell M, Tal Grinspan L, Williams MR, Lynn ML, Schwartz BA, Fass OZ, Schwartz SD, Tardiff JC. Clinically Divergent Mutation Effects on the Structure and Function of the Human Cardiac Tropomyosin Overlap. Biochemistry. 2017;56:3403. doi: 10.1021/acs.biochem.7b00266. [DOI] [PMC free article] [PubMed] [Google Scholar]
- 17.Rynkiewicz M, Schott V, Orzechowski M, Fischer S, Lehman W. Does Tropomyosin Slide or Roll over F-Actin during Regulatory Transitions? Biophys J. 2016;110:524a. [Google Scholar]
- 18.Orzechowski M, Moore JR, Fischer S, Lehman W. Tropomyosin movement on F-actin during muscle activation explained by energy landscapes. Arch Biochem Biophys. 2014;545:63–68. doi: 10.1016/j.abb.2014.01.001. [DOI] [PMC free article] [PubMed] [Google Scholar]
- 19.Phillips JC, Braun R, Wang W, Gumbart J, Tajkhorshid E, Villa E, Chipot C, Skeel RD, Kale L, Schulten K. Scalable molecular dynamics with NAMD. J Comput Chem. 2005;26:1781–1802. doi: 10.1002/jcc.20289. [DOI] [PMC free article] [PubMed] [Google Scholar]
- 20.Brooks BR, Brooks CL, Mackerell AD, Nilsson L, Petrella RJ, Roux B, Won Y, Archontis G, Bartels C, Boresch S, et al. CHARMM: The biomolecular simulation program. J Comput Chem. 2009;30:1545–1614. doi: 10.1002/jcc.21287. [DOI] [PMC free article] [PubMed] [Google Scholar]
- 21.Park S, Schulten K. Calculating potentials of mean force from steered molecular dynamics simulations. J Chem Phys. 2004;120:5946–5961. doi: 10.1063/1.1651473. [DOI] [PubMed] [Google Scholar]
- 22.Juraszek J, Vreede J, Bolhuis PG. Transition path sampling of protein conformational changes. Chem Phys. 2012;396:30–44. [Google Scholar]
- 23.Von Der Ecken J, Müller M, Lehman W, Manstein DJ, Penczek PA, Raunser S. Structure of the F-actin–tropomyosin complex. Nature. 2015;519:114. doi: 10.1038/nature14033. [DOI] [PMC free article] [PubMed] [Google Scholar]
- 24.von der Ecken J, Heissler SM, Pathan-Chhatbar S, Manstein DJ, Raunser S. Cryo-EM structure of a human cytoplasmic actomyosin complex at near-atomic resolution. Nature. 2016;534:724–728. doi: 10.1038/nature18295. [DOI] [PubMed] [Google Scholar]
- 25.Humphrey W, Dalke A, Schulten K. VMD: visual molecular dynamics. J Mol Graphics. 1996;14(27–28):33–38. doi: 10.1016/0263-7855(96)00018-5. [DOI] [PubMed] [Google Scholar]
Associated Data
This section collects any data citations, data availability statements, or supplementary materials included in this article.


