Abstract
In this work, we have fabricated physiologically relevant polydimethylsiloxane microfluidic phantoms to investigate the fluid-structure interaction that arises from the interaction between a non-Newtonian fluid and the deformable wall. A shear thinning fluid (Xanthan gum solution) is used as the blood analog fluid. We have systematically analyzed the steady flow characteristics of the microfluidic phantom using pressure drop, deformation, and flow visualization using micro-PIV (Particle Image Velocimetry) to identify the intricate aspects of the pressure as well as the velocity field. A simple mathematical formulation is introduced to evaluate the flow induced deformation. These results will aid in the design and development of deformable microfluidic systems and provide a deeper understanding of the fluid-structure interaction in microchannels with special emphasis on biomimetic in-vitro models for lab-on-a-chip applications.
I. INTRODUCTION
Understanding the fluid mechanics in the human body has been one of the prime motivators of the systematic study of fluid flow, in general, since the very early days. It was Poiseuille, who mathematically formulated what is now known as the Hagen-Poiseuille equation based on a series of experiments in narrow tubes.1 Otto Frank proposed the Windkessel effect to account for the time-varying flow in a compliant vessel.2 Later, Womersley came up with a theoretical model based on in-vivo experimentations of arterial flows for a clear understanding of the hydrodynamics inside physiological vessels.3 More recently, with the advent of sophisticated experimental and analyzing techniques and due to the ease and controllability over experimental parameters, scientists turned to in-vitro models to address biofluid mechanics inside the vessels.4–6 Although the comparability of results between in-vitro studies and the in-vivo or ex-vivo studies remains debatable, they still prove to be extremely useful for understanding the basic flow physics as well as for the design and development of novel biomedical devices. The major challenges associated with in-vitro investigations are miniaturization, complex nature of the fluid itself, and the deformability of the vessel wall. With the advent of fabrication technologies like photolithography and soft lithography, miniaturization is now possible even in the range of nanometers.7 The complexity of fluids like blood can be addressed by using blood analog fluids that can mimic its mechanical properties.8,9 The use of such fluids further circumvents the complexity of considering blood as a nonhomogeneous liquid, overcomes the issues associated with optical transparency, and obviates the consideration of sanitary and ethical concerns.
The deformability of the vessel wall is the key element in the fluid-structure interaction (FSI) in an in-vitro model. One of the standard models to study the deformable aspects in a vessel to mimic the physiological conditions is the Starling resistor,10,11 which is a collapsible vessel of finite length contained within a cavity at a certain external pressure. This model is very useful to predict many of the FSI phenomena in the human body that involve deformation and subsequent collapse of the vessel especially in the pulmonary airways with sizes larger than the arterial vessels. However, there is a scarcity of in-vitro experimental models involving sub-millimeter sized, non-collapsible vessels with non-negligible deformation, which is more common in the circulatory system.
The effect of deformation of the microchannel walls and membranes on the bulk fluid flow has been studied both experimentally and numerically for Newtonian fluid flows.12–17 Starting with the theoretical model based on a dimensionless deformability parameter in deformable rectangular microchannels,18 recent parameter-free models have emerged as a significant contribution to this field.19 Deformable microchannels and structures are used in a number of on-chip microfluidic applications like flow stabilization13,20 pumping,21 fluidic diodes,22 valves,23 droplet generation,24 cantilever based optoelectronic sensors,25 frequency specific flow control,26 wearable electronics,27 and many other biomimetic applications including artificial cilia.25,28 It is observed that even for a small deformation of the microchannel wall, there is a considerable reduction in the shear stress distribution in the channel which further affects the forces on any suspended particle like RBCs (Red blood cells) which may further influence the cell morphology. The altered velocity profile along the axial direction can significantly affect the shear-induced lift of the particles in inertial microfluidic flows29 and particle distribution in shear-induced diffusion (SID).30 It has also a profound impact on microfluidic flow field fractionation techniques31 that are based on the shear stress distribution in the channel which is a consequence of the velocity gradient itself. Furthermore, the shear stresses (in the fluid) in the near-wall region acting on biological cells like the endothelial cells lining the interior surface of blood vessels can dramatically influence their gene expression and phenotype.32
Although a large number of FSI studies in in-vitro biofluid mechanics have looked at the problem from a numerical and theoretical perspective, even basic experimental studies are lacking in the literature for deformable microchannels, especially with complex fluids like blood and blood analog fluids. While investigating non-Newtonian FSI, special attention should be given to decouple the effects of the deformable wall and the complexity of the fluid on the bulk flow in such vessels through a careful choice of parameters. The seminal works by Heil, Grotberg, and their co-workers have addressed the physiological FSI in Starling resistor models, but did not look into the aspect of non-Newtonian nature of the fluid in their investigations.10,11 Recently, Raj and Sen have conducted pressure drop measurements using a shear thinning fluid in a rectangular microchannel,15 while Nahar et al. studied the deformation in a collapsible vessel using a non-Newtonian fluid in macro-sized channels.4 In this respect, none of the previous works seems to address the flow of a non-Newtonian fluid in a physiologically relevant cylindrical microchannel with a deformable wall using simultaneous measurement of pressure, wall deformation, and velocity field.
With the motivation to address the aforementioned issues in the existing experimental paradigm of small deformation studies in deformable microchannel with a non-Newtonian fluid flow, we have investigated FSI in physiologically relevant embedded deformable microchannels with varying softness using polydimethylsiloxane (PDMS). Such PDMS-based phantoms have gained much attention recently due to the ease of fabrication and operation, optical compatibility, biocompatibility, and due to the fact that the rheological parameters of this elastomer can be tuned very easily by changing the base to cross-linker ratio during preparation. Furthermore, disease-relevant features like stenosis can also be integrated easily in such systems.6,33 Cylindrical microchannels with a size comparable to arteries were fabricated using a frugal procedure utilizing a pull-out soft lithography technique. The popular in-vitro blood mimicking fluid Xanthan gum (XG) solution is used as the non-Newtonian biofluid. Special attention is devoted to the careful characterization of both the deformable solid wall and the non-Newtonian fluid. Pressure drop and wall deformation are monitored as a function of the imposed flow rate. Furthermore, velocity fields were evaluated to examine the effect of the deformable wall on the velocity distribution. A simple mathematical model is also proposed to evaluate the flow induced deformation of the channel wall.
The rest of the paper is organized as follows: Sec. II explains the fabrication of the microchannels, experimental setup, and the characterization of the fluid and solid components used in the experiments. In Sec. III, a simple mathematical formulation is developed to estimate the deformation in a microchannel embedded in a block of elastic solids. Section IV discusses the results obtained for the steady flow experiments in a rigid and deformable microchannel. The salient conclusions of this study are summarized in Sec. V.
II. EXPERIMENTAL METHODS AND PROCEDURE
A. Fabrication and characterization of the microchannel
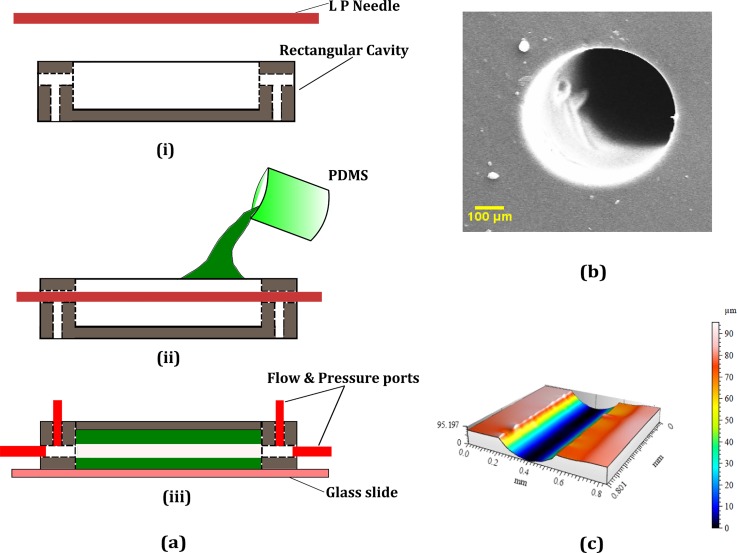
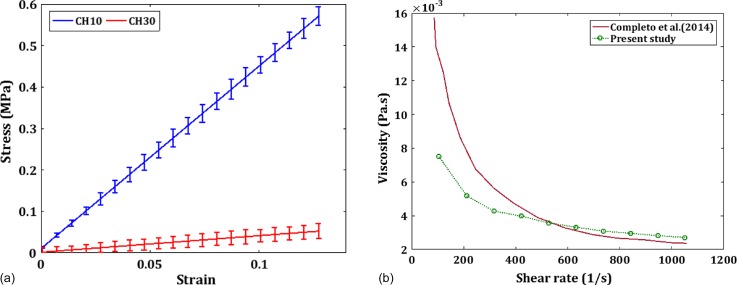
We fabricated the microfluidic channel using a pull-out soft lithography process as depicted in Fig. 1(a). This is similar to the earlier methods of using wires and polymeric materials as molds for fabricating true cylindrical microchannels.34,35 LP (Lumbar puncture) needles of nominal diameter, D = 510 μm (Comet India), were used as the replicating mold for the fabrication process. A rectangular brass cavity of dimensions (30 × 15 × 5 mm) was fabricated to hold the PDMS microchannel and to house the inlets, outlets, and the pressure sensing ports. The microchannel fabricated inside the cavity is of length L which is taken as the distance between the inlet and outlet pressure sensing terminals. The base polymer and curing agents of the two-part PDMS (Sylgard 184, Dow Corning, Midland, MI, USA) were mixed in the required ratio and kept in a vacuum chamber to remove air bubbles generated during mixing. For the current experiment, two base to cross linker ratios were chosen, 10:1 (CH10) and 30:1(CH30). The PDMS mixture was then poured over the needle mold which was kept along the length from inlet to outlet as shown in Fig. 1(a) and cured in an oven at 95 °C for 12 h. The needle is gently pulled off from the PDMS matrix once it is cured and the inlet, outlet, and pressure sensor ports were inserted into the structure using hollow metallic needles. The current method is frugal compared to many other soft lithography techniques as it does not employ any mold fabrication process like photolithography or any other rapid prototyping methods.36,37 Furthermore, the present fabrication technique yielded very good results regarding surface homogeneity and withstood high pressures during leak flow testing. The final dimension of the cross-section of the microchannel was observed under a microscope and the diameter was measured using standard image processing methods. Specific details of the fabricated channel geometry and the flow conditions are presented in Table I. A cross-section of the microchannel under a scanning electron microscope is also given in Fig. 1(b). The roughness of the wall surface was measured on a longitudinal cut section of the microchannel using a non-contact profilometer (Taylor Hobson CCI MP non-contact 3D Profiler) as shown in Fig. 1(c) and the average roughness Ra was found to be less than 1 μm). The Young's modulus (E) of both CH10 and CH30 was measured using a standard tensile testing equipment (Hounsfield Universal Testing Machine) according to the ASTM D-412-C standard. The stress-strain curve is shown in Fig. 2(a). Furthermore, the shear modulus (G) values were measured using a rheometer (Anton Paar GmBH), and the Poisson ratio (ν) is calculated using the relation . The elastic properties of both PDMS samples are summarized in Table II.
FIG. 1.
Steps involved in the fabrication of the cylindrical microchannels and their characterization. (a) (i) The needle mold and rectangular brass cavity. (ii) Pouring PDMS into the cavity with the mold in position. (iii) Mold removed after the PDMS in cured and a base glass slide and ports inserted. (b) SEM of the cross-section of the channel. (c) 3D Profilometry of the inner channel surface along a longitudinal cut section.
TABLE I.
Experimental parameters.
| Quantity | Value/range |
|---|---|
| Channel diameter, D (μm) | 510 ± 5 |
| Channel length, L (mm) | 27 |
| Flowrate, Q (μl/min) | 0–1000 |
| Reynolds Number, Re | 0–40 |
FIG. 2.
(a) The characterization of the channel material (PDMS) using a UTM (Hounsfield). (b) Characterization of the Non-Newtonian fluid XG using a Rheometer (Anton Paar MCR 302) compared against the value from the literature.
TABLE II.
Elastic properties of PDMS.
| Property | CH10 | CH30 |
|---|---|---|
| Young's modulus, E (MPa) | 2.801 | 0.157 |
| Shear modulus, G (MPa) | 0.959 | 0.053 |
| Poisson ratio, ν | 0.46 | 0.48 |
B. Preparation and characterization of Non-Newtonian fluid
Deionized water (Milli-Q, Millipore India) is used as the Newtonian fluid (DI). Based on the existing literature, Xanthan gum (XG) based solutions are the best choice for non-Newtonian blood analog fluids.38,39 It can cover a wide variety of hematocrit (volume fraction of RBCs) values and the viscosity matches with that of real blood with a slightly added elastic component. For adjusting the refractive index for optical access, Sodium Azide (NaI) may be added without much effect on the viscoelastic properties.40 For the present experiment, an aqueous solution of XG (Sigma-Aldrich) (0.04% w/w) is used for all the non-Newtonian experiments. The powdery XG is dissolved in DI water and stirred for 12 h to give a homogenous solution.
A Physica D (Anton Paar) rheometer with a cone and flat plate geometry was used to characterize the properties of the non-Newtonian fluid. The non-Newtonian fluids were tested under steady, increasing shear (strain sweep mode) which provides the variation of viscosity versus shear rate. All the rheometer tests are performed under a constant and controlled temperature of 25 ± 0.03 °C. The viscosity variation with the strain rate closely matched with the existing results in the literature41 as shown in Fig. 2(b). For the power law model used in the current study, , the coefficients estimated from the rheometry data after curve fitting are and .
C. Experimental setup and measurement procedure
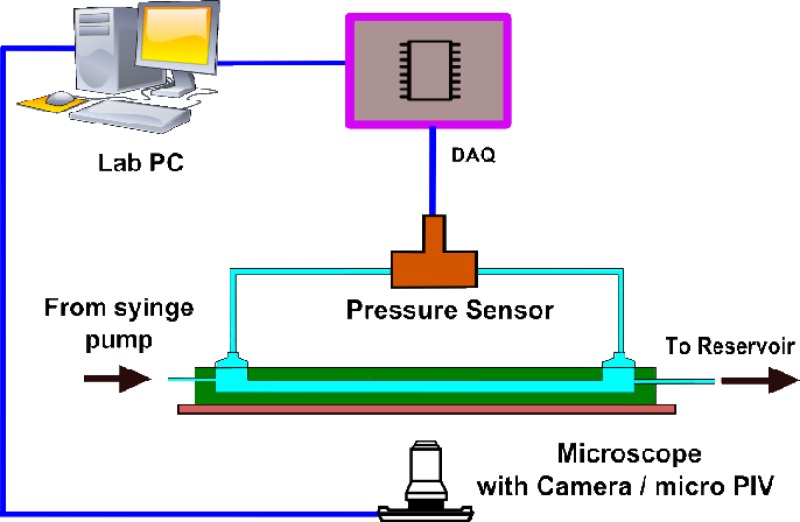
A schematic of the experimental setup is shown in Fig. 3. To achieve steady and uniform flow in our experiments, we used a syringe pump (Harvard PHD 2000) and Teflon connecting tubes. The syringe pump gives a steady fluid flow by mechanically pushing the plunger of a fluid-filled 20 ml syringe at a constant rate. The differential pressure drop across the microchannel length is measured using a differential pressure sensor (Honeywell FDW) which is connected to a data acquisition system [DAQ (NI 6009, National Instruments)] which is interfaced with the Lab PC running Labview (National Instruments) program. The DAQ continuously acquires the raw voltage from the pressure sensor and is converted to physical units based on the instrument calibration chart in the Labview interface. A high sampling rate of 1 kHz is employed in the DAQ that matched with the response time of the pressure sensor (1 ms).
FIG. 3.
The experimental setup showing the pressure measurement system using DAQ, a microscope, and an imaging system for deformation measurement and micro-PIV for flow visualization.
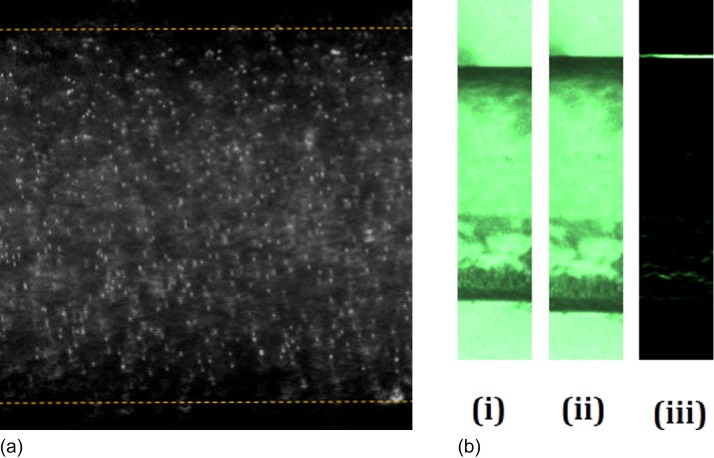
Estimation of the wall deformation is the most sensitive measurement in the present study. A three-dimensional scanning technique like the confocal microscope is ideal for the deformation measurement in usual rectangular glass-PDMS microchannels.18 Furthermore, indirect methods utilizing the fluorescent microscopy and dyed fluid is also used for estimating the deformation of the top wall.14,42 However, due to the axisymmetric nature of the wall in the present experiment, deformation can be observed directly under the microscope with a simple phase contrast microscopy. Standard edge detection algorithm in the MATLAB (MathWorks) image processing toolbox applied on the captured images will give an accurate location of the wall position as shown in Fig. 4(b). A high-speed camera (Phantom v741) is attached to the microscope to capture the real-time will deformation with a resolution of 1024 × 1024 pixels using a 40× magnification objective lens. A higher magnification enables focusing on a single wall rather than a full diametrical view using a lower magnification. Hence, the field of view is very small, thus giving a high spatial resolution of 1.9 pixel/μm.
FIG. 4.
(a) Representative micro-PIV image of the tracer particles in the flow. (b) Representative high-speed camera image for deformation analysis using edge detection. (i) Undeformed position at the rest positon. (ii) Deformed channel when flow becomes steady state. (iii) Image after detecting the wall using edge detection as shown in supplementary material Movie S1.
For flow visualization, a micro-PIV (Particle Image Velocimetry) apparatus (TSI Instruments Ltd., USA) is utilized. We used seeding particles as polystyrene beads of 1 μm nominal diameter (Sigma-Aldrich). The synchronizer of the micro-PIV is synced with the pressure sensor with the TTL signal from the Labview interface for simultaneous measurement of pressure drop and the velocity field. An iterative multi-pass cross-correlation algorithm using Fast Fourier Transform (FFT) with a final sub-window size of 32 × 32 pixel and an overlap of 50% was chosen to evaluate the final velocity field. For steady flow, an ensemble averaging with 100 pairs were used. Representative images for micro-PIV and deformation analysis are given in Fig. 4(a). All the measurements for pressure drop, deformation, and micro-PIV were recorded upon reaching a steady state when the pressure drop and the wall deformation attain a constant value. Though the XG solution has a slight viscoelastic component, the effects are pertinent only in time-dependent flows.
III. MATHEMATICAL MODEL
In this section, we lay down the pertinent equations for the modeling of the current experiment that accounts for the deformation of the channel wall upon steady flow.
Figure 5(a) shows the schematic of the microchannel of radius R in a rectangular block of dimensions L, W, and H. Note that our configuration is different from a thin-walled tube configuration for which there is a well established relationship for the deformation.43 The mechanical equilibrium equations are given by
| (1) |
where is the stress tensor. Using axisymmetry and the slenderness of the channel, the radial component of the mechanical equilibrium equations reduces to
| (2) |
where and are the normal components of the stress tensor in the radial and the angular directions, respectively. Note that the term involving scales out because we assume zero axial displacement and because of the smallness of the radial displacement compared to the characteristic axial length scale. These reductions are equivalent to the lubrication approximation for fluid flow through narrow confinements. For the solid material, we use linear, elastic, isotropic behavior given by
| (3) |
where and are the Lamé parameters, I is the identity tensor, and is the displacement vector in the cylindrical coordinates given by . Using the same considerations that were used to reduce the mechanical equilibrium equations, we obtain
| (4a) |
| (4b) |
We use Eqs (4a) and (4b) in (2) to obtain the equation that governs the displacement along the radial direction as
| (5) |
For the boundary conditions, we first require that the radial displacement should not be infinite even for extremely large ; thus
| (6) |
Second, we require that at the wall (where the solid material interfaces with the liquid), the normal stress in the radial direction is dictated by the fluid pressure; thus
| (7) |
where, importantly, the fluid pressure (p) varies along the axial (z) direction. Solving Eq. (3) subject to the boundary conditions (6) and (7), we obtain
| (8) |
If the pressure gradient is assumed to be constant along z, the deformation is also linear in .
FIG. 5.
(a) Rectangular block of dimensions L × W × H containing the cylindrical microchannel. (b) (i) The cross-section of the channel showing the coordinates. (ii) Undeformed radius R and the radial deformation αr. (c) Schematic showing the deformation profile as seen by the microscope (i) before flow and (ii) after reaching the steady state.
Finally, we arrive at the expression for the wall deformation (at r = R) along the length of the channel with at the inlet and the outlet of the channel
| (9) |
IV. RESULTS AND DISCUSSIONS
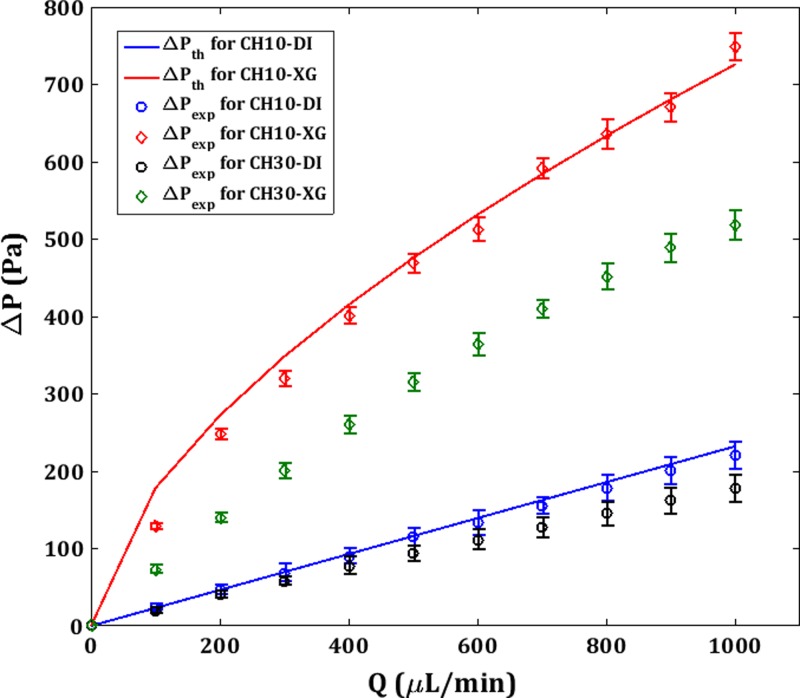
In the following discussion, CH10 is considered to be rigid and CH30 as the deformable microchannel. Figure 6 shows the pressure drop vs. flow rate (ΔP-Q) plot for theoretical (ΔPth) and experimental (ΔPexp) values. ΔPexp is directly measured from the pressure sensor. Errorbars indicate the standard error of the mean for ΔPexp measurements. ΔP values are higher for XG than DI due to a higher μapp even in the higher shear rate regime as demonstrated in Fig. 2(b). Since the radius, R, is constant for CH10 for the entire range of Q that is tested, ΔPth can be estimated from the theoretical Hagen-Poiseuille equation for DI using the geometrical parameters and the viscosity, μ
| (10) |
FIG. 6.
Experimental (ΔPexp) and theoretical steady flow pressure drop (ΔPth) vs. flowrate for CH30 and CH10 for DI and XG.
For XG, the modified Hagen-Poiseuille equation for a power-law fluid with the fitting constants m and n is used as44
| (11) |
The experimental curves are found to be fairly matching with the experimental data for CH10. For XG in CH10, ΔPexp shows a nonlinear trend due to the shear thinning effect and the corresponding reduction in the apparent viscosity which is consistent with the Eq. (8).
For CH30, only ΔPexp is plotted since R is a function of the axial coordinate z itself due to the flow induced deformation and thus, the Hagen-Poiseuille equation is not strictly valid. CH30 shows a reduced ΔPexp than CH10 for both DI and XG due to the deformation and associated reduction in the hydraulic resistance. The deviation from ΔPth increases with Q but shows a near linear trend. However, For XG in CH30, two factors are contributing to the non-linearity in ΔPexp concerning the flow rate, i.e., the wall deformation and the shear thinning behavior. The former is associated with the solid part which is structural, whereas the latter is due to the nature of the fluid which is of hydrodynamic origin. Raj and Sen15 have shown a decrease in pressure drop at high flow rates for compliant rectangular microchannels of a much smaller hydraulic diameter (160 μm) than the present study using a similar shear thinning fluid [poly(ethylene oxide)]. This culminates in maxima in the ΔP-Q curve in their results. However, our finding contradicts this and is supported by Eq. (8) which shows a monotonous increase in the ΔP with Q.
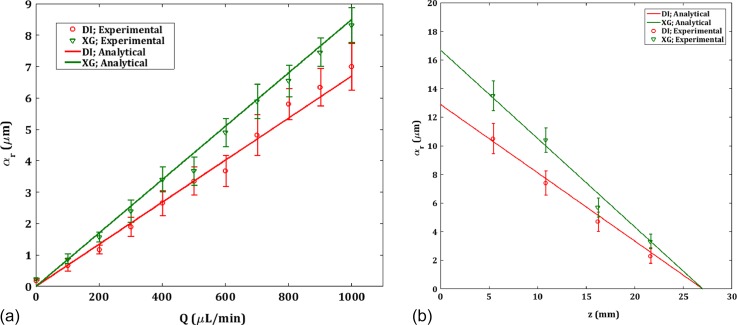
Figure 7(a) shows the deformation of the CH30 channels for both DI and XG. The deformation in CH10 channel was negligible and not plotted here. The deformation profile follows almost linear behavior and the deformation is higher in XG than DI. The maximum deformation is at the inlet where the pressure is highest. Though the maximum radial deformation αr is 2% of the diameter, it gives rise to an effective cross-sectional area increase in 8% which will considerably affect the hydraulic resistance in the channel and hence the pressure drop. Figure 8(b) shows the wall deformation for Q = 1000 μl/min along the z direction. The theoretical deformation plot is generated using Eq. (9) and ΔPexp from the pressure drop experiment. Since the outlet is exposed to the atmosphere, p2 is set as zero. From Fig. 7(b), it is observed that the deformation yields effectively a tapered profile for the channel. Essentially, the current model pertains to a one-way FSI scenario, where the pressure inside the channel is directly and completely determined from the imposed flow only. The small radial deformation matches the observation of Neelamegam and Shankar45 in a similar system of pressure-driven flow in a cylindrical tube that the deformation in the crosswise direction is in fact very small.
FIG. 7.
(a) Experimental and theoretical deformation at the center (z = 13.5 mm) for the deformable CH30 channels vs. flowrate (b) Experimental and theoretical deformation along the axial coordinate z at four locations for a flowrate of Q = 1000 μl/min.
FIG. 8.
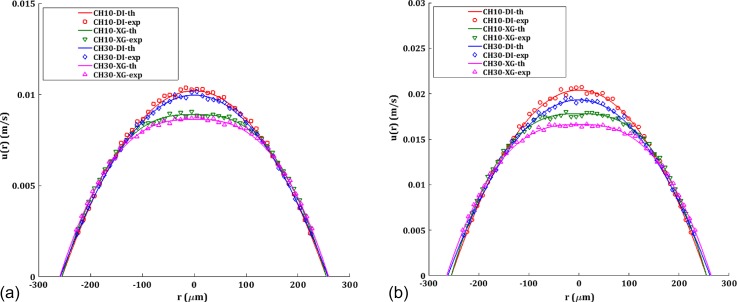
Velocity profiles at the center (z = 13.5 cm) for CH10 and CH30 channels compared with the theoretical profile for (a) Q = 500 μl/min (b) Q = 1000 μl/min. Solid lines represent the theoretical values adjusted with the modified diameter of the channel in the case of deformation.
The axial velocity profile u(r) for Q = 500 μl/min and Q = 1000 μl/min is depicted in Fig. 8. Experimental values are obtained directly from the micro-PIV results. Near-wall micro-PIV results are noisy due to the refractive index mismatch as well as the curvature of the channel and are ignored in the present analysis. In the case of DI for CH10, theoretical u(r) is plotted using ΔPexp for that particular Q in the Hagen-Poiseuille equation for velocity given by
| (12) |
For CH30, the modified diameter of the tube from the deformation experiments at the section where u(r) is probed is used in Eq. (12). Hagen-Poiseuille flow gives a parabolic velocity profile since it minimizes the work done to overcome the viscous resistance in the channel. However, near the inlet section, the velocity distribution is evolving and thus gives a larger pressure drop than the downstream section. In a microchannel flow, as the entrance length is very small compared to the length of the channel due to low Reynolds number, this effect is usually neglected. For XG, the theoretical velocity profile for is modified through the fitting constants m and n obtained from the rheometry experiment given by
| (13) |
The experimental velocity profiles match well with the theoretical profiles, ruling out any instability or secondary flow effects46 on the velocity profiles within the limit of the Reynolds number in the current experiment. XG shows a blunt velocity profile with reduced maximum velocity umax than DI. The maximum velocity is more affected by the shear thinning effect than the deformability of the channel for a given Q resulting in highest umax for CH10-DI and lowest for CH30-XG. Furthermore, this difference increases as the deformation increases with the flow rate as observed in Fig. 8. Though CH10-XG has the highest ΔPexp as depicted in Fig. 6, the shear thinning effect has rendered its umax being lower than CH10-DI and CH30-DI. Interestingly, though we do not have an expression to predict ΔPth for CH30, the velocity profile can be evaluated from the local deformation and the rheological data. The parabolic velocity profile is responsible for the linear shear stress distribution in the transverse direction of the channel, with maximum at the wall and zero at the center. Furthermore, the alteration in the velocity profile due to deformation will result in a lower shear stress at a given point in the r coordinate.
V. CONCLUSIONS
To investigate the complex fluid-structure interactions in a physiologically relevant microchannel with deformable wall and non-Newtonian fluid that flows within it, we fabricated cylindrical microchannels of various values of softness using PDMS. A simple analytical model that considers the deformation of the cylindrical microchannel under pressure-driven flow is developed here. We propose that the present theory can be used in the case of small elastic deformations safely, within the context of one way FSI problem. Though the wall deformation is small compared to the diameter of the channel, the impact of this deformation induced effects in the local hydrodynamics can play a critical role in the migration of suspended particles like RBCs. Furthermore, predicting the velocity profiles based on the wall deformation and the rheological parameters of the non-Newtonian fluid at a given axial position in the channel is also demonstrated. We believe that these results will aid in the design of polymer-based microfluidic phantoms for arterial FSI studies, and in particular for studying blood analog fluids in cylindrical microchannels as well as developing lab-on-a-chip systems for medical diagnostics.
SUPPLEMENTARY MATERIAL
See supplementary material for a representative video showing detection of the wall deformation after reaching the steady state.
References
- 1. Sutera S. P. and Skalak R., Annu. Rev. Fluid Mech. 25, 1 (1993). 10.1146/annurev.fl.25.010193.000245 [DOI] [Google Scholar]
- 2. Westerhof N., Lankhaar J. W., and Westerhof B. E., Med. Biol. Eng. Comput. 47, 131 (2009). 10.1007/s11517-008-0359-2 [DOI] [PubMed] [Google Scholar]
- 3. Hale J., McDonald J. R., and Womersley D. A., J. Physiol. 128, 629 (1955). 10.1113/jphysiol.1955.sp005330 [DOI] [PMC free article] [PubMed] [Google Scholar]
- 4. Nahar S., Jeelani S. A. K., and Windhab E. J., Chem. Eng. Sci. 75, 445 (2012). 10.1016/j.ces.2012.03.051 [DOI] [Google Scholar]
- 5. Pielhop K., Klaas M., and Schröder W., Eur. J. Mech. B 50, 71 (2015). 10.1016/j.euromechflu.2014.11.001 [DOI] [Google Scholar]
- 6. Pielhop K., Klaas M., and Schröder W., Eur. J. Mech. B 35, 102 (2012). 10.1016/j.euromechflu.2012.01.010 [DOI] [Google Scholar]
- 7. Xia Y. and Whitesides G. M., Annu. Rev. Mater. Sci. 28, 153 (1998). 10.1146/annurev.matsci.28.1.153 [DOI] [Google Scholar]
- 8. Sousa P. C., Pinho F. T., Oliveira M. S. N., and Alves M. A., Biomicrofluidics 5, 14108 (2011). 10.1063/1.3567888 [DOI] [PMC free article] [PubMed] [Google Scholar]
- 9. Campo-Deaño L., Dullens R. P. A., Aarts D. G. A. L., Pinho F. T., and Oliveira M. S. N., Biomicrofluidics 7, 34102 (2013). 10.1063/1.4804649 [DOI] [PMC free article] [PubMed] [Google Scholar]
- 10. Grotberg J. B. and Jensen O. E., Annu. Rev. Fluid Mech. 36, 121 (2004). 10.1146/annurev.fluid.36.050802.121918 [DOI] [Google Scholar]
- 11. Heil M. and Hazel A. L., Annu. Rev. Fluid Mech. 43, 141 (2011). 10.1146/annurev-fluid-122109-160703 [DOI] [Google Scholar]
- 12. Chakraborty D., Prakash J. R., Friend J., and Yeo L., Phys. Fluids 24, 102002 (2012). 10.1063/1.4759493 [DOI] [Google Scholar]
- 13. Yang B. and Lin Q., J. Microelectromech. Syst. 18, 539 (2009). 10.1109/JMEMS.2009.2021826 [DOI] [PMC free article] [PubMed] [Google Scholar]
- 14. Raj M. K., DasGupta S., and Chakraborty S., Microfluid. Nanofluid. 21, 70 (2017). 10.1007/s10404-017-1908-5 [DOI] [Google Scholar]
- 15. Raj A. and Sen A. K., Microfluid. Nanofluid. 20, 31 (2016). 10.1007/s10404-016-1702-9 [DOI] [Google Scholar]
- 16. Shidhore T. C. and Christov I. C., J. Phys. Condens. Matter 30, 054002 (2017). 10.1088/1361-648X/aaa226 [DOI] [PubMed] [Google Scholar]
- 17. Cheung P., Toda-Peters K., and Shen A. Q., Biomicrofluidics 6, 26501 (2012). 10.1063/1.4720394 [DOI] [PMC free article] [PubMed] [Google Scholar]
- 18. Gervais T., El-Ali J., Günther A., and Jensen K. F., Lab Chip 6, 500 (2006). 10.1039/b513524a [DOI] [PubMed] [Google Scholar]
- 19. Christov I. C., Cognet V., Shidhore T. C., and Stone H. A., J. Fluid Mech. 841, 267 (2018). 10.1017/jfm.2018.30 [DOI] [Google Scholar]
- 20. Iyer V., Raj A., Annabattula R. K., and Sen A. K., J. Micromech. Microeng. 25, 75003 (2015). 10.1088/0960-1317/25/7/075003 [DOI] [Google Scholar]
- 21. Xie J., Shih J., Lin Q., Yang B., and Tai Y.-C., Lab Chip 4, 495 (2004). 10.1039/b403906h [DOI] [PubMed] [Google Scholar]
- 22. Groisman A. and Quake S. R., Phys. Rev. Lett. 92, 94501 (2004). 10.1103/PhysRevLett.92.094501 [DOI] [PubMed] [Google Scholar]
- 23. Seker E., Leslie D. C., Haj-Hariri H., Landers J. P., Utz M., and Begley M. R., Lab Chip 9, 2691 (2009). 10.1039/b903960k [DOI] [PubMed] [Google Scholar]
- 24. Pang Y., Kim H., Liu Z., and Stone H. A., Lab Chip 14, 4029 (2014). 10.1039/C4LC00871E [DOI] [PubMed] [Google Scholar]
- 25. Sadegh Cheri M., Latifi H., Sadeghi J., Salehi Moghaddam M., Shahraki H., and Hajghassem H., Analyst 139, 431 (2013). 10.1039/C3AN01588B [DOI] [PubMed] [Google Scholar]
- 26. Leslie D. C., Easley C. J., Seker E., Karlinsey J. M., Utz M., Begley M. R., and Landers J. P., Nat. Phys. 5, 231 (2009). 10.1038/nphys1196 [DOI] [Google Scholar]
- 27. Yeo J. C., Kenry K., and Lim C. T., Lab Chip 16, 4082 (2016). 10.1039/C6LC00926C [DOI] [PubMed] [Google Scholar]
- 28. Alexeev A., Yeomans J. M., and Balazs A. C., Langmuir 24(21), 12102–12106 (2008) 10.1021/la801907x. [DOI] [PubMed] [Google Scholar]
- 29. Amini H., Lee W., and Di Carlo D., Lab Chip 14, 2739 (2014). 10.1039/c4lc00128a [DOI] [PubMed] [Google Scholar]
- 30. Grandchamp X., Coupier G., Srivastav A., Minetti C., and Podgorski T., Phys. Rev. Lett. 110, 108101 (2013). 10.1103/PhysRevLett.110.108101 [DOI] [PubMed] [Google Scholar]
- 31. Yamada M., Nakashima M., and Seki M., Anal. Chem. 76, 5465 (2004). 10.1021/ac049863r [DOI] [PubMed] [Google Scholar]
- 32. Topper J. N. and M. A. Gimbrone, Jr. , Mol. Med. Today 5, 40 (1999). 10.1016/S1357-4310(98)01372-0 [DOI] [PubMed] [Google Scholar]
- 33. Geoghegan P. H., Buchmann N. A., Spence C. J. T., Moore S., and Jermy M., Exp. Fluids 52, 1331 (2012). 10.1007/s00348-011-1258-0 [DOI] [Google Scholar]
- 34. Henthorn K. H., Rev. Sci. Instrum. 80, 066103 (2009). 10.1063/1.3152365 [DOI] [PubMed] [Google Scholar]
- 35. Fiddes L. K., Raz N., Srigunapalan S., Tumarkan E., Simmons C. A., Wheeler A. R., and Kumacheva E., Biomaterials 31, 3459 (2010). 10.1016/j.biomaterials.2010.01.082 [DOI] [PubMed] [Google Scholar]
- 36. Zhao X.-M., Xia Y., and Whitesides G. M., J. Mater. Chem. 7, 1069 (1997). 10.1039/a700145b [DOI] [Google Scholar]
- 37. Wilson M. E., Kota N., Kim Y., Wang Y., Stolz D. B., LeDuc P. R., and Ozdoganlar O. B., Lab Chip 11, 1550 (2011). 10.1039/c0lc00561d [DOI] [PubMed] [Google Scholar]
- 38. Brookshier K. A. and Tarbell J. M., Biorheology 30, 107 (1993). 10.3233/BIR-1993-30202 [DOI] [PubMed] [Google Scholar]
- 39. Najjari M. R., Hinke J. A., Bulusu K. V., and Plesniak M. W., Exp. Fluids 57, 96 (2016). 10.1007/s00348-016-2185-x [DOI] [Google Scholar]
- 40. Long J. A., Undar A., Manning K. B., and Deutsch S., ASAIO J. 51, 563 (2005). 10.1097/01.mat.0000180353.12963.f2 [DOI] [PubMed] [Google Scholar]
- 41. Completo C., Geraldes V., and Semiao V., Int. J. Heat Fluid Flow 46, 17 (2014). 10.1016/j.ijheatfluidflow.2013.12.008 [DOI] [Google Scholar]
- 42. Hardy B. S., Uechi K., Zhen J., and Pirouz Kavehpour H., Lab Chip 9, 935 (2009). 10.1039/B813061B [DOI] [PubMed] [Google Scholar]
- 43. Fung Y., Biomechanics: Circulation ( Springer Science & Business Media, 2013). [Google Scholar]
- 44. Bird R. B., Stewart W. E., and Lightfoot E. N., Transport Phenomena ( Wiley, New York, 1960), pp. 413. [Google Scholar]
- 45. Neelamegam R. and Shankar V., Phys. Fluids 27, 24102 (2015). 10.1063/1.4907246 [DOI] [Google Scholar]
- 46. Bandaru P. and Kumaran V., Chem. Eng. Sci. 149, 156 (2016). 10.1016/j.ces.2016.04.001 [DOI] [Google Scholar]
Associated Data
This section collects any data citations, data availability statements, or supplementary materials included in this article.
Supplementary Materials
See supplementary material for a representative video showing detection of the wall deformation after reaching the steady state.


