

Abstract
Models of firing rate homeostasis such as synaptic scaling and the sliding synaptic plasticity modification threshold predict that decreasing neuronal activity (e.g. by sensory deprivation) will enhance synaptic function. Manipulations of cortical activity during two forms of visual deprivation (dark exposure (DE) and binocular lid suture (BS)) revealed that, contrary to expectations, spontaneous firing in conjunction with loss of visual input is necessary to lower the threshold for Hebbian plasticity and increases mEPSC amplitude. Blocking activation of GluN2B receptors, which are up-regulated by DE, also prevents the increase in mEPSC amplitude, suggesting that DE potentiates mEPSCs primarily through a Hebbian mechanism, not through synaptic scaling. Nevertheless, NMDAR-independent changes in mEPSC amplitude consistent with synaptic scaling could be induced by extreme reductions of activity. Therefore, two distinct mechanisms operate within different ranges of neuronal activity to homeostatically regulate synaptic strength.
Introduction
Homeostatic regulation of neuronal activity, the maintenance of neuronal spiking output within an optimal range, is widely considered essential to preserve neuronal processing in the face of changing inputs 1,2. Multiple mechanisms that can accomplish this homeostasis have been identified, including synaptic scaling 3 and the sliding modification threshold for Hebbian plasticity 4. A common feature of these mechanisms is that deviations in neuronal activity away from a target set point elicit a compensatory response in postsynaptic function.
In the sliding threshold model, often referred as metaplasticity, the threshold for the induction of long-term potentiation (LTP) and long-term depression (LTD) is determined by the history of neuronal spiking such that LTP is favored at the expense of LTD when activity is low, and LTD at the expense of LTP when activity is high 4–6. This has been validated in the rodent primary visual cortex (V1), where complete visual deprivation via dark exposure (DE) for as little as 2 days lowers the threshold for LTP induction 7–9. Lowering the LTP threshold is thought to be mediated by the DE-induced increase in the number of synaptic N-methyl-D-aspartate receptors (NMDARs) containing the GluN2B subunit, which have slower decay kinetics and may favor LTP 10–12.
In the synaptic scaling model, reduced neuronal spiking increases (and enhanced neuronal activity decreases) the postsynaptic strength of all synapses multiplicatively13. These changes result from the synaptic insertion (and removal) of α-amino-3-hydroxy-5-methyl-4-isoxazolepropionic acid (AMPA) receptors in a process that is independent of NMDAR activation 13. Synaptic scaling was first demonstrated in cultured neurons, where bidirectional changes in neural activity elicited compensatory changes in miniature excitatory postsynaptic current (mEPSC) amplitude. Changes consistent with this model have also been demonstrated in vivo; in rodents, visual deprivation via DE 14–17, intraocular TTX injection 18, lid suture 19, enucleation 15, and retinal lesions 20 have all been demonstrated to increase the amplitude of mEPSCs in V1. Similarly, deafening by cochlear ablation and whisker trimming increase mEPSC amplitude in the primary auditory and somatosensory cortices, respectively 21–23. However, recent studies suggest that changes in overall spike rate may not be sufficient to explain scaling of mEPSCs24,25.
Both the increase in mEPSC amplitude and the reduction in LTP threshold during sensory deprivation are thought to increase spontaneous activity to return the overall neuronal firing rate to a homeostatic set point, thus compensating for the loss of sensory drive. Indeed, long-term dark rearing from birth increases spontaneous neuronal firing in juvenile V1 26,27 and DE in adults increases spontaneous firing rates in V1 neurons 28. However, recent studies indicate that changes in firing rates following changes in visual input can be fast20,29, likely via rapid changes in inhibitory GABAergic circuits 29,30, potentially preceding changes at glutamatergic synapses. This raises the possibility that the increase in spontaneous activity may be a contributing factor, rather than an effect of homeostasis at glutamatergic synapses. In this study, we re-examined the causal relationship between the recruitment of synaptic homeostasis mechanisms and cortical spike rates by manipulating V1 activity in two paradigms of visual deprivation: dark exposure (DE), which normally induces robust synaptic homeostasis, and binocular lid suture (BS), which does not. Reducing spontaneous firing in V1 prevented the increased mEPSC amplitude and decreased LTP threshold normally induced by DE, whereas increasing firing during BS promoted these changes. In addition, reducing spontaneous firing during DE prevents the upregulation of GluN2B. Blocking GluN2B activity prevents the enhancement of mEPSCs induced by DE, but not the one induced by extreme reductions in neuronal activity. Therefore we propose that: 1) the deprivation-induced increase in spontaneous firing is not merely a consequence of, but most likely a necessary condition for, synaptic homeostasis, and 2) increased mEPSC amplitude during DE reflects Hebbian potentiation of synaptic strength due to reduced induction threshold, and 3) synaptic scaling can be engaged in vivo, but by reducing neuronal activity to very low levels.
Results
Deprivation-induced metaplasticity does not depend on decreased overall firing activity
Visual deprivation decreases cortical inhibition, which increases spontaneous activity in V1 and lowers the sliding modification threshold for plasticity to favor LTP7,26,27,29. We tested whether the increase in spontaneous activity is necessary for the DE induced reduction in the plasticity threshold. We first recorded single unit activity in awake, head-fixed adult mice with chronically implanted multielectrode arrays (Supplementary Fig. 1). Compared to baseline, DE increased the overall spontaneous firing rate in V1 regular-spiking neurons (Wilcoxon rank sum test U(60)=330.5, P=0.035) (Fig. 1A), spontaneous bursting (U(60)=211.0, P≤0.001), and inter-burst spike rate (U(60)=235.0, P≤0.001) (Supplementary Fig. 2). To counteract the disinhibition caused by DE, we employed diazepam, a positive allosteric modulator of GABAA receptors used extensively to reduce cortical firing 31,32. Diazepam treatment prevented these changes in spontaneous activity when delivered chronically during DE in both naïve (Supplementary Fig. 1C) and previously deprived mice (Fig. 1A) (naïve: U(54)=366.0, P=0.676; non-naïve U(60)=379.0, P=0.155, Wilcoxon rank sum test).
Figure 1. Deprivation-induced metaplasticity does not depend on reduced firing rates.
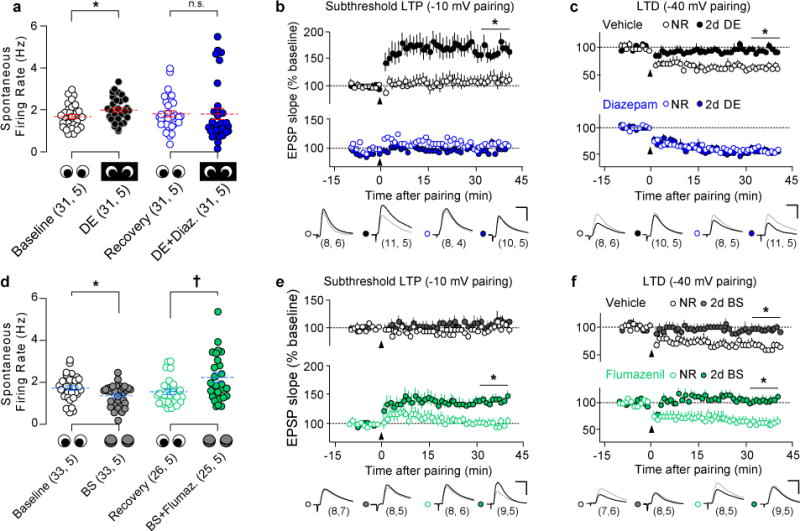
(A) Spontaneous firing rates of regular spiking single units (in response to presentation of blank screen) recorded in V1 of awake, head-fixed mice. DE increased the rate of spontaneous activity, which was blocked by diazepam treatment during DE. *P=0.035; 2-tailed Wilcoxon rank sum test. (B) DE promoted the induction of LTP with a subthreshold pairing protocol (pairing at −10 mV), which was blocked by diazepam treatment during DE. *P≤0.001, DE+vehicle vs. NR+vehicle, NR+diazepam, and DE+diazepam; One-way ANOVA followed by Holm-Sidak post-hoc test. (C) DE impaired LTD induction (pairing at −40 mV). Diazepam prevented this effect of DE. *P≤0.001, DE+vehicle vs. NR+vehicle, NR+diazepam, and DE+diazepam; One-way ANOVA followed by Holm-Sidak post-hoc test. (D) Spontaneous single unit activity was decreased by binocular lid suture (BS) alone, and increased by flumazenil treatment during BS. *P=0.023, †P=0.015; 2-tailed Wilcoxon rank sum test. (E) BS alone did not affect pairing-induced LTP, but flumazenil treatment during BS enabled LTP induction. *P≤0.001, BS+flumazenil vs. NR+vehicle, NR+flumazenil, and BS+vehicle, One-way ANOVA followed by Holm-Sidak post-hoc test. (F) BS, alone or combined with flumazenil, impaired pairing-induced LTD. *P≤0.001, BS (+/− flumazenil) vs. NR (+/− flumazenil), One-way ANOVA followed by Holm-Sidak post-hoc test. Single unit data are displayed as average±SEM (blue lines) and individual data points were displaced horizontally for clarity. Representative traces of baseline (gray) and post-LTP/LTD (black) EPSPs are shown; scale bar: 15 msec, 4 mV. Sample size is indicated in parentheses (neurons, mice).
When delivered acutely, diazepam reduced activity in V1 of controls housed in normal lighted environment (Wilcoxon signed rank test Z(26)=−3.916, P≤0.001) (Supplementary Fig. 3A). Acute diazepam also decreased spontaneous bursting (Paired t test t(26)=4.419, P≤0.001) and inter-burst firing rates (Wilcoxon signed rank test Z(26)=−3.892, P≤0.001, Wilcoxon signed rank test) (Supplementary Fig. 3C, D). Additional single unit recordings in anesthetized animals confirmed that the decrease in firing due to a single acute dose of diazepam was long-lasting, in accordance with reports of brain elimination half-life of 8-10h33 (One-way repeated measures ANOVA F(5, 15)=12.694, P≤0.001) (Supplementary Fig. 3B).
Next we asked how a decrease in spontaneous activity during DE would affect the sliding threshold for Hebbian plasticity, and administered diazepam (10 mg/kg i.p., 2×/day) during brief DE (2 days). The sliding of the threshold for Hebbian plasticity was evaluated ex vivo, in V1 slices, by performing whole cell voltage clamp recordings of the responses of Layer II/III pyramidal neurons to extracellular stimulation of Layer IV. Hebbian plasticity was induced by pairing presynaptic stimulation with postsynaptic depolarization (see Methods). To ensure that we could detect a shift in the plasticity threshold in favor of LTP, we used a pairing (−10 mV) that was below the threshold for LTP induction in normal-reared subjects. LTD was induced by pairing to −40 mV, which induces LTD in normal-reared subjects. As predicted by the sliding threshold model, and consistent with previous findings 9, DE promoted the induction of IV→II/III LTP with this subthreshold pairing protocol in slices prepared from vehicle-treated mice. Diazepam treatment prevented the promotion of LTP by DE (One-way ANOVA F(3, 33)=8.759, P≤0.001) (Fig. 1B). Likewise, DE impaired layer IV→II/III LTD in slices from vehicle, but not diazepam-treated, mice (One-way ANOVA F(3, 33)=12.251, P≤0.001) (Fig. 1C). Importantly, diazepam did not affect the threshold for LTP or LTD in normally reared mice (Fig. 1B, C; Holm-Sidak post-hoc test P=0.93 (LTP), P=0.482 (LTD)). The results indicate that reducing spontaneous activity (by enhancing GABAergic inhibition) during DE prevents the sliding of the modification threshold to favor of LTP and at the expense of LTD.
In a complementary set of experiments, we examined whether increasing neuronal spiking (by decreasing inhibition) could promote metaplasticity during BS, a milder form of visual deprivation which degrades but not eliminate patterned vision 34–36. Unlike DE, BS decreased spontaneous activity in V1 (Wilcoxon rank sum test U(64)=366.5, P≤0.001=0.023) (Fig. 1D). However, chronic treatment with flumazenil, which blocks endogenous activation of the benzodiazepine site of GABAA receptors 37, increased overall spontaneous firing rates (Wilcoxon rank sum test U(49)= 204.5, P=0.015) and spontaneous bursting (U(49)=193.0, P=0.013) in BS mice (Fig. 1D, Supplementary Fig. 2A, B). Acute flumazenil administration in normally reared controls increased overall spontaneous firing (Wilcoxon signed rank test Z(20)= 3.076, P=0.002), bursting (t(20)=−3.797, P≤0.001), and inter-burst rates (Z(20)=3.041, P=0.002, Wilcoxon signed rank test) (Fig. 1D, Supplementary Fig. 3A, C, D). Additional single unit recordings in anesthetized animals confirmed that an acute dose of flumazenil produced a long-lasting increase in firing (One-way repeated measures ANOVA F(5, 15)=12.844, P≤0.001)(Supplementary Fig. 3B).
Next, we tested whether flumazenil treatment (10 mg/kg i.p., 2×/day) promoted metaplasticity during BS. BS alone was not sufficient to slide the threshold for LTP, revealed by the absence of synaptic potentiation using the subthreshold pairing protocol (Fig. 1E). However, flumazenil treatment during BS lowered the threshold for LTP, allowing potentiation to occur (One-way ANOVA F(3, 29)=9.848, P≤0.001) (Fig. 1E). On the other hand, BS (alone or with flumazenil) impaired layer IV→II/III LTD (One-way ANOVA LTD: F(3, 28)=15.724, P≤0.001) (Fig. 1F). Importantly, flumazenil did not affect the threshold for LTP or LTD in normally reared controls (Fig. 1 E, F; Holm-Sidak post-hoc test P=0.990 (LTP), P=0.710 (LTD)). Together, these findings suggest that an increase in spontaneous activity combined with a decrease in patterned vision is necessary and sufficient to lower the synaptic modification threshold in favor of LTP.
Decreased activity during visual deprivation does not increase mEPSC amplitude
We next sought to determine if spontaneous activity impacted other types of plasticity induced by visual deprivation, such as the increase in mEPSC amplitude, thought to reflect homeostatic scaling up of synaptic strength. In these experiments, mEPSC amplitude was measured in layer II/III pyramidal neurons. As expected from previous studies 14, two days of DE induced a robust increase in mEPSC amplitude in vehicle-treated mice (Fig. 2A, B). We then combined DE (to eliminate visually-evoked activity) with diazepam (to decrease spontaneous activity). The synaptic scaling model predicts this combination would result in a larger increase in mEPSC amplitude than DE alone 3,18. Surprisingly, we found that diazepam treatment (10 mg/kg, i.p. 2×/day) during DE prevented the increase in mEPSC amplitude (Fig. 2A, B; Supplementary Table 1). Similarly, the increase in mEPSC amplitude by DE was blocked when diazepam was infused directly into the lateral ventricle (t test t(44)=2.589, P=0.013) (Supplementary Fig. 4). Diazepam treatment had no effect on mEPSC amplitude in normally reared controls (Fig. 2A, B) (One-way ANOVA F(3,46)=4.909, P=0.005; Holm-Sidak post-hoc normal reared vehicle vs diazepam P=0.831).
Figure 2. Deprivation-induced up-regulation of mEPSC amplitude does not depend on reduced firing rates.
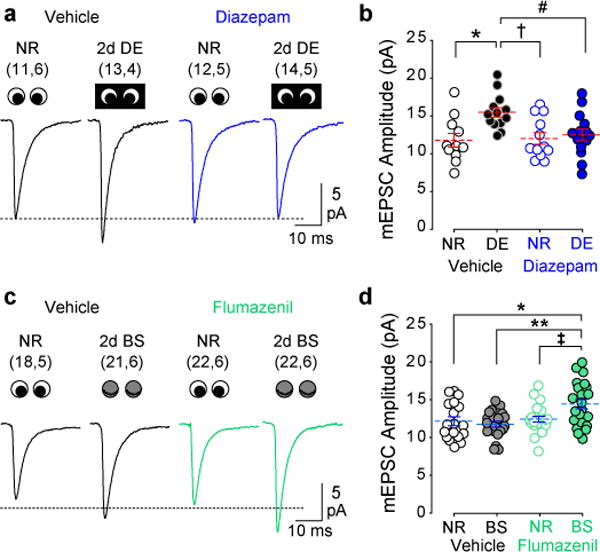
(A) Average mEPSC waveforms in normal reared (NR) and DE mice with and without diazepam treatment. (B) The DE-induced increase mEPSC amplitude observed in control, vehicle-treated mice was blocked by diazepam treatment during DE. *P=0.002, †P=0.003, #P=0.007, One-way ANOVA followed by Holm-Sidak post-hoc test. (C) Average mEPSC waveforms in NR and BS mice with and without flumazenil treatment. (D) BS alone did not increase mEPSC amplitude in control, vehicle-treated mice. However, flumazenil treatment during BS increased mEPSC amplitude. *P=0.002, **P≤0.001, ‡P=0.004, One-way ANOVA followed by Holm-Sidak post-hoc test. Blue lines indicate mean±SEM; individual data points were displaced horizontally for clarity. Sample size is indicated in parentheses (neurons, mice).
To further test whether increased spontaneous neuronal activity during visual deprivation is required to increase mEPSC amplitude, we again utilized BS, a milder form of visual deprivation. BS alone is insufficient to increase mEPSC amplitude 15 (Fig. 2C, D) or increase spontaneous neuronal spike rate (Fig. 1D). To ask if the failure of BS to increase mEPSC amplitude was due to insufficient spontaneous activity, we increased spontaneous neuronal activity with flumazenil. Flumazenil treatment during BS did increase the mEPSC amplitude (One-way ANOVA F(3, 79)=5.716, P≤0.001) (Fig. 2C, D; Supplementary Table 2). In contrast, flumazenil alone did not impact the magnitude of mEPSCs in normally reared controls (Fig. 2D, E; Holm-Sidak post-hoc test P=0.995). Together, these findings show that the homeostatic increase in mEPSC amplitude by visual deprivation requires an increase in spontaneous activity.
Allosteric modulators of GABAA receptors regulate activity by acting on synapses made by many types of interneurons. However, disinhibition during visual deprivation has been specifically attributed to a reduction in the output of parvalbumin-positive interneurons (PV-INs) 29. Therefore, we asked whether targeting PV-IN activity is sufficient to induce changes in mEPSC amplitude during visual deprivation. In a first set of experiments, we increased the excitation of PV-IN by administering neuregulin-1 peptide (NRG1) to normally reared or DE mice. Systemic delivery of NRG1 increases excitatory drive onto PV-INs 38 and decreases spontaneous firing rates in regular spiking neurons in V1 28. NRG1 treatment (10 ng/kg i.p. 2x/day) during DE blocked the increase in mEPSC amplitude (Fig. 3A, B) (One-way ANOVA F(3, 102)=5.720, P≤0.001), in accordance with the effects of diazepam.
Figure 3. Manipulations of PV IN activity regulate the deprivation-induced increase in mEPSC amplitude.
(A) Average mEPSC waveforms in normal reared (NR) and DE subjects with and without NRG1 treatment. (B) The DE-induced increase in mEPSC amplitude was blocked by NRG1 treatment. *P≤0.001, †P≤0.006, One-way ANOVA followed by Holm-Sidak post-hoc test. (C) Average mEPSC waveforms in NR and BS subjects with and without chemogenetic suppression of PV IN activity (CNO i.p. 2×/day; See Supplementary Fig. 5). (D) BS did not increase mEPSC amplitude in control hemispheres (no Gi-DREADD injection). In the injected hemispheres, activation of Gi-DREADD in PV INs during BS increased mEPSC amplitude. *P≤0.001, #P=0.008, ‡P=0.009; One-way ANOVA followed by Holm-Sidak post-hoc test. Blue lines indicate mean±SEM; some data points were displaced horizontally for clarity. Sample size is indicated in parentheses (neurons, subjects).
Secondly, we used viral expression of Gi-coupled DREADD (designer receptor exclusively activated by designer drugs) to reduce the activity of PV INs29. AAV9 encoding cre-dependent Gi-DREADD and mCherry was injected into the left hemisphere of V1 (Layer II/III) in PV-cre mice. As expected, activation of the DREADD via clozapine-N-oxide (CNO) administration (5 mg/kg, i.p.) increased spontaneous activity of pyramidal neurons in Gi-DREADD-infected hemispheres (two-tailed paired t test, t(30)=−4.094, P≤0.001) (Supplementary Fig. 5). We then subjected mice to either 2 days of normal rearing or 2 days of BS, with concurrent CNO delivery to both cohorts (5 mg/kg i.p. 2x/day). mEPSC amplitude was significantly higher in Gi-DREADD expressing hemispheres from BS mice compared to uninjected control hemispheres and control NR mice (One-way ANOVA F(3, 101)=5.359, P=0.002) (Fig. 3C, D). Thus, increasing spontaneous pyramidal neuron spiking by reducing PV-IN activity enables mEPSC amplitude to increase during BS.
Decreased spontaneous activity during DE prevents GluN2B upregulation
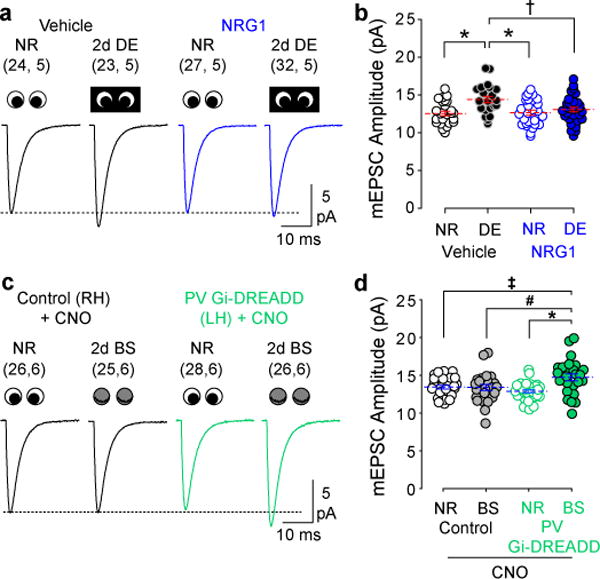
Changes in the composition and function of NMDARs mediates the sliding of the modification threshold for LTP and LTD induction 8,11. DE increases the expression of the GluN2B subunit, and as little as two days of DE is sufficient to induce this change in layer II/III of V1 9,12,39. Since reducing spontaneous activity prevents lowering the synaptic modification threshold during visual deprivation, we asked whether it also prevents the upregulation of GluN2B by DE. The GluN2B component of the evoked (layer IV→II/III) NMDAR current was measured in normally reared and DE mice treated with diazepam or vehicle. As expected 9, two days of DE increased the GluN2B component in controls, evident by an increase in the percentage of NMDA receptor current blocked by the GluN2B-specific antagonist ifenprodil (3μM) (t test: vehicle treated t(36)=2.360, P=0.024; untreated t(35)=2.410, P=0.021), and an increase in the duration of the NMDAR current decay (τw; see Methods) (t test: vehicle treated t(66)=4.277, P≤0.001; untreated t(50)=3.230, P=0.002) (Fig. 4A, Supplementary Fig. 6A; Supplementary Table 3). Diazepam treatment (10 mg/kg, i.p.; 2×/day for 2 days) during DE prevented these changes (Wilcoxon rank sum test: % amplitude blocked U(37)=180.0, P=0.790; decay constant U(67)=488.0, P=0.213) (Fig. 4B, Supplementary Table 3). Similarly, changes in NMDAR composition and function were blocked when diazepam was directly infused into the lateral ventricle via osmotic minipump during DE (2mg/mL, 0.5 μL/hour; see Methods) (t test, vehicle vs. diazepam: %amplitude blocked t(36)=2.145, P=0.039, τw t(54)=2.233, P=0.030) (Supplementary Fig. 6B). These findings support the idea that increased spontaneous activity during DE is necessary to increase GluN2B function.
Figure 4. Spontaneous activity is required for the DE-mediated increase in GluN2B, which in turn is necessary for increased mEPSC amplitude.

(A) DE increased GluN2B function in vehicle-treated animals, revealed by an increase in the percent of NMDA receptor current amplitude blocked by ifenprodil (3μM) and an increase in the weighted NMDA receptor current decay constant (τw; see Methods). Solid lines: average baseline NMDAR current; dashed lines: after ifenprodil. Traces are normalized to baseline. *P=0.024; †P≤0.001, 2-tailed t test. (B) Diazepam treatment during DE prevented the increase in GluN2B function. Solid lines: average baseline NMDAR current; dashed lines: after ifenprodil. Traces are normalized to baseline. (C) The GluN2B-specific antagonist Ro 25-6981 or vehicle was administered via osmotic minipump during NR or DE. Averaged mEPSCs are shown for each group. (D) DE increased the mEPSC amplitude in vehicle-treated mice. Ro 25-6981 treatment prevented this increase. *P=0.003; †P≤0.001, One-way ANOVA followed by Holm-Sidak post-hoc test. Plots of individual data points are displaced horizontally for clarity; dashed lines indicate average (±SEM). Sample size is indicated in parentheses (neurons, mice).
GluN2B blockade during DE prevents the increase in mEPSC amplitude
Our findings indicate that two of the consequences of visual deprivation (lowered threshold for LTP and increased mEPSC amplitude) are dependent on disinhibition and the resultant increase spontaneous activity. The combination of lowered synaptic modification threshold and enhanced spontaneous activity in V1 of DE animals is predicted to strongly favor the induction of LTP. This prompted us to consider the possibility that the increase in mEPSC amplitude observed following DE may reflect an increase in synaptic AMPA receptor levels due to NMDAR-dependent LTP, rather than synaptic scaling. To ask whether GluN2B function is necessary for the DE-mediated increase in mEPSC amplitude, we administered the GluN2B-specific antagonist Ro 25-6981 (30 mg/kg/day s.c. via osmotic minipump) during normal vision and DE. Ro 25-6981 blocked the DE-mediated increase in mEPSC amplitude, and had no effect on mEPSCs in normally reared mice (One-way ANOVA F(3, 100)=8.155, P≤0.001) (Fig. 4C, D; Supplementary Table 4). This suggests that lowering the synaptic modification threshold with DE enables an NMDAR-dependent increase in AMPAR mEPSCs. Importantly, these results also rule out a role for synaptic scaling in increasing mEPSC amplitude during DE, as changes in synaptic strength due to synaptic scaling are independent of NMDAR activation 13.
Extreme reduction of firing rates increases mEPSC amplitude
Our visual deprivation paradigm differs significantly from conditions originally used to describe NMDAR-independent synaptic upscaling, in which action potential generation was completely blocked with tetrodotoxin 13. We therefore hypothesized that an extreme reduction in neuronal firing rates in vivo would modify mEPSC amplitude via synaptic scaling. To test this hypothesis in vivo, we increased tonic inhibition in the cortex by administration of THIP, a potent agonist of extrasynaptic δ-subunit containing GABA receptors 40. THIP administration (10 mg/kg i.p.) strongly reduced spontaneous activity in V1 (Wilcoxon signed rank test Z(15)=3.517, P≤0.001)(Supplementary Fig. 3A), as well as burst frequency (2-tailed paired t test t(15)=9.508, P≤0.001) and non-burst firing rate (Wilcoxon signed rank test Z(15)=−3.516, P≤0.001) (Supplementary Fig. 3C, D). Importantly, THIP reduced spontaneous activity to a significantly greater extent than did diazepam (Fig. 5A) (Diazepam: 70.0±7.3% of baseline; THIP: 26±3.0%; U(44)=22.0, P≤0.001, Wilcoxon rank sum test). This extreme reduction in activity was accompanied by an increase in mEPSC amplitude in both normally reared and DE animals (One-way ANOVA F(3, 116)=13.991, P≤0.001) (Fig. 5B,C). Furthermore, THIP produced a larger increase in mEPSC amplitude in DE than in normal reared controls (Holm-Sidak post-hoc P≤0.001) (Fig. 5B, C; Supplementary Table 5). These results are in accordance with the predictions of the synaptic scaling model of homeostatic plasticity.
Figure 5. Synaptic scaling is engaged by extreme reductions in neuronal activity.
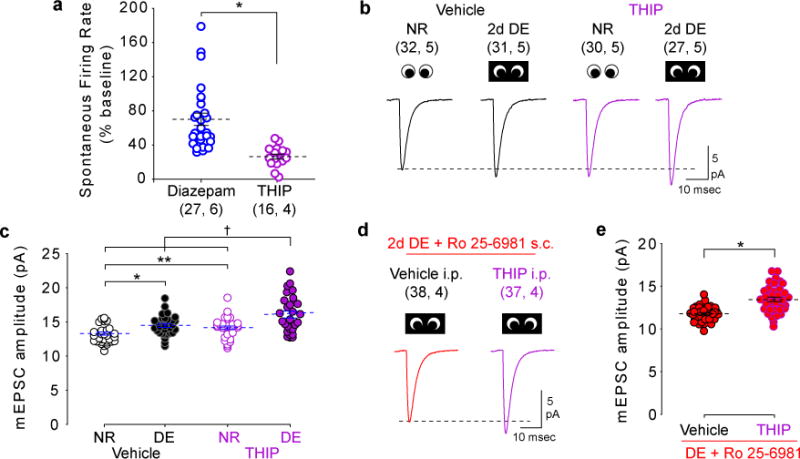
(A) THIP induced a larger decrease in spontaneous firing than diazepam (Diazepam: 70.0±7.3%; THIP: 26.2±3.0% of baseline). *P≤0.001, 2-tailed Wilcoxon rank sum test. (B) Average mEPSC waveforms from NR and DE mice treated with vehicle or THIP. (C) Compared to vehicle, THIP increased mEPSC amplitude in NR controls. THIP during DE further increased mEPSC amplitude over DE or THIP alone. *P=0.002; **P=0.017; †P≤0.001, One-way ANOVA followed by Holm-Sidak post-hoc test. (D) Average mEPSC waveforms from DE mice treated with Ro 25-6981 with and without THIP. (E) Ro 25-6981 did not prevent THIP-induced upscaling of mEPSC amplitude. *P≤0.001, 2-tailed t test. Dashed lines indicate mean (±SEM). Some data points have been displaced horizontally for clarity. Sample size is indicated in parentheses (neurons, mice).
Together, this suggests that there are two distinct mechanisms of homeostatic plasticity in vivo which depend on the magnitude of the change in neuronal spike rate: moderate changes in firing rates engage the sliding threshold and subsequent NMDAR-dependent plasticity, whereas more extreme reductions engage homeostatic synaptic scaling. As an additional test of this hypothesis, we tested whether THIP-induced scaling was NMDAR independent. DE mice were treated with Ro 25-6981 to block GluN2B-containing NMDARs, and administered THIP (or vehicle) to induce an extreme reduction in spike rate. Blocking GluN2B receptors with Ro 25-6981 did not prevent the increase in mEPSC amplitude induced by THIP (t test t(73)=5.591, P≤0.001) (Fig. 5D, E). Therefore, in contrast to the increase in mEPSC amplitude induced by DE, the increase in mEPSC amplitude observed following extreme reductions in neural activity by THIP is independent of GluN2B activity. Thus, two distinct mechanisms for experience-dependent homeostatic plasticity co-exist in vivo and are engaged by different magnitudes of firing rate reduction (Fig. 6).
Figure 6. Model depicting two distinct mechanisms that increase mEPSC amplitude in response to decreased neuronal activity.

When neuronal activity varies within the normal physiological range, such as during DE, the change in temporal activity patterns (evoked spikes: red; spontaneous: blue) increase the expression of GluN2B and slide the plasticity threshold to favor LTP. After the threshold is lowered, spontaneous activity is sufficient to induce LTP, causing synaptic AMPA receptor insertion and increased mEPSC amplitude. In contrast, when neuronal activity is near zero, the neuron cannot engage Hebbian plasticity mechanisms (purple box). In this case synaptic scaling mechanisms increase mEPSC amplitude.
Discussion
Visual deprivation via DE reduces evoked activity in the visual cortex and triggers a compensatory increase in excitatory synapses. This homeostatic change is predicted by the sliding modification threshold and synaptic scaling models3,4, which also predict that an additional reduction of activity would promote additional homeostatic compensation in synaptic function. In contrast, we found that reducing the spontaneous activity of pyramidal neurons (by enhancing inhibition) during DE prevents rather than enhances further compensatory changes. Moreover, increasing spontaneous pyramidal neuron activity (by decreasing inhibition) during a milder form of visual deprivation (BS) lowers the synaptic modification threshold for LTP and increases mEPSC amplitude. In sum, our manipulations of visual input combined with manipulations of spontaneous neuronal activity reveal that: 1) changes in overall neuronal firing rate alone are not sufficient to mediate the modification threshold for LTP/D nor increase mEPSC amplitude observed after visual deprivation, 2) changes in mEPSC amplitude induced by visual deprivation reflect Hebbian potentiation of excitatory synapses enabled by the reduced synaptic modification threshold, and 3) changes in mEPSC amplitude induced by extreme reductions in neuronal activity reflect NMDAR-independent synaptic scaling. Thus the two mechanisms of synaptic homeostasis, the sliding synaptic modification threshold and synaptic scaling, operate within different ranges of activity, and changes in the spiking output of pyramidal neurons, previously thought to be a consequence of metaplasticity, are a necessary component of the induction process.
The exact changes in neural activity that slide the LTP/D threshold remain to be determined. Our data show that it is not simply the overall spike rate. Rather, an increase in spontaneous activity (including bursting) in conjunction with reduced visual input is better correlated with a lowered LTP threshold. As mentioned, DE completely eliminates visual input and rapidly increases spontaneous activity in V1 20,29, likely due to a decrease in the output of GABAergic interneurons 19,28–30,41 or increased intrinsic excitability 42. However, it is unclear how pyramidal neurons could monitor a balance of visual input and spontaneous activity. An attractive possibility is that correlated pre- and postsynaptic firing, which is more frequent during evoked activity, is detected as NMDAR activation to affect the synaptic content of GluN2b43 and the threshold for the synaptic modification. Concomitantly, overall spike rate (or AMPA receptor activation 24) may be monitored to detect extreme decreases in activity and regulate NMDAR-independent synaptic scaling. Finally, we note that in order to manipulate activity we targeted synaptic inhibition. However, changes in GABAA conductance per se are unlikely to directly mediate homeostasis of glutamatergic transmission, as there are no known mechanisms to translate Cl− flow into intracellular signaling cascades. In contrast, intracellular signaling cascades activated by Ca+2 influx in response to neuronal spiking and activation of glutamatergic synapses are well-documented.
We propose that increased mEPSC amplitude following DE is due to NMDAR-dependent potentiation of synaptic strength induced by increased spontaneous activity and reduced LTP threshold, rather than synaptic scaling. Although the fact that mEPSC amplitude after DE increases in a multiplicative manner has been interpreted as scaling of all synapses by the same factor, this may not be the case; sizes of individual spines have been observed to remain unchanged or decrease, even when spine size increases multiplicatively on a population level20,25. Furthermore, the increase in mEPSC amplitude after DE has been found to be non-multiplicative in some cases, such as in 3-month old mice 14 . Although non-homogeneous synaptic changes could also result from local scaling (see 44), NMDAR-dependent potentiation is better suited to explain the circuit-level changes that occur during DE. DE increases the strength of synaptic inputs between highly spontaneously active layer II/III pyramidal neurons, but not the inputs from less spontaneously active layer IV neurons to layer II/III 45. This observation is incompatible with the synaptic scaling model, as layer IV neurons are less spontaneously active and therefore predicted to be more strongly impacted by DE. Many other forms of deprivation, including intraocular TTX, enucleation, lid suture, retinal lesion, and monocular deprivation have been reported to upregulate mEPSC amplitude via synaptic scaling 15,18–20,46,47. It will be important to determine if Hebbian plasticity enabled by a reduced synaptic modification threshold and enhanced spontaneous activity also plays a role in these cases. Indeed, metaplasticity has been used to explain the strengthening of non-deprived eye responses observed after prolonged monocular deprivation36, and Hebbian plasticity can explain input-specific upscaling in the deprived optic tectum 48.
Finally, we confirm that NMDAR-independent synaptic scaling can be recruited, but by manipulations that reduce neuronal activity more severely than sensory deprivation. Together, these findings support a model in which two distinct mechanisms for homeostatic regulation of excitatory synaptic strength co-exist in vivo. When cortical activity varies within the normal physiological range, homeostatic changes are mediated by the sliding the synaptic modification threshold for LTP/LTD. When cortical activity is reduced beyond the normal physiological range, homeostatic changes are mediated by synaptic scaling. The existence of two homeostatic mechanisms may be necessary because at very low levels of activity, neurons are unable to undergo Hebbian plasticity and are therefore unable to utilize the sliding threshold mechanism 4,5 (Fig. 6). The co-existence of distinct homeostatic mechanisms operating at distinct dynamic ranges of activity resonates with the hypothesized necessity of regulation at different timescales 49,50, and argues that neural homeostasis is achieved through multiple complementary mechanisms.
Methods
Animals
C57BL/6 and PV-cre mice, equal numbers of males and females, were raised (5 or fewer per cage) on a 12:12 light:dark cycle, with food and water ad libitum. All procedures conform to the guidelines of the U.S. Department of Health and Human Services Office of Laboratory Animal Welfare (OLAW) and were approved by the Institutional Animal Care and Use Committees of the University of Maryland and/or Johns Hopkins University. Sample sizes were chosen to correspond with previous studies in which the effects of visual manipulation were measured. For each experiment, animals within a litter were randomly distributed across groups. See Life Sciences Reporting Summary for details.
Visual manipulations
Naïve mice were deprived of vision for 2 days beginning at postnatal day 24-30. Mice were age-matched across groups. Dark exposed animals were placed in a light-tight dark room. Animal care and drug administration was performed under infrared illumination. Binocular lid suture was performed under isoflurane anesthesia. The margins of the upper and lower lids of both eyes were trimmed and sutured together. Animals were disqualified in the event of suture opening or infection.
Intraperitoneal Drug Administration
Diazepam (10 mg/kg) (Sigma-Aldrich, St. Louis, MO) and Flumazenil (10 mg/kg) (Tocris Bioscience, Bristol, UK) were dissolved in 10% Tween 80, 20% DMSO and 70% saline. THIP (10 mg/kg) (Tocris) and NRG1 (10 ng/kg) were dissolved in saline. CNO (5mg/kg) (Enzo Life Sciences, Farmingdale, NY) was dissolved in 5% DMSO and 95% saline. Each drug or its vehicle was administered twice daily i.p.
Minipump drug administration
Subjects receiving intracerebroventricular diazepam infusions were implanted with osmotic minipumps (Alzet 1007D, Durect Corp., Cupertino, CA) filled with diazepam (2mg/mL) or vehicle (50% propylene glycol, 50% saline) and a 30-gauge cannula was attached. The pump/cannula assembly was primed in 0.9% NaCl at 37°C. Animals were anesthetized with isoflurane, and the minipump was implanted subcutaneously. The tip of the attached cannula was placed in the left lateral ventricle and the assembly was affixed using dental cement. For mice receiving Ro 25-6981(Cayman Chemical, Ann Arbor, MI) infusions (due to its relatively short half-life in vivo 33,51), minipumps were filled with the concentration required to deliver 30 mg/kg/day, dissolved in 20%DMSO/80% saline, and implanted subcutaneously without an attached cannula. Meloxicam (5mg/kg, s.c.) was administered postoperatively to all animals to prevent inflammation and pain.
Viral injection
Viral injections were conducted under isoflurane anesthesia. V1 was located in the left hemisphere using stereotaxic coordinates (3.6 mm posterior, 2.5 mm lateral to bregma) and a craniotomy (~0.5 mm) was made. AAV9-DREADDGi-mCherry virus (300 μL; 6.40 ×10¹² units/mL) (University of North Carolina vector core) was injected into layer II/III (0.3 mm from the cortical surface) 3 weeks prior to experimentation.
Slice electrophysiology
Visual cortical slices were prepared as previously described9. Slices 300 μm thick were cut in ice-cold dissection buffer containing (in mM): 212.7 sucrose, 5 KCl, 1.25 NaH2PO4, 10 MgCl2, 0.5 CaCl2, 26 NaHCO3, 10 dextrose, bubbled with 95% O2/5% CO2 (pH 7.4). Slices were transferred to artificial cerebrospinal fluid (ACSF) and incubated at 30°C for 30 minutes, then at room temperature for at least 30 minutes prior to recording. ACSF was similar to dissection buffer except that sucrose was replaced by 124 mM NaCl, MgCl2 was lowered to 1 mM, and CaCl2 was raised to 2 mM. Visualized whole-cell recordings were made from pyramidal neurons in V1 layer II/III with glass pipettes (3-6 MΩ). Both binocular and monocular V1 were recorded. Data were filtered at 2 kHz and digitized at 5-10 kHz using Igor Pro (WaveMetrics Inc., Lake Oswego, OR). Cells were excluded if input or series resistance changed >20%.
LTP and LTD
LTP and LTD recordings were performed with an intracellular solution containing (in mM) 130 (K)Gluconate, 10 KCl, 0.2 EGTA, 10 HEPES, 4 (Mg)ATP, 0.5 (Na)GTP, and 10 (Na) Phosphocreatine (pH adjusted to 7.25 with KOH, 280–290 mOsm). Synaptic responses (4-6 mV) were evoked every 20 s by stimulating layer IV with 0.2 ms pulses delivered through two concentric bipolar stimulating electrodes (125 μm diameter; FHC, Bowdoin, ME) placed ~900 μm apart in the middle of the cortical thickness. Synaptic strength was quantified as the initial (first 2 ms) slope of the EPSP and averaged over 30 consecutive sweeps. To induce plasticity, the recording mode was switched to voltage clamp. Pairing consisted of 150 epochs during which Vh was alternated between the two target values (666 msec for each value). Only cells with membrane potentials more negative than −65 mV, series resistance < 20 MΩ, and input resistance larger than 100 MΩ, and a stable baseline(less than 5% drift over 10 minutes) were considered in the analysis. The magnitude of plasticity was taken as the average of the last 10 min of recording, beginning 20 min after conditioning stimulation.
Miniature EPSC recordings
Miniature EPSC recordings were performed with an intracellular solution containing (in mM): 130 Cs-gluconate, 8 KCl, 1 EGTA, 10 HEPES, 4 (Na)ATP, 5 QX-314 (pH adjusted to 7.25 with CsOH, 280-290 mOsm) under voltage clamp (Vh: −70 mV). 1 μM TTX, 100μM APV and 10 μM picrotoxin were included in the bath. Events were detected and analyzed using Mini Analysis (Synaptosoft, Decatur, GA). Only neurons with root mean square (RMS) of membrane current noise < 2, input resistance >200MΩ, and series resistance <20 MΩ were included in the analysis. The threshold for mini detection was set at three times the RMS noise. The first 300 non-overlapping events with rise times ≤ 3 ms were used to estimate the mEPSC amplitude distribution and produce the average mEPSC for that neuron. Neurons with a negative correlation between mEPSC amplitude and rise time were excluded. mEPSCs from mice infused with diazepam i.c.v. were recorded using the same internal pipette solution used for LTP/LTD recordings.
NMDA receptor current recordings
NMDA receptor currents were recorded using an internal pipette solution containing (in mM): 102 Cs-gluconate, 5 TEA-chloride, 3.7 NaCl, 20 HEPES, 0.3 (Na)GTP, 4 (Mg)ATP, 0.2 EGTA, 10 BAPTA, 5 QX-314 (pH 7.2, ~300 mOsm) under voltage clamp (Vh=+40 mV). To isolate NMDA receptor currents and minimize multisynaptic responses, ACSF in the recording chamber contained 2.5 μM gabazine, 25μM CNQX, 1μM glycine, 4mM CaCl2, and 4mM MgCl2. A stimulating electrode was placed in the middle of the cortical thickness and used to evoke responses of at least 100 pA. Slices were stimulated every 15 seconds until a stable baseline of 30 consecutive responses was obtained. Ifenprodil (3μM; Tocris) was then delivered to the recording chamber. After a new stable amplitude was reached, 30 consecutive responses were recorded. The average peak amplitude was compared before and after ifenprodil. Baseline sweeps free of noise were averaged and NMDA receptor deactivation kinetics were measured by fitting a double exponential function to the current decay (Igor Pro). For quantification, we calculated the weighted decay constant, τw, as: τw=τf(If/(If+Is))+τs(Is/(If+Is)) 9,52.
Single Unit Recording and Analysis
House-made 16-channel laminar arrays were constructed and implanted as previously described 53. Briefly, a 1.2 mm 16-channel platinum-iridium electrode shank (15 - 20 kΩ) with head post was implanted into the binocular region of V1 (3.00 mm lateral to the midline/0.01 mm rostral to lambda) to a depth of 1 mm, to center the electrode shank on vertical center of cortex. For implantation, naïve adult mice were anesthetized in 3% isoflurane in 100% O2. Mice received post-surgical buprenorphine (0.1 mg/kg) after return of the righting reflex, and allowed 3-4 days to recover from surgery. One day prior to recording, subjects were habituated to the head restraint for 45 min. Single units were acquired over a period of 200 seconds while the animals passively viewed a blank screen. After baseline recording, mice were maintained for 3 days in a light-tight dark room (DE) where care was provided under infrared light, or underwent BS (under 3% isoflurane in O2). Following the deprivation period, spontaneous unit activity was recorded again. Subjects then received 6 days of normal binocular vision to return spontaneous activity to baseline values, followed by a second period of DE or BS. During the second period of visual deprivation, DE mice received once daily injections of 15mg/kg diazepam i.p. (Sigma). An additional group of naïve mice underwent DE plus diazepam treatment without previous manipulations of visual experience (Supplementary Fig. 1). BS mice received twice daily i.p. injections of 10mg/kg flumazenil (Tocris). Both drugs were dissolved in 70% sterile saline, 20% DMSO, and 10% Tween-80. The final recording was performed 12 hours after the last drug injection. To assess the acute effects of the drugs (Supplementary Fig. 3), an additional group of mice received normal vision and underwent baseline recording of spontaneous unit activity. Animals were then injected i.p. with vehicle, diazepam, flumazenil, or THIP (10 mg/kg) and spontaneous activity was measured 20 minutes later. Single unit recordings in anesthetized subjects (Supplementary Fig. 3B) were made as described above as above, with isoflurane (~1% in 100% O2 delivered via modified nose cone).
Multiunit waveforms (isolated with 300 Hz high pass and 5 kHz low pass filters, identified via -4.5 standard deviation threshold) and local field potentials (isolated with 300 Hz low pass filter and 60 Hz notch-filter) were collected using a RZ5 bioamp processor and RA16PA preamp (Tucker Davis Technologies, TDT). Multiunit activity was sorted into single units using an automatic Bayesian clustering algorithm in OpenSorter (TDT) using Mahalanobis distance, distance isolation, and L-ratio as measures of cluster isolation and quality. Single units were then analyzed using custom MATLAB routines (Lantz, CL, 2017) and classified as regular spiking (presumptive pyramidal neurons) based on three parameters: slope of the waveform 0.5 msec after the trough, time elapsed between the trough and peak, and the ratio of trough to peak height54. Regular spiking units were defined by low peak to trough ratio, long duration, and small end slope. Fast spiking units were defined by high peak to trough ratio, short duration and negative end slope. Only regular spiking units were included in analysis; however, we cannot exclude the possibility that multiple regular spiking cell types were recorded. Signals acquired from a specific electrode across different days of chronic in vivo single unit recordings were not assumed to be the same unit, and therefore non-paired statistical tests were used to compare single unit firing at different experimental time points. Burst analysis by the mean inter-spike interval method 55 was conducted using custom MATLAB routines.
Statistical Analysis
Normality was determined using the d’Agostino test and variance was compared using Levene’s median test. Groups with normally distributed data were compared using 2-tailed paired or unpaired t tests, one-way ANOVAs, or one-way repeated measures ANOVAs, as indicated. Holm-Sidak post-hoc tests were used for multiple comparisons following one-way ANOVAs. Groups that were not normally distributed were compared using nonparametric Wilcoxon rank sum/signed rank tests or ANOVAs on ranks (followed by Dunn’s post-hoc test for multiple comparisons) (SigmaPlot, Systat Software, Inc, San Jose, CA). Statistical outliers were detected using pre-established criteria (ROUT test) and excluded from analysis.
Supplementary Material
Acknowledgments
Research reported in this article was supported by the National Eye Institute of the National Institutes of Health under award number R01EY012124 (to A.K.), R01EY016431 (to E.Q.) and R01EY025922 (to E.Q, A.K. and H.-K. L.). M.C.D.B was supported by grants T32EY00714 and T32HL110952.
Footnotes
Data Availability. Raw data used to produce Figures 1–5 and S1–S6 are available upon reasonable request to the corresponding authors.
Code Availability. Custom codes are available upon reasonable request to the corresponding author.
Author Contributions: M.C.D.B., R.d.P, T.T., K.H., and S.Z.H. collected slice electrophysiology data. M.C.D.B. and R.d.P. analyzed slice electrophysiology data. S-Y.C. provided initial data for the inception of the project. C.L.,Y.G. and A.B. collected and analyzed the in vivo unit recording data. A.D. and H.-K. L. provided code for analysis of single unit firing properties. M.C.D.B., E.Q. and A.K. wrote the manuscript.
Competing Financial Interests: The authors have no competing financial interests.
References
- 1.Marder E, O’Leary T, Shruti S. Neuromodulation of circuits with variable parameters: single neurons and small circuits reveal principles of state-dependent and robust neuromodulation. Annu Rev Neurosci. 2014;37:329–46. doi: 10.1146/annurev-neuro-071013-013958. [DOI] [PubMed] [Google Scholar]
- 2.Davis GW. Homeostatic control of neural activity: From phenomenology to molecular design. Annu Rev Neurosci. 2006;29:307–323. doi: 10.1146/annurev.neuro.28.061604.135751. [DOI] [PubMed] [Google Scholar]
- 3.Turrigiano GG. The self-tuning neuron: Synaptic scaling of excitatory synapses. Cell. 2008;135:422–435. doi: 10.1016/j.cell.2008.10.008. [DOI] [PMC free article] [PubMed] [Google Scholar]
- 4.Cooper LN, Bear MF. The BCM theory of synapse modification at 30: Interaction of theory with experiment. Nat Rev Neurosci. 2012;13:798–810. doi: 10.1038/nrn3353. [DOI] [PubMed] [Google Scholar]
- 5.Abraham WC, Bear MF. Metaplasticity: The plasticity of synaptic plasticity. Trends Neurosci. 1996;19:126–130. doi: 10.1016/s0166-2236(96)80018-x. [DOI] [PubMed] [Google Scholar]
- 6.Abraham WC. Metaplasticity: Tuning synapses and networks for plasticity. Nat Rev Neurosci. 2008;9:387–99. doi: 10.1038/nrn2356. [DOI] [PubMed] [Google Scholar]
- 7.Kirkwood A, Rioult MG, Bear MF. Experience-dependent modification of synaptic plasticity in visual cortex. Nature. 1996;381:526–528. doi: 10.1038/381526a0. [DOI] [PubMed] [Google Scholar]
- 8.Philpot BD, Espinosa JS, Bear MF. Evidence for altered NMDA receptor function as a basis for metaplasticity in visual cortex. J Neurosci. 2003;23:5583–5588. doi: 10.1523/JNEUROSCI.23-13-05583.2003. [DOI] [PMC free article] [PubMed] [Google Scholar]
- 9.Guo Y, et al. Dark exposure extends the integration window for spike-timing-dependent plasticity. J Neurosci. 2012;32:15027–35. doi: 10.1523/JNEUROSCI.2545-12.2012. [DOI] [PMC free article] [PubMed] [Google Scholar]
- 10.Philpot BD, Sekhar AK, Shouval HZ, Bear MF. Visual experience and deprivation bidirectionally modify the composition and function of NMDA receptors in visual cortex. Neuron. 2001;29:157–169. doi: 10.1016/s0896-6273(01)00187-8. [DOI] [PubMed] [Google Scholar]
- 11.Chen WS, Bear MF. Activity-dependent regulation of NR2B translation contributes to metaplasticity in mouse visual cortex. Neuropharmacology. 2007;52:200–214. doi: 10.1016/j.neuropharm.2006.07.003. [DOI] [PubMed] [Google Scholar]
- 12.He HY, Hodos W, Quinlan EM. Visual deprivation reactivates rapid ocular dominance plasticity in adult visual cortex. J Neurosci. 2006;26:2951–2955. doi: 10.1523/JNEUROSCI.5554-05.2006. [DOI] [PMC free article] [PubMed] [Google Scholar]
- 13.Turrigiano GG, Leslie KR, Desai NS, Rutherford LC, Nelson SB. Activity-dependent scaling of quantal amplitude in neocortical neurons. Nature. 1998;391:892–896. doi: 10.1038/36103. [DOI] [PubMed] [Google Scholar]
- 14.Goel A, Lee H. Persistence of experience-induced homeostatic synaptic plasticity through adulthood in superficial layers of mouse visual cortex. J Neurosci. 2007;27:6692–6700. doi: 10.1523/JNEUROSCI.5038-06.2007. [DOI] [PMC free article] [PubMed] [Google Scholar]
- 15.He K, Petrus E, Gammon N, Lee HK. Distinct sensory requirements for unimodal and cross-modal homeostatic synaptic plasticity. J Neurosci. 2012;32:8469–74. doi: 10.1523/JNEUROSCI.1424-12.2012. [DOI] [PMC free article] [PubMed] [Google Scholar]
- 16.Gao M, et al. A specific requirement of Arc/Arg3.1 for visual experience-induced homeostatic synaptic plasticity in mouse primary visual cortex. J Neurosci. 2010;30:7168–78. doi: 10.1523/JNEUROSCI.1067-10.2010. [DOI] [PMC free article] [PubMed] [Google Scholar]
- 17.Goel A, et al. Phosphorylation of AMPA receptors is required for sensory deprivation-induced homeostatic synaptic plasticity. PLoS One. 2011;6:e18264. doi: 10.1371/journal.pone.0018264. [DOI] [PMC free article] [PubMed] [Google Scholar]
- 18.Desai NS, Cudmore RH, Nelson SB, Turrigiano GG. Critical periods for experience-dependent synaptic scaling in visual cortex. Nat Neurosci. 2002;5:783–9. doi: 10.1038/nn878. [DOI] [PubMed] [Google Scholar]
- 19.Hengen KB, Lambo ME, VanHooser SD, Katz DB, Turrigiano GG. Firing rate homeostasis in visual cortex of freely behaving rodents. Neuron. 2013;80:335–342. doi: 10.1016/j.neuron.2013.08.038. [DOI] [PMC free article] [PubMed] [Google Scholar]
- 20.Keck T, et al. Synaptic scaling and homeostatic plasticity in the mouse visual cortex in vivo. Neuron. 2013;80:327–334. doi: 10.1016/j.neuron.2013.08.018. [DOI] [PubMed] [Google Scholar]
- 21.Kotak VC, et al. Hearing loss raises excitability in the auditory cortex. J Neurosci. 2005;25:3908–3918. doi: 10.1523/JNEUROSCI.5169-04.2005. [DOI] [PMC free article] [PubMed] [Google Scholar]
- 22.Glazewski S, Greenhill S, Fox K. Time-course and mechanisms of homeostatic plasticity in layers 2/3 and 5 of the barrel cortex. Philos Trans R Soc B Biol Sci. 2017;372:20160150. doi: 10.1098/rstb.2016.0150. [DOI] [PMC free article] [PubMed] [Google Scholar]
- 23.Greenhill SD, Ranson A, Fox K. Hebbian and Homeostatic Plasticity Mechanisms in Regular Spiking and Intrinsic Bursting Cells of Cortical Layer 5. Neuron. 2015;88:539–552. doi: 10.1016/j.neuron.2015.09.025. [DOI] [PMC free article] [PubMed] [Google Scholar]
- 24.Fong M, Newman JP, Potter SM, Wenner P. Upward synaptic scaling is dependent on neurotransmission rather than spiking. Nat Commun. 2015;6:6339. doi: 10.1038/ncomms7339. [DOI] [PMC free article] [PubMed] [Google Scholar]
- 25.Barnes SJ, et al. Deprivation-induced Homeostatic spine scaling in vivo is localized to dendritic branches that have undergone recent spine loss. Neuron. 2017;96:871–882. doi: 10.1016/j.neuron.2017.09.052. [DOI] [PMC free article] [PubMed] [Google Scholar]
- 26.Gianfranceschi L, et al. Visual cortex is rescued from the effects of dark rearing by overexpression of BDNF. Proc Natl Acad Sci U S A. 2003;100:12486–12491. doi: 10.1073/pnas.1934836100. [DOI] [PMC free article] [PubMed] [Google Scholar]
- 27.Benevento LA, Bakkum BW, Port JD, Cohen RS. The effects of dark-rearing on the electrophysiology of the rat visual cortex. Brain Res. 1992;572:198–207. doi: 10.1016/0006-8993(92)90470-t. [DOI] [PubMed] [Google Scholar]
- 28.Gu Y, et al. Neuregulin-dependent regulation of fast-spiking interneuron excitability controls the timing of the critical period. J Neurosci. 2016;36:10285–10295. doi: 10.1523/JNEUROSCI.4242-15.2016. [DOI] [PMC free article] [PubMed] [Google Scholar]
- 29.Kuhlman SJ, et al. A disinhibitory microcircuit initiates critical-period plasticity in the visual cortex. Nature. 2013;501:543–6. doi: 10.1038/nature12485. [DOI] [PMC free article] [PubMed] [Google Scholar]
- 30.Huang S, Hokenson K, Bandyopadhyay S, Russek SJ, Kirkwood A. Brief dark exposure reduces tonic inhibition in visual cortex. J Neurosci. 2015;35:15916–15920. doi: 10.1523/JNEUROSCI.1813-15.2015. [DOI] [PMC free article] [PubMed] [Google Scholar]
- 31.Hensch TK, et al. Local GABA circuit control of experience-dependent plasticity in developing visual cortex. Science (80-) 1998;282:1504–1508. doi: 10.1126/science.282.5393.1504. [DOI] [PMC free article] [PubMed] [Google Scholar]
- 32.Gu Y, et al. Obligatory role for the immediate early gene NARP in critical period plasticity. Neuron. 2013;79:335–346. doi: 10.1016/j.neuron.2013.05.016. [DOI] [PMC free article] [PubMed] [Google Scholar]
- 33.Greenblatt DJ, Sethy VH. Benzodiazepine concentrations in brain directly reflect receptor occupancy: studies of diazepam, lorazepam, and oxazepam. Psychopharmacology (Berl) 1990;102:373–378. doi: 10.1007/BF02244106. [DOI] [PubMed] [Google Scholar]
- 34.Rittenhouse CD, et al. Stimulus for rapid ocular dominance plasticity in visual cortex. J Neurophysiol. 2006;95:2947–2950. doi: 10.1152/jn.01328.2005. [DOI] [PubMed] [Google Scholar]
- 35.Rittenhouse CD, Shouval HZ, Paradiso MA, Bear MF. Monocular deprivation induces homosynaptic long-term depression in visual cortex. Nature. 1999;397:347–350. doi: 10.1038/16922. [DOI] [PubMed] [Google Scholar]
- 36.Frenkel MY, Bear MF. How monocular deprivation shifts ocular dominance in visual cortex of young mice. Neuron. 2004;44:917–923. doi: 10.1016/j.neuron.2004.12.003. [DOI] [PubMed] [Google Scholar]
- 37.Christian CA, et al. Endogenous positive allosteric modulation of GABAA receptors by diazepam binding inhibitor. Neuron. 2013;78:1063–1074. doi: 10.1016/j.neuron.2013.04.026. [DOI] [PMC free article] [PubMed] [Google Scholar]
- 38.Wen L, et al. Neuregulin 1 regulates pyramidal neuron activity via ErbB4 in parvalbumin-positive interneurons. Proc Natl Acad Sci U S A. 2010;107:1211–6. doi: 10.1073/pnas.0910302107. [DOI] [PMC free article] [PubMed] [Google Scholar]
- 39.Cho KKA, Khibnik L, Philpot BD, Bear MF. The ratio of NR2A/B NMDA receptor subunits determines the qualities of ocular dominance plasticity in visual cortex. Proc Natl Acad Sci U S A. 2009;106:5377–82. doi: 10.1073/pnas.0808104106. [DOI] [PMC free article] [PubMed] [Google Scholar]
- 40.Drasbek KR, Jensen K. THIP, a hypnotic and antinociceptive drug, enhances an extrasynaptic GABAA receptor-mediated conductance in mouse neocortex. Cereb Cortex. 2006;16:1134–1141. doi: 10.1093/cercor/bhj055. [DOI] [PubMed] [Google Scholar]
- 41.Sun Y, et al. Neuregulin-1/ErbB4 Signaling Regulates Visual Cortical Plasticity. Neuron. 2016;92:160–173. doi: 10.1016/j.neuron.2016.08.033. [DOI] [PMC free article] [PubMed] [Google Scholar]
- 42.Pratt KG, Aizenman CD. Homeostatic regulation of intrinsic excitability and synaptic transmission in a developing visual circuit. J Neurosci. 2007;27:8268–8277. doi: 10.1523/JNEUROSCI.1738-07.2007. [DOI] [PMC free article] [PubMed] [Google Scholar]
- 43.Gambrill AC, Storey GP, Barria A. Dynamic regulation of NMDA receptor transmission. J Neurophysiol. 2011;105:162–171. doi: 10.1152/jn.00457.2010. [DOI] [PMC free article] [PubMed] [Google Scholar]
- 44.Lee KFH, Soares C, Béïque JC. Tuning into diversity of homeostatic synaptic plasticity. Neuropharmacology. 2014;78:31–37. doi: 10.1016/j.neuropharm.2013.03.016. [DOI] [PubMed] [Google Scholar]
- 45.Petrus E, et al. Vision loss shifts the balance of feedforward and intracortical circuits in opposite directions in mouse primary auditory and visual cortices. J Neurosci. 2015;35:8790–8801. doi: 10.1523/JNEUROSCI.4975-14.2015. [DOI] [PMC free article] [PubMed] [Google Scholar]
- 46.Kaneko M, Stellwagen D, Malenka RC, Stryker MP. Tumor Necrosis Factor-a mediates one component of competitive, experience-dependent plasticity in developing visual cortex. Neuron. 2008;58:673–680. doi: 10.1016/j.neuron.2008.04.023. [DOI] [PMC free article] [PubMed] [Google Scholar]
- 47.Ranson A, Cheetham CEJ, Fox K, Sengpiel F. Homeostatic plasticity mechanisms are required for juvenile, but not adult, ocular dominance plasticity. Proc Natl Acad Sci U S A. 2012;109:1311–1316. doi: 10.1073/pnas.1112204109. [DOI] [PMC free article] [PubMed] [Google Scholar]
- 48.Deeg KE, Aizenman CD. Sensory modality-specific homeostatic plasticity in the developing optic tectum. Nat Neurosci. 2011;14:548–50. doi: 10.1038/nn.2772. [DOI] [PMC free article] [PubMed] [Google Scholar]
- 49.Frémaux N, Gerstner W. Neuromodulated spike-timing-dependent plasticity, and theory of three-factor learning rules. Front Neural Circuits. 2016;9:1–19. doi: 10.3389/fncir.2015.00085. [DOI] [PMC free article] [PubMed] [Google Scholar]
- 50.Zenke F, Agnes EJ, Gerstner W. Diverse synaptic plasticity mechanisms orchestrated to form and retrieve memories in spiking neural networks. Nat Commun. 2015;6:6922. doi: 10.1038/ncomms7922. [DOI] [PMC free article] [PubMed] [Google Scholar]
- 51.Tallaksen-Greene SJ, Janiszewska A, Benton K, Ruprecht L, Albin RL. Lack of efficacy of NMDA receptor-NR2B selective antagonists in the R6/2 model of Huntington disease. Exp Neurol. 2010;225:402–407. doi: 10.1016/j.expneurol.2010.07.015. [DOI] [PMC free article] [PubMed] [Google Scholar]
- 52.Rumbaugh G, Vicini S. Distinct synaptic and extrasynaptic NMDA receptors in developing cerebellar granule neurons. J Neurosci. 1999;19:10603–10610. doi: 10.1523/JNEUROSCI.19-24-10603.1999. [DOI] [PMC free article] [PubMed] [Google Scholar]
- 53.Murase S, et al. Matrix metalloproteinase-9 regulates neuronal circuit development and excitability. Mol Neurobiol. 2016;53:3477–93. doi: 10.1007/s12035-015-9295-y. [DOI] [PMC free article] [PubMed] [Google Scholar]
- 54.Niell CM, Stryker MP. Highly selective receptive fields in mouse visual cortex. J Neurosci. 2008;28:7520–7536. doi: 10.1523/JNEUROSCI.0623-08.2008. [DOI] [PMC free article] [PubMed] [Google Scholar]
- 55.Chen L, Deng Y, Luo W, Wang Z, Zeng S. Detection of bursts in neuronal spike trains by the mean inter-spike interval method. Prog Nat Sci. 2009;19:229–235. [Google Scholar]
Associated Data
This section collects any data citations, data availability statements, or supplementary materials included in this article.