


Abstract
The molecular recognition and discrimination of adenine and guanine ligand moieties in complexes with proteins have been studied using empirical observations on carefully selected crystal structures. The distribution of protein folds that bind these purines has been found to differ significantly from that across the whole PDB, but the most populated architectures and folds are also the most common in three genomes from the three different domains of life. The protein environments around the two nucleic acid bases were significantly different, in terms of the propensities of amino acid residues to be in the binding site, as well as their propensities to form hydrogen bonds to the bases. Plots of the distribution of protein atoms around the two purines clearly show different clustering of hydrogen bond donors and acceptors opposite complimentary acceptors and donors in the rings, with hydrophobic areas below and above the rings. However, the clustering pattern is fuzzy, reflecting the variety of ways that proteins have evolved to recognise the same molecular moiety. Furthermore, an analysis of the conservation of residues in the protein chains binding guanine shows that residues in contact with the base are in general better conserved than the rest of the chain.
INTRODUCTION
Molecular recognition at all levels, from protein–protein and protein–DNA to protein–ligand, is an integral part of the functioning of the cell. With the plethora of ligands and receptors available, proteins must be able not only to recognise their cognate ligands, but also to discriminate between them and other similar molecules that may be present, in order to preserve their function. However, despite the importance of molecular recognition, our understanding of its mechanism is still limited. One reason for this is that recognition events are driven by changes in the free energy of the participating molecules. Even for protein–ligand interactions, where one of the two molecules is relatively small, our methods for calculating such changes are crude, to say the least, and often fail to give us a correct picture of the relative importance of interactions. The conspicuous lack of successful ab initio methods for the calculation of free energy changes in proteins means that empirical observations of atomic-resolution structures still have a major role to play in the understanding of intermolecular interactions of complex systems.
Surveys of databases of crystal structures have been used extensively in the past for studying hydrogen bonding (1–4) and general intermolecular interaction preferences (5,6) of small molecules. Verdonk et al. (7) extended these initial studies by using the experimental information from small-molecule crystal structures to derive scatterplots of the distribution of one functional group around another. With the exponential growth of the Protein Data Bank (PDB) of macromolecular crystal structures, statistically reliable surveys of protein–ligand interactions have now also become possible. In a study of 18 non-homologous protein–adenylate complexes, Moodie et al. (8) pointed out the lack of a conserved hydrogen bonding pattern for the recognition of adenine, and introduced the concept of a fuzzy recognition template to highlight the fact that the steric and electrostatic requirements of a given ligand can be satisfied by many alternative arrangements of protein residues. Kobayashi and Go (9), using a new method of searching for similar spatial arrangements of atoms around molecular fragments, found that proteins with different folds, such as the d-Ala:d-Ala ligase and cAMP-dependent protein kinase, share common local motifs in their adenine binding sites. Kinoshita et al. (10) extending that study to search for similarities in phosphate binding sites, found that common structural motifs in protein superfamilies that bind phosphate, such as the P-loop, do not have a conserved sequence, as they mainly use backbone atoms to contact the ligand. In a survey of ATP binding proteins, Denessiouk and Johnson (11) identified a common structural framework for adenine binding incorporating polar and hydrophobic interactions between protein and ligand in ∼28% of cases in their dataset. Karmirantzou and Thornton (12) reinforced the fuzzy template concept with their study of haem recognition in the 3-D structures of 14 unrelated protein–haem complexes. Furthermore, Taroni et al. (13) using a set of 19 sugar-binding proteins concluded that, although there is no single recognition template for carbohydrates, certain amino acids show a strong propensity to be in the binding site. The idea of fuzzy structural motifs has more recently also been suggested by Fetrow and Skolnick (14), who used the geometry and conformation of residues in the active site to define descriptors (‘fuzzy functional forms’) suitable for predicting protein function from structures or models.
Nucleic acid bases are of paramount importance in the cell, especially as part of nucleotides that are involved in many aspects of the metabolic network of an organism (15). ATP in particular is ubiquitous in the cell, with an intracellular concentration of ∼3 mM, while other nucleotides are almost an order of magnitude rarer in the cell, with the exception of GTP (concentration of ∼0.9 mM) (15). Nucleic acid bases have often attracted a lot of interest as constituents of DNA and RNA, with both empirical and theoretical approaches (16,17) used in the literature for the study of their structure and energetics. However, studies of the interaction of nucleic acid bases with proteins have concentrated on metabolites and ligands most commonly represented by nucleotides and almost exclusively adenine based. Early observations by Rossmann et al. (18) highlighted the structural similarities of proteins binding the dinucleotide cofactor NAD, but as more structures of protein–ligand complexes were solved, it became clear that these initial observations represented only one small part of the spectrum of nucleotide-binding sites. Nature did not require a particular fold to recognise a particular ligand, not unexpectedly, as Schulz (19) pointed out, since ligand binding is much more of a local event, and not directly related to the overall fold of a polypeptide. Later, the study of Moodie et al. (8) of adenylate-binding proteins came to replace the idea of sequence fingerprints with that of 3-D fuzzy recognition binding site templates, introducing a new approach to our understanding of protein–ligand interactions. Such ideas map well onto the computational chemistry concept of a ligand ‘pharmacophore’, which highlights the key interactions involved in binding a ligand, often derived from a series of small molecule binding experiments without knowledge of the 3-D structure of the binding site. The presence of ‘fuzzy’ recognition templates in proteins naturally does not exclude the presence of common motifs among certain families. Denessiouk and Johnson (11) recently showed that, in the case of adenine nucleotides, 12 different folds share a specific recognition pattern for adenine, and eight of these have a common structural framework for recognising the AMP part of the ligand. However, it is worth noting that, at the time, the families with common recognition motifs represented less than one-third of all adenine mononucleotide-binding complexes in the PDB.
The present study is an attempt to further our understanding of the mechanism of molecular discrimination between very similar ligands. We focus on two nucleic acid bases of fundamental biochemical importance: adenine and guanine. These two purine molecules have very similar shapes and share a common five-member ring, but they also have distinct hydrogen bond donor and acceptor abilities (Fig. 1). This study is entirely based on empirical observations obtained from datasets of crystal structures, carefully selected to avoid bias towards homologous structures more common in the PDB. Analysis of the datasets is 2-fold. First, we examine the distribution of domain folds and protein functions, which are involved in the binding of each of the two purines. Secondly, we concentrate on the atomic level structure of the binding site, in a search for common patterns that could identify the site as adenine- or guanine-binding. Particular emphasis is placed on the hydrogen bond network used to recognise the purine in each case, as well as the propensities of the ligand atoms to be involved in hydrogen bonds with the protein.
Figure 1.

Schematic diagrams of adenine (A) and guanine (B). Hydrogens connected to carbon atoms have been omitted for clarity. The arrows show the positions of hydrogen bond donors and acceptors. The direction of the arrow indicates a donor (away from the ring atom) or an acceptor (towards the ring atom).
MATERIALS AND METHODS
Dataset generation
PDB ligands containing adenine or guanine fragments were retrieved using Relibase (20) (version 4.0, October 2000, http://relibase.ebi.ac.uk), a searchable database of PDB entries. SMILES strings (http://www.daylight.com/dayhtml/smiles/), used to represent the purine fragments in the Relibase searches, were obtained using the CACTVS software (21). Adenine was represented by the SMILES string:
C1(=NC=NC2=C1N=C[N]2)N
and guanine by:
C1(=O)NC(=NC2=C1N=C[N]2)N
Both these strings describe a nucleic acid base with no hydrogen on nitrogen N9. All PDB entries containing one of the two fragments and having a minimum resolution of 3.0 Å were retrieved using the Relibase sub-structure searching facility. 1933 instances of adenine-containing ligands and 548 instances of guanine-containing ligands were retrieved using the above criteria. After removal of duplicates, NMR structures and complexes where the ligand is bound to DNA or RNA, there were 915 complexes with adenine and 216 complexes with guanine-containing ligands.
To avoid having datasets biased towards structures that are more common in the PDB, the CATH structural classification (version 2.0) (22) of protein domains was used to identify homologous protein domains. All levels up to and including H (the homologous superfamily level) were considered, so that two domains were considered homologous if they adopted the same class (C), architecture (A) and topology (T), and were placed in the same homologous superfamily (H) in the CATH classification.
Protein residues in contact with atoms of the purine fragments were identified using the PDBsum resource (23). These were subsequently mapped onto protein domains using CATH, creating a list of protein domain–ligand pairs for each of the two nucleic acid bases. To create a non-homologous dataset, only one CATH representative from each of these lists must be kept, here chosen as the highest resolution structure. However, this means that in any multiple-domain PDB file, some domains might not be in the list whereas others are, despite the fact that they all contact the same ligand. This would affect some of the results. For example, it could result in an underestimate of hydrogen bonds involving the given ligand. Hence, whenever more than one domain contacts the ligand of interest in a PDB structure, all domains are included, if at least one of them is the highest resolution representative of a CATH code. Our final datasets comprise 129 complexes of adenine-containing ligands (corresponding to 112 non-homologous domains) and 42 complexes of guanine-containing ligands (corresponding to 35 non-homologous protein domains). The adenine dataset consists of the following 97 PDB codes: 16pk, 1a0i, 1a26, 1a49, 1a5u, 1a7a, 1a9x, 1aa8, 1ads, 1af7, 1ai2, 1amu, 1aon, 1aqu, 1ayl, 1b0u, 1b3o, 1b5t, 1b6t, 1b8a, 1bcp, 1bg0, 1bg2, 1bq6, 1bxs, 1byq, 1c1d, 1cg6, 1ch6, 1cjt, 1cjw, 1cmc, 1cqx, 1csh, 1cza, 1d2a, 1d4a, 1d4o, 1dad, 1ddt, 1der, 1dgf, 1dhs, 1e8g, 1ecj, 1efv (ligand AMP), 1efv (ligand FAD), 1egd, 1eqo, 1f52, 1fdr, 1frp, 1glb, 1gpe, 1grb, 1kny, 1kpf, 1lu1, 1lvk, 1mjh, 1mrj, 1msk, 1mud, 1mxb, 1nhk, 1nsy, 1pfk, 1qb7, 1qki, 1qmg, 1qnf, 1qor, 1ra9, 1req, 1rkd, 1rpg, 1son, 1uxy, 1v39, 1xva, 1zin, 2adm, 2bkj, 2dpm, 2dub, 2gnk, 2src, 2tdt, 2uag, 3gap, 3grs, 3mde, 3r1r, 3ts1, 4at1, 6rnt, 8gpb. The guanine dataset consists of the following 28 PDB codes: 1a8r, 1aa6 (ligand MGD 801), 1aa6 (ligand MGD 802), 1c3x, 1c4k, 1ch6, 1cip, 1ckm, 1d6a, 1day, 1dek, 1dmr (ligand PGD 1), 1dmr (ligand PGD 2), 1ecb, 1ej1, 1fsz, 1gky, 1mre, 1nue, 1qf5, 1qhi, 1rge, 1rnc, 1tlc, 1v39, 1waj, 2ng1, 3rhn.
Functional classification
Proteins in complexes with adenine/guanine ligands were classified according to their biological function using the SWISS-PROT database (24). In the case of enzymes, the enzyme classification code(s) associated with the SWISS-PROT entry was retrieved.
Hydrogen bond and near-neighbour identification
The program HBPLUS (version 3.15) (25) was used to identify hydrogen bonds in the PDB complexes included in the two datasets. Hydrogen bonds were defined as contacts with a maximum donor–acceptor distance of 3.9 Å, maximum hydrogen–acceptor distance of 2.5 Å and the minimum donor–hydrogen–acceptor angle set to 90°. The above distance and angle criteria are rather relaxed—compared with common hydrogen bond definitions—to allow for uncertainties in the crystallographically determined atom positions. Hydrogen bonds involving both main- and side-chain protein atoms were considered.
Residue atoms in contact with the ligand atoms of interest, but not necessarily forming hydrogen bonds, were retrieved using the ‘near-neighbour’ option of HBPLUS with a maximum distance of 4 Å between the two atoms. These contacts form a superset of the hydrogen bonds involving the same ligand atoms.
Hydrogen bond and near-neighbour propensities
As an estimate of the likelihood of finding an amino acid in contact with, or hydrogen bonded to, the adenine or guanine fragment of a ligand in the PDB, we define contact and hydrogen bond propensities (P) for the 20 most common amino acids using the definition of Moodie et al. (8):
Pb = (Nb/Tb)/(Np/Tp)
where Nb is the number of amino acids of type b in contact with (or hydrogen bonded to) the purine part of the ligand, Tb is the total number of amino acids of this type in the domains of the protein in contact with the ligand, Np is the total number of all residues in contact with the purine part of the ligand and Tp is the total number of all residues in the domains specified. Hence, a propensity >1 signifies a preference for the given amino acid to be in the interface with the ligand, whereas a propensity <1 is assigned to amino acids that are disfavoured in the interface environment. Following Moodie et al. (8) we further define the quantity Π as:
Πb = log10Pb
so that positive values indicate a preference for a given amino acid and negative values indicate disfavoured amino acids in the ligand–protein interface.
Scoring complexes using calculated near-neighbour propensities
If the calculated propensities reflect the true preferences of amino acids to be in the protein–ligand interface, then we should be able to use these propensities to score the environment around the ligands, and decide whether a binding site is likely to accommodate a given ligand, in this case a guanine or adenine fragment. The score of a binding site will be the sum:
Σ{Πb}
where the sum is over all contacts of any amino acid b. To test how well this works on the adenine and guanine datasets, we use the jack-knife approach, i.e. calculate the amino acid near-neighbour propensities using all but one complexes from the original dataset, and then use these propensities to score the complex that is left out. This was repeated for all complexes, for both the guanine and the adenine datasets.
Cambridge Structural Database (CSD) surveys
To obtain a different estimate of the strengths of hydrogen bonding abilities of the acceptor and donor atoms in the two purine rings, we performed a series of surveys of hydrogen bonds in the crystal structures of adenine- and guanine-containing molecules in the CSD (26). The guanine was defined using single and double bond definitions (as shown in Fig. 1), whereas adenine must be defined with the bonds set to variable (aromatic or single/double) for all the adenine cases to be retrieved.
For the database surveys we used ConQuest (version 1.2, © CCDC 2001) which searches the CSD version 5.21 (April 2001). The hydrogen bonding abilities of the various acceptors and donors in the two molecules must be considered as percentages of the total number of complexes, where both an adenine/guanine fragment is present as well as a donor or acceptor. We defined donors as H-X (where X can be any of N, O, C or S) and acceptors as X (where X is N, O or S). A hydrogen bond was defined as an intermolecular contact, with a maximum donor–acceptor distance of 3.9 Å and a maximum hydrogen–acceptor distance of 2.5 Å (the same relaxed criteria as used in HBPLUS). The angle at the donor (donor–hydrogen–acceptor) was restricted to be between 90 and 180°. Hydrogen positions were normalised during the hydrogen bond surveys. Only organic molecule structures with 3-D coordinates and with R factors <0.1 were included. Disordered structures or those with ions, polymers or errors were all excluded from the searches.
Ligand accessibility calculations
To calculate the accessibility of the guanine and adenine fragments in the ligands, the program NACCESS [S. J. Hubbard, and J. M. Thornton, Department of Biochemistry and Molecular Biology, University College London) was used. This is an implementation of the method of Lee and Richards (27) where a probe of given radius is rolled around the surface of a molecule and the path traced out by its centre is the accessible surface. The program’s default values for the probe (1.40 Å) and van der Waals radii were used. Hydrogens and waters were excluded and the option ‘–h’ was used to include ligand groups. Following Moodie et al. (8) we calculate the percentage burial from the percentage accessibility:
%Aburial = 100 – %Aacc
where the percentage accessibility is defined as:
%Aacc = (Acompl/Alig) × 100
Acompl is the accessible surface area of the ligand atoms in the complex, whereas Alig is the accessibility of these atoms in the isolated ligand.
Estimating clashes on replacement of one purine by the other
To estimate the tightness of fitting of the two purines in their respective binding sites, we have used BLEEP (28), an empirical potential of mean force (PMF) developed in our group. BLEEP is made up of two terms. The first is a short-range only term, which is an estimate of van der Waals clashes for short interatomic distances. The second (PMF) reflects how common an interatomic contact is, based on a dataset of such contacts from high-resolution non-homologous protein–ligand crystal structures. BLEEP was developed as a quick method for obtaining relative scores of hypothetical complexes resulting from docking experiments, but in many cases, BLEEP scores for different protein–ligand complexes also exhibit a correlation with ligand binding affinities (29). Here though, we use BLEEP purely as a way of estimating the goodness of fit of a purine in a native complex as compared to that in a hypothetical complex, where one purine has been replaced by the other. We are aware that the treatment of both interacting moieties as rigid is a great limitation to estimating the stability of a complex. Furthermore, the absence of a minimisation procedure does not allow for an interpretation of these scores as energy estimates of the hypothetical complexes. Nevertheless, we believe they are still useful in comparing the binding of these two molecules, especially given their close similarity.
To create the hypothetical complexes, we substitute guanine for adenine in all adenine complexes, and vice versa, by superimposing the five-member rings of the two molecules, using the program ProFit (http://www.bioinf.org.uk/software, a protein least-squares fitting program; © A. C. R. Martin, SciTech Software, 1992–1998). In these calculations we ignore the presence of other ligands, cofactors and waters, and we only calculate scores for the contacts involving the adenine and guanine atoms in each ligand.
Conservation of protein residues
The conservation of residues in contact with the ligand can shed some light on the relationship between evolution and the need for specific recognition of certain moieties. Residues in contact with guanine atoms were obtained from the near-neighbour option of the HBPLUS program, using a 4.0 Å cut-off. Conservation scores for all protein residues in our dataset were calculated by first building multiple sequence alignments and then applying the conservation measure of Valdar and Thornton (30). Multiple sequence alignments were built by running the iterative sequence profile method PSI-BLAST (31) against the non-redundant database (NRDB, a database of protein sequences maintained by the NCBI). The E-value threshold for inclusion of new homologues was conservatively set at 10–40 to avoid the common problem of profile drifting, and the profiles were run for 20 iterations or to convergence, whichever came first. Conservation scores calculated from the alignment range from 0 (the residue is unconserved) to 1 (the residue is conserved). The meaningfulness of the scores depends on the amount of information in the alignment. Most alignments contained more than 10 sequences. Some, however, contained fewer: 1ckmA, i.e. chain A of structure 1ckm, (three sequences found), 1dekA (three), 1rgeA (five), 1waj (six). These are unlikely to give meaningful results for the comparison of conservation scores between the whole chain and the guanine-binding residues. Moreover the set of sequences retrieved with PSI-BLAST should be sufficiently diverse for any conservation of residues in the binding site to become apparent. To assess the diversity of sequences in a given alignment we calculated the standard deviation of the residue conservation scores. Over half (20) of the chains had standard deviations of ≥0.2, but the conservation scores for the following chains had standard deviations <0.1: 1ckmA (0.03), 1dekA (0) and 1rgeA (0.07). Again in these cases, the conservation scores of residues in contact with the ligand cannot reveal much about evolutionary constraints on the ligand environment.
RESULTS
The datasets: structural and functional classification of the proteins
Following the procedure described in Materials and Methods, we have selected from the PDB a dataset of 97 protein–ligand complexes where the ligand contains adenine (comprising 112 non-homologous protein domains) and a dataset of 28 protein–ligand complexes where the ligand contains guanine (comprising 35 non-homologous protein domains).
Over three-quarters of the domains in contact with either an adenine or a guanine ring in the PDB belong to the αβ class of proteins. This contrasts with the distribution of all 1226 representatives of homologous families (H reps) of the CATH classification (version 2.0), where alpha-only and especially beta-only structures are far more common. Among the αβ class of proteins in contact with these purine rings, the most populated architectures are also the most common among αβ structures in the dataset of H reps: the 3-layer (αβα) sandwich (CATH architecture 3.40) and especially the Rossmann fold (3.40.50), the 2-layer sandwich (3.30) and the architecture characterised as ‘complex’ (3.90). The distribution of CATH families for the adenine and guanine datasets are strikingly similar, except for the conspicuous absence of barrel structures (3.20), and more specifically TIM barrels (3.20.20), in the guanine dataset.
The distribution of folds in the two datasets shows that adenine-binding proteins in the PDB are more diverse in structure than are the guanine-binding proteins. Adenine is found bound to 112 different homologous families, whereas guanine is bound to 35 different ones. A randomly selected subset of adenine-binding domains equal in size to the guanine dataset, contains 64 homologous families, indicating that the discrepancy between the two datasets is not just an artefact of the much larger number of adenine-binding proteins in the PDB. The diversity in structure is also reflected in the functional diversity of the adenine-binding proteins. There are 79 enzymes in the adenine dataset, of which 75 have different enzyme classification codes. In comparison, there are only 20 different enzyme types in the guanine dataset. Hence we observe a clear trend for adenine-binding proteins to be involved in a greater variety of functions in the cell.
Knowing which folds bind adenine or guanine prompts the question of how common these folds are in the genomes of organisms. We have taken the genomes of Escherichia coli, Pyrococcus abyssi and Caenorhabditis elegans as representatives of the three superkingdoms of life (bacteria, archaea and eukaryota, respectively) and have searched in each genome for homologues to the families that are known to bind adenine and guanine (data from the Gene3D database, version 1.0 http://www.biochem.ucl.ac.uk/bsm/cath_new/Gene3D). The results, summarised in Table 1, show that (i) homologues of adenine-binding domains are very common across all three genomes, representing at least 7% of the whole P.abyssi genome (30% of all assigned domains), (ii) homologues of guanine-binding domains are generally less common but they still represent ∼2% of each genome. These results accentuate the importance of the purine-binding families, showing that they account for a large number of gene products, which probably derived from domains in the first common ancestor through duplication and mutations.
Table 1. Percentage of domains homologous to adenine-binding and guanine- binding domains among all domains assigned in three genomes.
| Organism |
Dtotal (Pgenome) |
Pade (Pestade) |
Pgua (Pestgua) |
| P.abyssi | 905 (23.6%) | 31.1% (7.3%) | 12.5% (2.9%) |
| E.coli | 2538 (25.1%) | 26.1% (6.6%) | 9.2% (2.3%) |
| C.elegans | 6794 (11.6%a) | 19.4% (2.3%) | 15.5% (1.8%) |
Dtotal = the total number of domains assigned. This number only includes domains that have been assigned to one of the four major CATH classes (i.e. C = 1, 2, 3 or 4).
Pgenome = the percentage of residues in the Dtotal assigned domains over the total number of residues in the genome.
Pade = the percentage of assigned domains homologous to adenine-binding domains.
Pgua = the percentage of assigned domains homologous to guanine-binding domains.
Pestade (Pestgua) = estimated percentage of domains homologous to adenine- binding (guanine binding) domains across the whole genome of the organism. This number is calculated as: Pestade = Pade × Pgenome × 100.
aThis percentage is an average over all C.elegans chromosomes.
It is also interesting that the most common folds among adenine- and guanine-binding domains are also the most populated folds in the genomes of the three organisms studied. For example, we find that 37% of all identified domains in the P.abyssi genome and 30% in the E.coli genome adopt a Rossmann fold. This percentage is higher than for any other fold, even in the case of C.elegans where the Rossmann fold is relatively much less common (15% of known domains are assigned the code 3.40.50 in the CATH classification). Similar results are obtained for the other common architectures in the adenine- and guanine-binding datasets, namely the orthogonal bundle (1.10), the 2-layer sandwich (3.30), and the ‘complex’ architecture (3.90). The small proportion (10%) of beta-only structures in adenine- and guanine-binding domains may appear surprising at first, given that almost one-quarter of all known domains adopt such structures. However, this number agrees well with their proportion in two of the three genomes studied here (in C.elegans this number is a lot higher, 18%, but this may not be representative of all eukaryotes, e.g. beta-only structures in S.cerevisiae account for 8% of the known assigned domains).
We now turn our attention to the PDB ligands in the two datasets. In the adenine dataset, only five of the 97 ligands are adenine molecules with the vast majority of the remaining being adenine nucleotides. ADP, ATP and AMP account for more than one-third of all ligands (33), followed by NAD, NADP and NADPH (13), FAD (12) and coenzyme A derivatives (8). In the guanine dataset there is only one guanine molecule. Of the remaining 27 ligands, 25 are guanine nucleotides, the most common of which are guanosine-5′-diphosphate (GDP, five), guanosine-5′-triphosphate (GTP, four) and guanosine-5′-monophosphate (5GP, four).
In biological systems adenine nucleotides, whose active moiety is located at the opposite end of the molecule from the purine ring, are used primarily as free energy carriers (ATP), electron carriers (FAD, NAD) or group carriers (coenzyme A). This is reflected in the enzymatic activities of the proteins in complex with these ligands, as shown in Figure 2A. Oxidoreductases and transferases make up for >50% of all proteins in the adenine dataset. Of the remaining, a large fraction (∼10% of the adenine dataset) is involved in synthesis of complex molecules from their simpler constituents (ligases), via the formation of bonds, a procedure coupled with the hydrolysis of a high energy bond. Finally, ∼15% of the adenine-binding proteins in our study are not classified as enzymes. These include chaperones with ATPase activity, transcription regulators and electron transport proteins.
Figure 2.


The distribution of functions across the adenine (A) and guanine (B) datasets. In this plot the first class of the enzyme classification (first E.C. number) has been used to categorise the proteins to the six known enzyme classes (oxidoreductases, E.C.1; transferases, E.C.2; hydrolases, E.C.3; lyases, E.C.4; isomerases, E.C.5; ligases, E.C.6). The ‘no E.C.’ category represents protein chains that are known to have enzymatic activity but there is no E.C. number assigned to them in SWISS-PROT. The ‘non-enzymes’ category represents proteins that either do not have any enzymatic activity, or they have some activity but their main biological role is not enzymatic.
The distribution of the functions of adenine-binding proteins contrasts with Figure 2B, which shows that among guanine-binding proteins, transferases are far more common than oxidoreductases, reflecting the common use of guanine nucleotides as phosphoryl donors in protein synthesis and signal transduction processes. The hydrolytic cleavage of bonds is also a common function, with about one-sixth of the proteins in the guanine dataset being classified as hydrolases. The complete absence of isomerases in the guanine dataset is probably not significant and due to the small number of proteins in the set. The guanine-binding proteins not classified as enzymes include an immunoglobulin, a signal recognition protein, a cell-division protein and a translation initiation factor.
The ligand environment
Burial of the purine rings. Figure 3 shows the percentage burial of the adenine (A) and guanine (B) rings in the complexes studied (note that the order of complexes in the plots is alphabetical and hence corresponds to the same order as listed in Materials and Methods). In 18 complexes, guanines show a remarkable burial of >90%, with an average burial for all 28 guanine complexes of 91%. The Protein Quaternary Structure (PQS) server at EBI (http://pqs.ebi.ac.uk) was used to check the protein aggregation state for the few cases where the ring burial was <80%, but the evidence in all cases was that the exposed state of the ligand was genuine. The lowest burial value (64%) is observed for the guanine base of the inhibitor GMP in the catalytic site of glutamine phosphoribosylpyrophosphate amidotransferase (GPATase, PDB code 1ecb) (32). This active site is solvent accessible in the open inactive form of the enzyme (which is virtually identical to the one in the complex with the GMP inhibitor) but it is covered up by a flexible loop when the substrate is bound, making the site 100% inaccessible to solvent. Hence the higher accessibility in this case is due to GMP being an inhibitor of the GPATase rather than a substrate.
Figure 3.


Percentage burial of adenine (A) and guanine (B) moieties in their corresponding complexes. The line drawn through the individual data points is of no significance and is only added for clarity.
The average percentage burial for the adenine ring in 97 complexes examined is slightly lower (84%), but in the vast majority of ligands this value is still >80%. In five cases (1b3o, 1lu1, 1mxb, 2gnk, 2tdt) the oligomeric states suggested by the PQS server are different from the ones in the PDB structures but they agree with the ones reported in the literature with the exception of 1mxb. This enzyme is a tetramer, but the active site is between two subunits, and hence the dimer model suggested by PQS is still adequate. In all five cases the oligomeric states suggested by the PQS server would result in an increase in burial of the adenine atoms, although the average burial for all complexes would only increase to 86%. The lowest burial value (27%) corresponds here to the adenine atoms of the nicotinamide adenine dinucleotide bound in the active site of flavin reductase P (2bkj) (33). NAD adopts an unusual folded conformation in this structure, with the nicotinamide and adenine rings stacked in parallel. Although the adenine part is exposed, the pyrophosphate interacts with the cofactor flavin mononucleotide (FMN), which is much more buried. Interestingly, in the study of Moodie et al. (8), with a very different dataset of complexes, one of the two major outliers in ligand burial values involves a FAD molecule bound to spinach ferredoxin reductase, which also interacts with a buried FMN molecule. However, the two proteins are not homologues and the unusual conformation of NAD is not seen in the FAD molecule.
Thus in the vast majority of complexes the adenine and guanine rings are >80% buried. They act as a ‘sticky’ hook which binds the active moiety (usually a phosphate group) to the protein.
Distribution of residues around the purines. In Figure 4 we plot the distribution of neighbours (contact distance of <4.0 Å) to adenine (A) and guanine (B) rings in the ligands, classified as main- or side-chain protein residues, waters and other ligands. The two distributions are remarkably similar: in both cases over three-quarters of the contacts come from protein residues, the majority (over half) of which come from side-chain atoms. Considering the similarity of the two environments, it is then surprising to see the difference in the hydrogen bond distributions between adenine and guanine (Fig. 4C and D). As Figure 4D shows hydrogen bonds involving the guanine ring are almost equally likely to involve a protein residue (main- or side-chain) as they are to involve water. In contrast, half of the hydrogen bonds to the adenine rings in the dataset come from water molecules, an observation that agrees with that of Moodie et al. (8). This reflects the greater exposure of adenine compared with guanine in their corresponding complexes. However, it is difficult to imagine that the difference in the accessibility values (which is rather small overall) is solely responsible for the difference in the origin of hydrogen bonds to the two bases. An alternative explanation could be that adenine forms part of a wider variety of ligands binding to a wider variety of protein environments, not all of which could, or indeed needed to, evolve to specifically recognise the purine ring. In these cases waters in or near the active site can be used to fulfil the hydrogen bonding potential of the ligand fragment.
Figure 4.

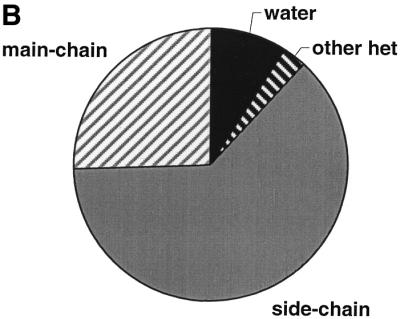
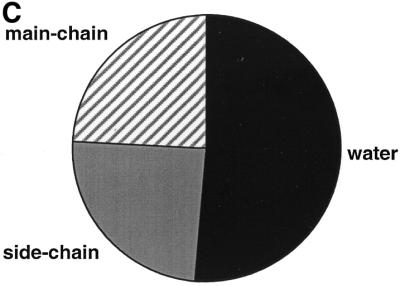

Classification of neighbours and hydrogen-bond partners of adenine and guanine moieties into protein atoms (main-chain and side-chain) and small molecule atoms (water or other hetero-group). (A) Adenine neighbours, (B) guanine neighbours, (C) adenine hydrogen-bond partners, (D) guanine hydrogen-bond partners.
In a more detailed analysis of the environment around the purines in this study we plot the propensity of each of the 20 most common amino acids to be in the vicinity of adenine and guanine (Fig. 5). As perhaps expected, we find that many of the hydrophobic residues are disfavoured in the ligand binding sites, although the presence of an aromatic ring makes residues such as Phe, Trp and Tyr welcome in an environment where the ligand could benefit from stacking aromatic–aromatic interactions with the protein side-chains. Perhaps surprisingly, the propensities differ significantly between the two nucleic acid bases. Striking examples are Arg residues, which have large positive Π values for adenine but negative values for a guanine binding site, and Cys residues, which are favoured in guanine environments but not in adenine ones. Although the cysteine propensities are based on relatively fewer observations, it is probably significant that the number of cysteine contacts to adenines are almost half that of contacts to guanine, despite the latter being a much smaller dataset. On the other hand, the data for arginine is based on a large number of observations and shows that Arg is often used to contact adenine, but rarely guanine. It is interesting that arginines in contact with adenine often have their side-chains stacked on top of the adenine rings, with no direct hydrogen bond between the two moieties. Sometimes such an arrangement is additionally favoured by hydrogen bonds between the arginine side-chain and a phosphate or other group attached to the adenine, but this is not always the case. In addition, histidine is much more favoured in the adenine environment, where it is often involved in stacking interactions with the adenine rings. This type of aromatic stacking is not found in the fewer cases where a histidine is in contact with guanine, suggesting that such contacts are less favourable for guanine than for adenine. The propensity data for the adenine ring agrees only partially with that presented in the older study of Moodie et al. (8), which was based on fewer data and adenylate only complexes.
Figure 5.

Calculated Π values for the 20 most common amino acids, representing the propensity of an amino acid to be within a 4.0 Å cut-off from an adenine or guanine atom in the complexes studied. The y-error bars have lengths of four standard deviations, calculated for each amino acid from the entire population of Π values, obtained using a jack-knife method on the dataset of complexes.
The examination of the adenine and guanine environments in our datasets leads naturally to the question of whether the calculated Π values truly reflect the propensity of amino acids for guanine and adenine binding sites and, if so, to what extent these values can be used to discriminate between the two purines. To answer this question we first create subsets of the original datasets, each time leaving out one of the binding sites, and then calculate the propensities for each subset. This results in 28 estimates for propensities from the guanine and 97 estimates from the adenine dataset. The Π values for each amino acid calculated from the guanine set have a standard deviation that ranges between 0.02 and 0.04 in most cases. On the other hand, the Π values for the adenine dataset have smaller standard deviations which fluctuate around 0.01. Tryptophan is an outlier with a standard deviation of its population of propensity values of 0.19 (for guanine) and 0.02 (for adenine), but this is expected as tryptophan is the least common residue in both the adenine and guanine domains examined. The other two large standard deviations (leucine in the guanine and cysteine in the adenine dataset) are both almost entirely due to specific complexes (1a8r for leucine, and 1cg6 and 1efv for cysteine). Mean propensity values vary significantly, depending on whether they were calculated using guanine or adenine binding sites. For only five of 20 amino acids (Gly, Thr, Trp, Tyr and Val) do the mean values ±2 standard deviations overlap.
This leads naturally to the idea of scoring each binding site by summing up all of the Π values corresponding to the residues in contact with the purine. In Figure 6 we plot the scores for all guanine-binding sites in our dataset, calculated using all guanine complexes except the one that is being scored. Then we score the same binding sites using this time each of the 97 sets of the adenine Π values and plot the mean of the 97 scores in the same figure, indicating the standard deviation for each score.
Figure 6.

Amino acid propensity-based scores for the guanine binding sites in 28 protein–guanine complexes. White columns, calculated from all guanine-binding complexes except the one being scored; grey columns, the mean of 97 scores for each complex, each calculated from the adenine dataset propensities using a jack-knife method. The y-error bars are four standard deviations long.
Despite the obvious simplicity of the method the results are reasonable. We find that 14 of the 28 binding sites have guanine-derived scores that are higher than the adenine (mean + 2*standard deviations) score. Of the remaining 14 cases, 1ch6, 1d6a, 1day and 3rhn are all known to bind the adenine-equivalent of the guanine ligand, and so they are true negatives. This leaves 10 cases of which five (1mre, 1ecb, 1fsz, 1dek and 1aa6_0802) show minimal differences between the scores obtained using the guanine or the adenine propensities. The remaining five stand out by having much better adenine scores as compared with the guanine ones: 1a8r, 1dmr (with ligand PGD-2), 1ej1, 1rnc and 1qhi. Two of these cases can be rationalised on the basis of their unusual binding sites dominated by one type of residue. 1a8r has a very high leucine content (see previous paragraph) and the binding site of 1ej1 contains a very large number of tryptophan contacts (which actually account for 92% of all Trp contacts in the dataset). Tryptophan is unusual in guanine binding sites, but more common in adenine ones, which is why the propensity scores are higher when using the adenine values, rather than the guanine. Moreover, a third case (1rnc) is also not guanine-specific, as this is a complex of pancreatic ribonuclease with guanine bound in the B1 site, where normally a pyrimidine base is found. The remaining cases are more difficult to interpret and they seem to arise from a combination of lower guanine propensity values for more than one residue. Overall, one should be careful in interpreting the results of such simple approaches, especially since the guanine propensities are based on a relatively small dataset. As demonstrated in Figure 6, in only about half of the cases, a guanine-binding site is given a positive score, using the propensities calculated from the remaining guanine binding sites. A similar result is obtained for the adenine binding sites, scored using adenine propensities (data not shown), indicating that even with a larger dataset the method is not very sensitive.
The information provided by the propensity calculations is valuable for estimating the likelihood of finding a given amino acid in a purine binding site, but provides no clues as to what the 3-D distribution of protein atoms looks like in these binding sites. It is of particular interest to visualise how generic atom types (e.g. oxygens) distribute themselves around a ligand, as this directly leads to an image of possible pharmacophores in the binding site. To avoid overcrowding such a distribution with too much data, which would hinder a simple visual understanding of the distribution, we have constructed these plots as follows. First, we have only taken into account one atom from each residue that is in contact with the ligand, thus ensuring that only the most important (here defined as the shortest) interactions are present in the plot. Secondly, we have defined only three categories of atoms: hydrogen bond donors, hydrogen bond acceptors and atoms in contact with the ligand but not forming hydrogen bonds (these are mainly carbons). This allows us to derive the plots in Figure 7 [generated using Raster3D (34)], which can be easily analysed visually. Figure 7A and B shows the distribution of protein atoms around the adenine molecule (97 complexes superimposed) and Figure 7C and D shows the corresponding distribution around the guanine base (28 complexes superimposed). It is clear that there is a strong preference for carbon atoms to gather in the hydrophobic areas above and below the aromatic rings. Conversely, the areas around the rim are occupied by hydrogen bond donors and acceptors. These form preferred clusters opposite the ligand atoms that can satisfy their potential for forming hydrogen bonds. Although there are obvious clusters of donors and acceptors, it is also clear that preferred motifs are fuzzy, with a spread of preferred positions obviously determined by the neighbouring atoms of both protein and ligand residues. Inspection of the plots highlights the differences in the adenine and guanine binding sites, which are particularly strong near N6/O6, N1 and N3. Such differences reveal how the proteins discriminate between the two purine rings.
Figure 7.


The distribution in space of protein atoms around guanine and adenine ligand fragments. Only the shortest contact from each residue is shown. Each atom is categorised as hydrogen bond donor (blue), hydrogen bond acceptor (green) or simple contact (no hydrogen bond involved, grey). (A) View along the plane of the guanine ring, (B) view from the top of the guanine ring, (C) view along the plane of the adenine ring, (D) view from the top of the adenine ring. In plots (B) and (D) the carbon atoms have been removed for clarity.
Hydrogen bond partners of adenine and guanine rings: observed interactions. In Figure 8 we plot the logarithm of the propensities of amino acids to form hydrogen bonds to adenine and guanine rings. In total we have 161 hydrogen bonds to adenine and 91 to guanine (counting only hydrogen bonds between the protein and either purine). Hence propensities for guanine are likely to be less stable due to the smaller number of observations, and may change as more data are gathered. As expected, all hydrophobic residues are disfavoured in the binding sites of these purines, with the interesting exception of isoleucine and valine that have slightly positive Π values for the adenine binding sites (these values are calculated on the basis of 12 and 14 contacts from nine and eight different complexes, respectively, so they should be reliable). In both the valine and isoleucine cases it is the backbone nitrogen and oxygen that are involved in the hydrogen bonds, since the side-chains are not polar. The most common arrangement found in these cases is having the backbone nitrogen donating a hydrogen to adenine N1 concurrently with the backbone oxygen accepting a hydrogen from the adenine N6, thus forming a particularly favoured double hydrogen bond.
Figure 8.

Calculated Π values for the 20 most common amino acids, representing the propensity of an amino acid to form hydrogen bonds to an adenine (grey) or guanine (white) atom in the complexes studied.
Charged and polar residues are in general more favoured but the propensities vary considerably for the two environments. The most favoured residues in the case of guanine are Asp, Cys and Glu, followed by Gln, Asn and Ser. However, the propensity calculated for Cys is based only on three observations and hence it is not significant. In the case of adenine the order is Asn, Thr and Ser, followed by Gln, Tyr and Asp. Once again we observe that amino acids with side-chains that can form two hydrogen bonds using two different atoms are generally favoured. Asparagines, for example, often adopt a conformation where the side-chain oxygen can form a hydrogen bond to adenine N6, and at the same time the side-chain nitrogen can benefit from the favourable environment around N1 or N7. Similarly, the carboxylate groups of Glu and Asp can arrange themselves opposite the N1 and N2 atoms of guanine, matching their hydrogen bonding acceptor potential to the donor potential of guanine atoms. These are undoubtedly energetically low arrangements, even if the second interaction is sometimes missed using our geometric criteria.
Overall it is interesting that the top three most favoured amino acids are different between the two types of binding sites, with guanine showing a preference for carboxylate groups and adenine a preference for hydroxyl groups. It is also worth noting that the hydrogen bonds from these highly favoured amino acids involve almost exclusively in the case of guanine (in 32 out of 35 contacts) the atoms N1 and N2. In the case of adenine it is N6 that forms the majority of hydrogen bonds to the most favoured amino acids (31 of 50). The striking difference in the hydrogen bonding abilities of these atoms raises the following question: Do these numbers merely reflect the true hydrogen bonding abilities of atoms, as determined by the electron density distribution in the molecule, or are they also influenced by the receptor recognition process? The following paragraph attempts to answer this question.
Hydrogen bond partners of adenine and guanine rings: theoretical estimates. We first counted the number of hydrogen bonds involving each purine atom (including hydrogen bonds to water) and compared them to the theoretical maximum number of hydrogen bonds in which each donor or acceptor can be involved. Figure 9 shows the ratio of the observed over the theoretical maximum for the four adenine and five guanine atoms. In both cases we ignored N9, as it is almost always attached to the rest of the ligand and cannot act as a donor. We assigned a maximum of two hydrogen bonds to adenine N6 and guanine O6 and N2, and one potential hydrogen bond to all other donors and acceptors. We then multiplied this maximum per complex by the number of complexes studied to derive the theoretical maximum number of hydrogen bonds for each atom, as well as for all atoms. The overall percentage of satisfied donors and acceptors is very similar for the two purines (67% for adenine and 69% for guanine), and for both it is the donors (adenine N6 and guanine N2 and N1) that most often satisfy their hydrogen bonding ability rather than the acceptors.
Figure 9.

Ratio of observed number of hydrogen bonds over the theoretically possible maximum for four adenine (grey) and five guanine (white) atoms, as well as for the sum of all hydrogen bonds in the complexes studied.
Another striking observation from Figure 9 is that the adenine and guanine N3 atoms accept only about one-third of the theoretical maximum hydrogen bonds. This makes them the ‘apparently’ weakest hydrogen bond acceptors, an observation that agrees with that of Moodie et al. (8), which was based on adenylate complexes. Interestingly, their theoretical calculations based on a model potential derived from an accurate anisotropic electrostatic model and a standard ‘6-exp’ repulsion–dispersion part, showed that N3 is not the weakest hydrogen bond acceptor of an adenine ring, but is in fact of similar strength to N1 and stronger than N7. Although these calculations used a small basis set—by today’s standards—and ignored electron correlation, atomic charges fitted to the molecular electrostatic potential calculated using larger basis sets and including correlation at the MP2 level, reflect the same trend (16). The charge on N3 (for both adenine and guanine) is more negative than that on N7, and of very similar magnitude to the charge on N1.
Hydrogen bond partners of adenine and guanine rings: observations from the CSD. An alternative approach to theoretical calculations for estimating the relative hydrogen bonding abilities of atoms in a molecule is to examine hydrogen bond formation in an environment where there can be direct competition for a donor or acceptor. Such competition is often obscured in PDB crystals by the hydrophobic effect. However, the CSD of small molecules has often been used for examining the hydrogen bonding abilities of atoms in molecules and the results of theoretical calculations generally agree qualitatively with the results of CSD searches (1–3). Although it has been suggested that the geometric criteria used in CSD searches are not always sufficient for defining hydrogen bonds (35), they are still very useful and in most cases provide an accurate picture of the tendency of atoms to be involved in hydrogen bonds. Table 2 presents the results of the CSD surveys for hydrogen bonds to adenine and guanine. According to this table, the ranking of hydrogen bond-forming tendencies is for adenine: N6 > N1, N7 > N3, and for guanine: N1, N2, O6 > N7 > N3. This order is very similar to what is observed in PDB crystal structures, with N3 being clearly singled out as the weakest acceptor in both cases. The earlier suggestion (8) that N3 is often avoided as an acceptor in protein–ligand interfaces because of the need to discriminate between adenine and guanine rings (which are identical at this position) is therefore not supported by the evidence here, as such a discrimination is not needed in the CSD crystals. A possible explanation is that N3 is somewhat more shielded from potential donors because of its position in the ring. Adenine and guanine rings often form part of larger ligands, most commonly found attached at the N9 atom. It is not unlikely that the presence of these extra fragments reduces the accessibility of the N3 atom to hydrogen bond donors (in the isolated ligand, the accessibility of N3 is about three-quarters that of N7 in adenine). This suggestion is supported by the fact that two-thirds of the hydrogen bonds to both adenine and guanine N3 are actually formed by water, which can fill cavities created by the shape of the ligand. An alternative would be the possibility for N3 to form intramolecular hydrogen bonds to the rest of the ligand. In fact a search of the CSD for intramolecular hydrogen bonds to adenine N3 yields 13 hits, 11 of which are entries where there is no intermolecular hydrogen bond to the same atom. Adding intramolecular to intermolecular bonds to adenine N3 in the CSD would bring the total to 82 (and the fraction of satisfied hydrogen bonds to 0.6), a number closer to those observed for N1 and N7 (note that a similar search for intramolecular hydrogen bonds to adenine N1 yields zero hits). Similarly, intramolecular hydrogen bonds to guanine in the CSD bring the total to 18, and the fraction of satisfied hydrogen bonds to 0.7. Intramolecular hydrogen bonds to adenine or guanine N3 in the PDB are not common, but its potential for hydrogen bonding may be instead satisfied, in some cases, by water too mobile to observe.
Table 2. Results from surveys of hydrogen bonds to guanine and adenine in the CSD.
| |
Atom |
No. entries with hydrogen bonds |
No. entries with hydrogen bonds/no. entries with potential to form hydrogen bonds |
| Adenine | N1 (acceptor) | 89 | 0.7 |
| N3 (acceptor) | 69 | 0.5 | |
| N6 (donor) | 109 | 0.8 | |
| N7 (acceptor) | 88 | 0.7 | |
| Guanine | N1 (donor) | 20 | 0.8 |
| N2 (donor) | 20 | 0.8 | |
| N3 (acceptor) | 11 | 0.4 | |
| O6 (acceptor) | 20 | 0.8 | |
| N7 (acceptor) | 16 | 0.6 |
Number of entries with a guanine and an H-X (X = [N,O,C,S]) fragment = 25.
Number of entries with a guanine and an X atom (X = [N,O,S]) = 25.
Number of entries with an adenine and an H-X (X = [N,O,C,S]) fragment = 133.
Number of entries with an adenine and an X atom (X = [N,O,S]) = 133.
The number of hydrogen bonds retrieved in these surveys is the number of unique CSD entries where such a hydrogen bond was found. We have removed duplicate entries of the same structure, i.e. CSD ‘refcodes’ where the first six characters were identical.
Hydrogen bond partners of adenine and guanine rings: hydrogen bonds and molecular discrimination. Another interesting question regarding the hydrogen bonding patterns observed in these binding sites is whether they reflect the need for discrimination between adenine and guanine. Evidence for this hypothesis is given by the fact that the discriminating sites in the two purines (N1, N2 and N6/O6) form 74 and 81% of all hydrogen bonds to adenine and guanine, respectively. Moreover, one would expect a binding site highly specific for guanine to have evolved so as to satisfy the guanine hydrogen bond donors and acceptors, but not those of another similar-volume molecule. To test this hypothesis, we substituted guanine for adenine in the 28 guanine binding sites, and used HBPLUS to calculate potential hydrogen bonds in the hypothetical protein–adenine complex. It is significant that more than half the hydrogen bonds are lost in total over all complexes. There are four cases where the number of hydrogen bonds has increased or stayed the same on substitution of guanine by adenine. The two cases where we see an increase in the number of hydrogen bonds on substitution by adenine (1ch6 and 1ecb) are both due to limitations of automatic assignment of hydrogen bonds (in the first case the distance cut-off is too short and in the second the angle cut-off is too relaxed). In the two cases where the number of hydrogen bonds remains the same on substitution of guanine by adenine are 1ckm (where a lysine previously contacting O6 and N7 now contacts N6 and N7) and 1rnc (where a threonine previously contacting O6 and N7 now contacts N6 and N7). Although the orientations of the corresponding groups satisfy the geometric criteria for hydrogen bonds, it is obvious that the electrostatic interactions of such arrangements would not be favourable, as they bring in uncomfortably close contact two hydrogen bond donors (in the latter case), or a positively charged group (side-chain of lysine) with a double hydrogen bond donor (adenine N6) in the case of 1ckm.
We conclude that, overall, the substitution of guanine by adenine leads to a severe loss of hydrogen bonds, generally considered essential for binding. In a few cases, rearrangement of the adenine orientation may result in the formation of compensating interactions, allowing both purines to be recognised by a binding site, but more generally, size and shape restrictions often exclude one from the binding sites of the other.
Estimating the goodness of fit of purines in a binding site. In Figure 10A we plot the absolute difference in BLEEP scores between the 28 guanine complexes and the hypothetically constructed adenine models, where we have replaced guanine by adenine. Similarly, Figure 10B depicts the difference in scores for the 97 adenine complexes and the corresponding guanine-containing models. In these plots a positive number indicates a better score for the original complex compared to the hypothetical model. In the majority of cases the difference scores indicate that each of the two purine bases fits much better in their own cognate binding sites. There are of course a few exceptions (in ∼10–15% of cases the hypothetical model is scored better than the original complex) and these can be expected to arise not only from the limitations of the scoring method but also from the fact that some binding sites are in fact promiscuous, allowing binding of both purines. It is clear that if flexibility is allowed, and the fragment that substitutes the original one in the complex is allowed to re-orient itself in the binding, it might achieve a much better score. However, given the fact that the volume of binding sites is often limited and movement of both ligand and protein is likely to be constrained, the scores presented here represent a reasonable estimate of the difference in the goodness of fit of the two molecules in a given binding site. These results support the hypothesis that protein binding sites have evolved not only to recognise their cognate ligands but to be able to discriminate between very similar ligands.
Figure 10.


Difference in BLEEP scores calculated for the original complex and for the hypothetically constructed complex where one purine replaces the other. (A) 97 complexes where guanine was substituted for adenine, (B) 28 complexes where adenine was substituted for guanine.
Conservation of residues in contact with guanine. If discrimination between very similar molecules is indeed important for the proper functioning of the cell, it is inevitable that the rules to achieve it will be somehow imprinted in the evolution of protein sequence and structure. Hence, a very interesting question is whether residues in contact with a ligand or part of it are generally better conserved through evolution than the rest of the protein.
We have calculated the conservation scores of residues contacting guanine atoms in the 26 protein chains of our guanine dataset. In Figure 11 we plot the difference between the average scores for the residues in contact with ligand atoms and the average score for the whole chain. We distinguish between two groups of ligand atoms to highlight any differences that may arise from the need to discriminate between purines: those that are common to adenine and guanine and those that are unique to guanine (N1, N2, O6). In the overwhelming majority of cases the residues contacting the ligand atoms are better conserved than the whole chain itself, although the conservation for residues contacting the N1, N2 and O6 atoms is not as strong as might have been expected. The only two exceptions are in the case of an antibody Fab fragment in complex with GDP (1mre chain L) and a ribonuclease in complex with guanosine-2′-monophosphate (1rge chain A). The case of 1mre can be rationalised on the grounds that antibodies have evolved to bind a great variety of antigens, and this means their binding sites vary considerably and are much less conserved than the rest of the protein. In the case of ribonuclease, the conservation scores are based on an alignment of only five sequences and so are not reliable.
Figure 11.

Plot of conservation difference scores, ΔC, for 26 protein-chains in contact with guanine, where ΔC is defined as: ΔC = Cgua – Cchain. Cgua is the average conservation score for residues in contact with guanine atoms and Cchain is the average conservation score for the whole chain. Black, difference scores calculated using the average score from residues in contact with O6, N1 or N2 only; white, difference scores calculated using the average score from residues in contact with all other atoms.
DISCUSSION
This study has concentrated on the molecular recognition and discrimination by proteins of adenine and guanine, two very similar molecular fragments with a spectrum of distinct biological roles in the cell. Conclusions are almost entirely based on observations from carefully selected non-homologous crystal structures of protein–ligand complexes, where the ligand contained one of the two nucleic acid bases.
We find both a difference in the variety of protein folds and functions that adenine binds to as compared with guanine, and a significant difference in the environments of the two ligands. Adenine, for example, is on average more exposed to the solvent, often fulfilling the hydrogen bonding potential of its atoms using water molecules. Guanine, on the contrary, is almost always buried deep inside the binding site, and uses mostly protein residues to form hydrogen bonds. Not only the number but, more importantly, the types of amino acid residues that contact either base differ. Characteristic examples are the arginine residues that are often found stacked on top of adenine rings but they are generally disfavoured in guanine binding sites, and the glutamic and aspartic acid residues that are more likely to be found around guanine, rather than adenine. In principle, such differences could be exploited to discriminate between binding sites, but the success of simple attempts based on summing up the propensities of the residues within a certain cut-off distance from the ligand is bound to be limited, especially when the molecules exhibit high similarity. Perhaps a more promising approach is a simplified graphic representation of the distribution of hydrogen bond donors and acceptors, as well as hydrophobic atoms around each ligand, which helps identify ‘hot spots’ and general pharmacophore patterns around a given moiety. Such plots in this study show a similar arrangement of mainly carbon atoms above and below the aromatic rings of the two bases (as expected), with the majority of hydrogen bond donors and acceptors around the rim, but clustered into ‘fuzzily’ distributed groups. The locations of these groups are different for the two bases, reflecting the difference in the location of hydrogen bond donors and acceptors in the ring.
The study of hydrogen bonds to the two nucleic acid bases in our datasets reveals a few more interesting points. An important conclusion is that 70–80% of all hydrogen bonds involve the atoms that discriminate between adenine and guanine. In a theoretical experiment, if the two purines are swapped, more than half the hydrogen bonds are lost in total. These hypothetical complexes also tend to have much worse empirical BLEEP scores, compared with the original complexes, indicating a worse overall fit both in terms of van der Waals clashes, and a general lack of favourable contacts between the protein and the ligand. Our results suggest that proteins not only have evolved to recognise their cognate ligands but also exhibit a strong discriminatory power to bind only their own ligand, and not other similar molecules that may be present in the cell.
Some additional conclusions can be drawn from the hydrogen bonds study. One is that the ligand atoms most commonly involved in recognition are the hydrogen bond donors (N6 in adenine and N2 and N1 in guanine) rather than the acceptors, although a trivial reason for this may be that the protein backbone contains more acceptors than it does donors. N3 is for both ligands the atom used less often in hydrogen bonds, an observation that agrees with the evidence from crystal structures of small molecules (CSD). A possible explanation is that N3 is often the least accessible atom in a ligand containing either of the two bases, where the approach of potential hydrogen bond donors may be hindered. Another observation is that residues with side-chains capable of forming double hydrogen bonds, such as Asp, Glu, Gln and Asn, are among the most popular partners of these rings. This is due to the energetic advantage gained from forming such multiple interactions (36). We also find that contact propensities differ significantly between the two bases, with carboxylate groups (Asp and Glu) showing a preference for guanine binding sites, where they can simultaneously contact N2 and N1, whereas Asn has the highest propensity for adenine binding sites, where it is often found using its amide group to contact both N6 and N1 or N7.
Finally, we have shown that protein residues in contact with guanine are on average better conserved than are the remaining residues in the same protein domain. This suggests that molecular recognition is imprinted in evolution, driven by the need for proteins to retain specificity and functionality in order to be able to achieve their biological role.
The present study has helped reveal the basic differences and similarities between the ways that proteins recognise adenine and guanine. By doing so, it has provided additional evidence to support the theory that recognition of ligands is ‘fuzzy’, while showing at the same time that such fuzzy templates can be highly discriminatory, even among very similar ligands.
Acknowledgments
ACKNOWLEDGEMENTS
We wish to thank Mr D. Buchan for help with the Gene3D database and Dr A. Todd for providing us with a PDB to SWISS-PROT correspondence file.
References
- 1.Lommerse J.P.M., Price,S.L. and Taylor,R. (1997) Hydrogen bonding of carbonyl, ether, and ester oxygen atoms with alkanol hydroxyl groups. J. Comput. Chem., 18, 757–774. [Google Scholar]
- 2.Nobeli I., Price,S.L., Lommerse,J.P.M. and Taylor,R. (1997) Hydrogen bonding properties of oxygen and nitrogen acceptors in aromatic heterocycles. J. Comput. Chem., 18, 2060–2074. [Google Scholar]
- 3.Dunitz J.D. and Taylor,R. (1997) Organic fluorine hardly ever accepts hydrogen bonds. Chem. Eur. J., 3, 89–98. [Google Scholar]
- 4.Allen F.H., Baalham,C.A., Lommerse,J.P.M., Raithby,P.R. and Sparr,E. (1997) Hydrogen-bond acceptor properties of nitro-O atoms: A combined crystallographic database and ab initio molecular orbital study. Acta Crystallogr., B53, 1017–1024. [Google Scholar]
- 5.Bruno I.J., Cole,J.C., Lommerse,J.P.M., Rowland,R.S., Taylor,R. and Verdonk,M.L. (1997) IsoStar: a library of information about nonbonded interactions. J. Comput. Aid. Mol. Des., 11, 525–537. [DOI] [PubMed] [Google Scholar]
- 6.Lommerse J.P.M., Stone,A.J., Taylor,R. and Allen,F.H. (1996) The nature and geometry of intermolecular interactions between halogens and oxygen or nitrogen. J. Am. Chem. Soc., 118, 3108–3116. [Google Scholar]
- 7.Verdonk M.L., Cole,C.J. and Taylor,R. (1999) SuperStar: a knowledge-based approach for identifying interaction sites in proteins. J. Mol. Biol., 289, 1093–1108. [DOI] [PubMed] [Google Scholar]
- 8.Moodie S.L., Mitchell,J.B.O. and Thornton,J.M. (1996) Protein recognition of adenylate: an example of a fuzzy recognition template. J. Mol. Biol., 263, 486–500. [DOI] [PubMed] [Google Scholar]
- 9.Kobayashi N. and Go,N. (1997) A method to search for similar protein local structures at ligand-binding sites and its application to adenine recognition. Eur. Biophys. J., 26, 135–144. [DOI] [PubMed] [Google Scholar]
- 10.Kinoshita K., Sadanami,K., Kidera,A. and Go,N. (1999), Structural motif of phosphate-binding site common to various protein superfamilies: all-against-all structural comparison of protein-mononucleotide complexes. Protein Eng., 12, 11–14. [DOI] [PubMed] [Google Scholar]
- 11.Denessiouk K.A. and Johnson,M.S. (2000) When fold is not important: a common structural framework for adenine and AMP binding in 12 unrelated protein families. Proteins Struct. Funct. Genet., 38, 310–326. [PubMed] [Google Scholar]
- 12.Karmirantzou M.I. and Thornton,J.M. (1998) Computational approaches to protein ligand interactions: protein–heme complexes. In Liljefors,T., Jørgensen,F.S. and Krogsgaard-Larsen,P. (eds), Rational Molecular Design in Drug Research. Alfred Benzon Symposium 42, Munksgaard, Copenhagen, Denmark, pp. 264–279.
- 13.Taroni C., Jones,S. and Thornton,J.M. (2000) Analysis and prediction of carbohydrate binding sites. Protein Eng., 13, 89–98. [DOI] [PubMed] [Google Scholar]
- 14.Fetrow J.S. and Skolnick,J. (1998) Method for prediction of protein function from sequence using the sequence-to-structure-to-function paradigm with application to glutaredoxins/thioredoxins and T1 ribonucleases. J. Mol. Biol., 281, 949–968. [DOI] [PubMed] [Google Scholar]
- 15.Bochner B.R. and Ames,B.N. (1982) Complete analysis of cellular nucleotides by 2-dimensional thin layer chromatography. J. Biol. Chem., 257, 9759–9769. [PubMed] [Google Scholar]
- 16.Hobza P. and poner,J. (1999) Structure, energetics, and dynamics of the nucleic acid base pairs: nonempirical ab initio calculations. Chem. Rev., 99, 3247–3276. [DOI] [PubMed] [Google Scholar]
- 17.Beveridge D.L. and McConnell,K.J. (2000) Nucleic acids: theory and computer simulation, Y2K. Curr. Opin. Struct. Biol., 10, 182–196. [DOI] [PubMed] [Google Scholar]
- 18.Rossmann M.G., Liljas,A., Brändén,C.-I. and Banaszak,L.J. (1975) Evolutionary and structural relationships among dehydrogenases. In Boyer,P.D. (ed.), The Enzymes, vol. 11, Oxidation–Reduction Part A, 3rd Edn. Academic Press, New York, NY, pp. 61–102.
- 19.Schulz G.E. (1992) Binding of nucleotides by proteins. Curr. Opin. Struct. Biol., 2, 61–67. [Google Scholar]
- 20.Hendlich M. (1998) Databases for protein–ligand complexes. Acta Crystallogr., D54, 1178–1182. [DOI] [PubMed] [Google Scholar]
- 21.Ihlenfeldt W.D., Takahashi,Y., Abe,H. and Sasaki,S. (1994) Computation and management of chemical-properties in CACTVS – an extensible networked approach toward modularity and compatibility. J. Chem. Inf. Comp. Sci., 34, 109–116. [Google Scholar]
- 22.Orengo C.A., Michie,A.D., Jones,S., Jones,D.T., Swindells,M.B. and Thornton,J.M. (1997) CATH – a hierarchic classification of protein domain structures. Structure, 5, 1093–1108. [DOI] [PubMed] [Google Scholar]
- 23.Laskowski R.A. (2001) PDBsum: summaries and analyses of PDB structures. Nucleic Acids Res., 29, 221–222. [DOI] [PMC free article] [PubMed] [Google Scholar]
- 24.Bairoch A. and Apweiler,R. (2000) The SWISS-PROT protein sequence database and its supplement TrEMBL in 2000. Nucleic Acids Res., 28, 45–48. [DOI] [PMC free article] [PubMed] [Google Scholar]
- 25.McDonald I.K. and Thornton,J.M. (1994) Satisfying hydrogen-bonding potential in proteins. J. Mol. Biol., 238, 777–793. [DOI] [PubMed] [Google Scholar]
- 26.Allen F.H. and Kennard,O. (1993) 3D search and research using the Cambridge Structural Database. Chem. Des. Automat. News, 8, 31–37. [Google Scholar]
- 27.Lee B. and Richards,F.M. (1971) The interpretation of protein structures: estimation of static accessibility. J. Mol. Biol., 55, 379–400. [DOI] [PubMed] [Google Scholar]
- 28.Mitchell J.B.O., Laskowski,R.A., Alex,A. and Thornton,J.M. (1999) BLEEP- Potential of mean force describing protein–ligand interactions: I. Generating potential. J. Comput. Chem., 20, 1165–1176. [Google Scholar]
- 29.Mitchell J.B.O., Laskowski,R.A., Alex,A., Forster,M.J. and Thornton,J.M. (1999) BLEEP- Potential of mean force describing protein–ligand interactions: II. Calculation of binding energies and comparison with experimental data. J. Comput. Chem., 20, 1177–1185. [Google Scholar]
- 30.Valdar W.S.J. and Thornton,J.M. (2001) Protein-protein interfaces: analysis of amino acid conservation in homodimers. Proteins Struct. Funct. Genet., 42, 108–124. [PubMed] [Google Scholar]
- 31.Altschul S.F., Madden,T.L., Schaffer,A.A., Zhang,J., Zhang,Z., Miller,W. and Lipman,D.J. (1997) Gapped BLAST and PSI-BLAST: a new generation of protein database search programs. Nucleic Acids Res., 25, 3389–3402. [DOI] [PMC free article] [PubMed] [Google Scholar]
- 32.Krahn J.M., Kim,J.H., Burns,M.R., Parry,R.J., Zalkin,H. and Smith,J.L. (1997) Couple formation of an amidotransferase interdomain ammonia channel and a phosphoribosyltransferase active site. Biochemistry, 36, 11061–11068. [DOI] [PubMed] [Google Scholar]
- 33.Tanner J.J., Tu,S.C., Barbour,L.J., Barnes,C.L. and Krause,K.L. (1999) Unusual folded conformation of nicotinamide adenine dinucleotide bound to flavin reductase P. Protein Sci., 8, 1725–1732. [DOI] [PMC free article] [PubMed] [Google Scholar]
- 34.Merritt E.A. and Bacon,D.J. (1997) Raster3D: Photorealistic molecular graphics. Methods Enzymol., 277, 505–524. [DOI] [PubMed] [Google Scholar]
- 35.Novoa J.J., Nobeli,I., Grepioni,F. and Braga,D. (2000) Are all short O-H…O contacts hydrogen bonds? A quantitative look at the nature of O-H…O intermolecular hydrogen bonds. New J. Chem., 24, 5–8. [Google Scholar]
- 36.Luscombe N.M., Laskowski,R.A. and Thornton,J.M. (2001) Amino acid–base interactions: a three-dimensional analysis of protein–DNA interactions at an atomic level. Nucleic Acids Res., 29, 2860–2874. [DOI] [PMC free article] [PubMed] [Google Scholar]