Abstract
Objective
pulse transit time (PTT) varies with blood pressure (BP) throughout the cardiac cycle, yet, because of wave reflection, only one PTT value at the diastolic BP level is conventionally estimated from proximal and distal BP waveforms. The objective was to establish a technique to estimate multiple PTT values at different BP levels in the cardiac cycle.
Methods
a technique was developed for estimating PTT as a function of BP (to indicate the PTT value for every BP level) from proximal and distal BP waveforms. First, a mathematical transformation from one waveform to the other is defined in terms of the parameters of a nonlinear arterial tube-load model accounting for BP-dependent arterial compliance and wave reflection. Then, the parameters are estimated by optimally fitting the waveforms to each other via the model-based transformation. Finally, PTT as a function of BP is specified by the parameters. The technique was assessed in animals and patients in several ways including the ability of its estimated PTT-BP function to serve as a subject-specific curve for calibrating PTT to BP.
Results
the calibration curve derived by the technique during a baseline period yielded bias and precision errors in mean BP of 5.1 ± 0.9 and 6.6 ± 1.0 mmHg, respectively, during hemodynamic interventions that varied mean BP widely.
Conclusion
the new technique may permit, for the first time, estimation of PTT values throughout the cardiac cycle from proximal and distal waveforms. Significance: the technique could potentially be applied to improve arterial stiffness monitoring and help realize cuff-less BP monitoring.
Index Terms: Arterial stiffness, blood pressure (BP)-dependent arterial compliance, cuff-less BP, nonlinear model, pulse transit time (PTT), pulse wave velocity, wave reflection
I. Introduction
Pulse transit time (PTT) is the time delay for the pressure wave to travel between proximal and distal arterial sites. According to the Bramwell–Hill equation, PTT varies with the arterial compliance. Since arterial compliance decreases as blood pressure (BP) increases, PTT is also often inversely correlated with BP. PTT can be estimated simply via the relative timing between proximal and distal waveforms reflecting the arterial pulse. Hence, PTT has proven to be a convenient marker of arterial stiffness [1] and could potentially permit cuff-less BP monitoring [2]–[4].
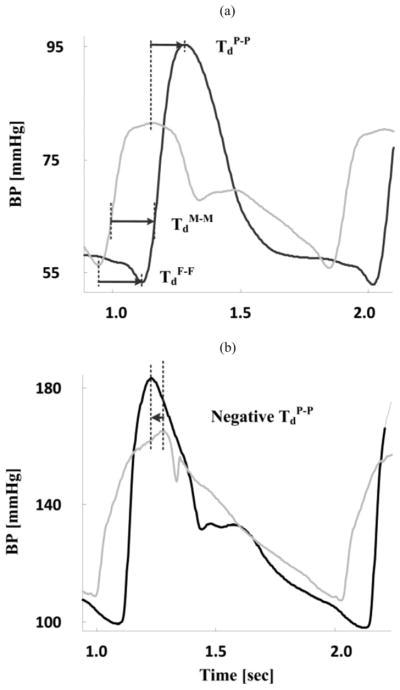
As shown in Fig. 1(a), the conventional technique for estimating PTT is to detect the trough-to-trough or foot-to-foot time delay between the proximal and distal waveforms [TdF - F]. The premise is that arterial wave reflection interference is negligible during late diastole and early systole when the waveform feet occur. Hence, by virtue of being estimated at the waveform feet, conventionally estimated PTT is precisely a marker of arterial stiffness at the level of diastolic BP (DP) and generally correlates best with DP [2]. As again shown in Fig. 1(a), PTT could also be estimated as the time delays between other characteristics points in the waveforms such as the mean level and the peak [TdM-M and TdP-P]. However, because wave reflection interference increases as the cardiac cycle progresses, this naïve technique can yield PTT estimates of little value. For example, as shown in Fig. 1(b), the peak-to-peak time delay can even be negative.
Fig. 1.
Naïve technique for estimation of multiple PTT values at different BP levels in the cardiac cycle from proximal (gray) and distal (black) BP waveforms. (a) PTT at diastolic, mean, and systolic BP (DP, MP, and SP) levels are detected as the foot-to-foot (TdF-F), mean-to-mean (TdM-M), and peak-to-peak (TdP-P) time delays, respectively. TdM-M is specifically determined by identifying the times in the systolic upstrokes of the waveforms that correspond to the MP level and then taking the difference between these times. (b) Peak-to-peak time delay is often not useful. The proximal and distal BP waveforms here were obtained with micromanometer-tipped catheters in the ascending aorta and femoral artery of swine.
It would be desirable to have a technique that reliably estimates multiple PTT values at different BP levels in the cardiac cycle or, more generally, PTT as a function of BP (i.e., a one-to-one mapping from BP to PTT that indicates the PTT value for every BP level). Such a technique could be applied to improve arterial stiffness monitoring and help realize cuff-less BP monitoring.
For arterial stiffness monitoring, the PTT-BP function estimated by the desired technique could enhance cardiovascular risk stratification over a single PTT estimate at the level of DP [5], [6]. In addition, the technique could be used to correct PTT for BP and thereby afford more precise tracking of arterial stiffness in an individual patient over time or more meaningful comparisons of arterial stiffness amongst different patients.
For cuff-less BP monitoring, the desired technique could be used to calibrate PTT (in units of ms) to BP (in units of mmHg). A straightforward approach for constructing a patient-specific curve that relates PTT to BP (i.e., PTT as a function of BP) involves measuring pairs of PTT and BP values in a patient during an experimental perturbation that varies PTT and BP over a significant range. (BP could thereafter be measured in that patient without using a cuff by applying the calibration curve to PTT estimates.) However, the experimental perturbation makes this approach less practical. The desired technique could provide the requisite curve without the need for inducing an artificial BP change (i.e., a “perturbation-less calibration” approach).
In this paper, we propose a technique for estimating PTT as a function of BP from proximal and distal BP waveforms using a nonlinear arterial tube-load model. The model accounts for the BP-dependent arterial compliance and peripheral wave reflection. In this way, multiple PTT values at different BP levels in the cardiac cycle may be estimated after implicit mathematical elimination of the reflected wave. We demonstrate the efficacy of this technique in terms of calibration of PTT to BP in animals subjected to hemodynamic interventions, which perturbed BP over a wide range, and correlation between changes in the multiple PTT estimates and changes in the corresponding BP levels in patients receiving sublingual nitroglycerin, which altered systolic BP (SP) but not DP. A preliminary version of this manuscript has been reported in abbreviated form [7].
II. Methods
The technique proposed herein represents an extension of a previous technique that we introduced to robustly estimate PTT from proximal and distal BP waveforms using a linear arterial tube-load model [8]. We first review this linear arterial tube-load model technique for estimating a single PTT value. We then present the extended nonlinear arterial tube-load model technique for estimating PTT as a function of BP from the same waveforms. We thereafter describe the experimental data and data analysis that we employed to demonstrate the validity of the proposed technique.
A. Linear Arterial Tube-Load Model Technique for Robust Estimation of PTT
This technique is illustrated in Fig. 2 and described in detail elsewhere [8]. The underlying linear model assumes that arterial compliance is constant (for each segment of waveforms for analysis) but accounts for peripheral wave reflection. In this way, the true PTT may be robustly estimated from the entire waveforms, rather than just their feet, after implicit mathematical elimination of the reflected wave.
Fig. 2.
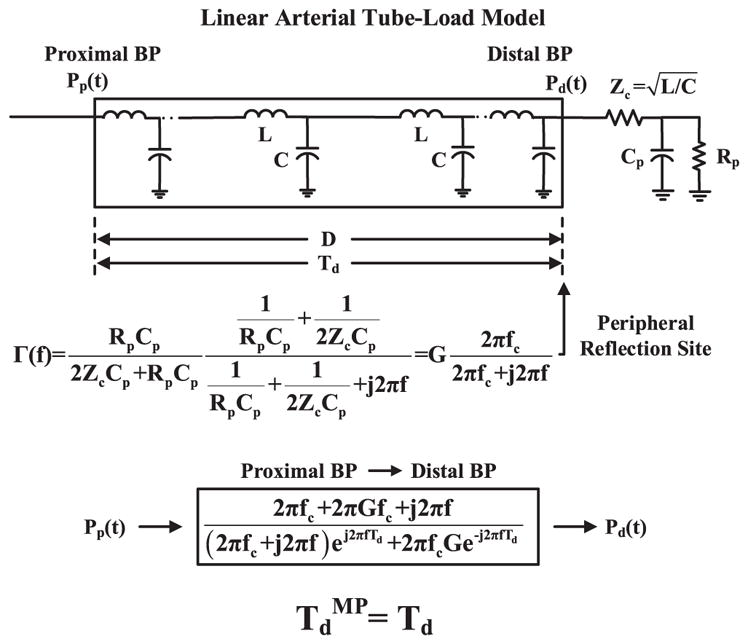
Previous linear arterial tube-load model technique for robust estimation of PTT from proximal and distal BP waveforms [Pp (t) and Pd (t)]. The linear model accounts for peripheral wave reflection but assumes constant arterial compliance (top panel). The parameters [Td (PTT), G (gain of reflection coefficient Γ(f)), fc (Γ(f) cutoff frequency)] are estimated by finding the transfer function that optimally fits Pp (t) to Pd (t) (middle panel). PTT [TdMP] is then given as the Td estimate (bottom panel).
More specifically, the relationship between the measured proximal and distal BP waveforms is modeled with a linear, elastic tube terminated by a lumped parameter load (see top panel of Fig. 2). The tube represents the large artery path for the pressure wave to travel between the two measurement sites. This tube is assumed to be uniform and frictionless [9]. It is mathematically equivalent to an ideal, lossless transmission line (which is the form of the model shown in Fig. 2) and has constant characteristic impedance [ , where L and C are the constant large artery inertance and compliance per unit length] and allows pressure waves to travel with constant PTT between the tube ends [ , where D is the length of the tube]. The load represents the small artery bed distal to the distal measurement site for wave reflection from the periphery (which may often be significantly more pronounced than wave reflection from branching and tapering [9]). This load is characterized by peripheral resistance and compliance [Rp and Cp] while matching the tube impedance at infinite frequency. (Note that wave travel to other small artery beds could be represented by placing similar tube and load combinations in parallel.)
Waves traveling along the tube in the forward direction (left-to-right) are reflected in the backward direction at the load with a frequency-dependent reflection coefficient [ , where and ] in order to mimic arterial wave transmission and peripheral wave reflection. According to the model, a transfer function defined by three unknown parameters [Td, G, fc] relates proximal BP [Pp (t)] to distal BP [Pd (t)] (see middle panel of Fig. 2). (While a model-based transfer function could likewise be defined to relate Pd (t) to Pp (t), this transfer function is noncausal and thus not as indicative of the physiology.) The parameters are estimated such that the Pd (t) segment predicted by applying the transfer function to the measured Pp (t) segment best fits the measured Pd (t) segment in the least squares sense. This optimization is achieved via an exhaustive search over a justifiable range of the parameters. The range is specifically as follows: Td = [0.5 · TdF-F : 2 : 1.5 · TdF-F] ms; G = [0 : 0.025 : 1] unitless, which constitutes the physical range of G; and fc = [0 : 0.1 : 15] Hz, which covers the typical frequency range of BP waveforms. PTT is finally given as the Td estimate (see bottom panel of Fig. 2). This estimate may be most indicative of PTT at the level of mean BP (MP), as it is determined by fitting the entire waveforms to each other. The estimate is thus denoted as TdMP.
B. Nonlinear Arterial Tube-Load Model Technique for Estimation of PTT as a Function of BP
This technique is illustrated in Fig. 3. The technique extends the linear arterial tube-load model technique by making the arterial compliance dependent on BP instead of being constant. The resulting nonlinear arterial tube-load model may thus permit estimation of PTT as a function of BP after implicit mathematical elimination of the reflected wave.
Fig. 3.
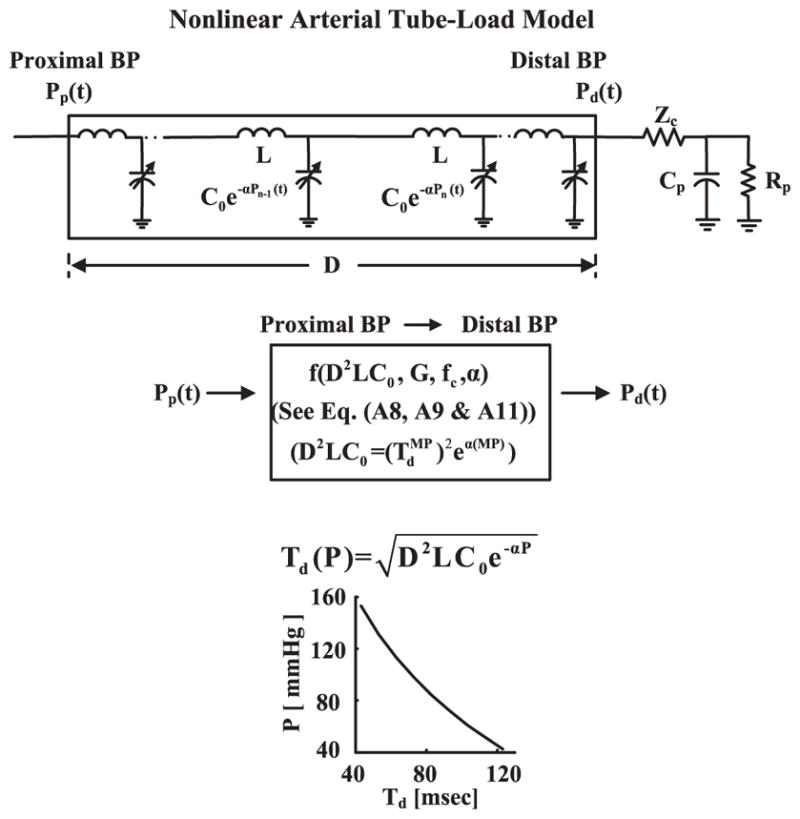
Proposed nonlinear arterial tube-load model technique for estimation of PTT as a function of BP from proximal and distal BP waveforms. The nonlinear model accounts for BP-dependent arterial compliance and peripheral wave reflection (top panel). The parameters [α (degree of BP-dependence), G, fc] are estimated by finding the finite-difference relationship (see the Appendix) that optimally fits Pp (t) to Pd (t) (middle panel). PTT as a function of BP [Td (P)] is then given via the α estimate and D2LC0 (bottom panel). Note that D2LC0 is specified by the α estimate, the estimate via the linear arterial tube-load model technique, and MP (middle panel).
More specifically, the large artery compliance per unit length in the model is dependent on BP according to the following relationship: C(P) = C0e−αP, where P is BP, C0 is the compliance per unit length at zero BP, and α> 0 indicates the extent of the BP dependence on the compliance (see top panel of Fig. 3). This exponential BP-dependent compliance model is based on experimental data [10]. Note that the large artery inertance per unit length L is still assumed to be constant. As outlined in [2] and [11], PTT and BP in the resulting nonlinear, lossless transmission line model are related as follows:
| (1) |
Hence, the model parameters specify a function relating BP to PTT [Td (P)]. All unknown parameters are estimated from the proximal and distal BP waveforms as follows.
Since the model is nonlinear, it cannot represent the relationship between the proximal and distal BP waveforms with a transfer function. A finite-difference method is thus used to relate the waveforms (see the Appendix) [12]. The resulting numerical relationship is defined by four unknown parameters [D2LC0, α, G, fc]. This number of parameters may be reduced by one. In particular, the linear arterial tube-load model technique is first applied to the measured waveforms to estimate TdMP, and MP is determined. This pair of values is then substituted into (1) (i.e., Td(P) = TdMP and P = MP) to constrain D2LC0 entirely by the value of α. Hence, three unknown parameters [α, G, fc] remain for estimation (see middle panel of Fig. 3). The parameters are estimated such that the Pd (t) segment predicted by applying the finite-difference relationship to the measured Pp (t) segment best fits the measured Pd (t) segment in the least squares sense. The optimization is likewise achieved via an exhaustive search over a wide range of the parameters. This range is specifically as follows: α = [0 : 0.001 : 0.05]mmHg−1, which generously encompasses the nominal α value of 0.016 – 0.018mmHg−1 [10]; G = [0 : 0.025 : 1] unitless; and fc = [0 : 0.1 : 15] Hz. PTT as a function of BP is finally given as (1) equipped with the α and D2LC0 estimates (see bottom panel of Fig. 3). This technique was implemented in MATLAB on a desktop computer with 8, 2.5 GHz processors.
The proposed technique has two potential applications. One is cuff-less BP monitoring. In particular, the resulting PTT-BP function could be used as a patient-specific curve for calibrating subsequent PTT estimates of a conventional technique to BP. Note that, unlike the proposed technique, conventional techniques nominally do not require any BP information; rather, they can estimate a single PTT value at the level of DP or MP (see Table II) from any pair of proximal and distal waveforms indicative of the arterial pulse. In this way, cuff-less BP monitoring may be achieved (after deriving the PTT-BP function). Another application is arterial stiffness monitoring wherein proximal and distal BP waveforms are readily available (see Section IV). For example, DP, MP, and SP may be substituted into the PTT-BP function to yield PTT estimates at the three different BP levels (see step 2 in Fig. 4). These multiple PTT estimates may provide more information about arterial stiffness than the single PTT estimates obtained by the conventional foot-to-foot detection technique [1] and thereby enhance cardiovascular risk stratification.
TABLE II.
Summary of Investigated Techniques for Estimating PTT From Proximal and Distal BP Waveforms
| Technique | Capabilities | Limitations |
|---|---|---|
| Foot-to-foot detection [TdF-F in Fig. 1(a)] | Estimates a single PTT value at the level of DP [TdF-F] (proven cardiovascular risk factor) | Cannot output a PTT-BP calibration curve or track multiple BP levels |
| Naïve [see Fig. 1(a)] | Estimates multiple PTT values at different BP levels in the cardiac cycle [TdF-F, TdM-M, TdP-P] | Ignores wave reflection and can thus be erroneous [see Fig. 1(b)] |
| Linear arterial tube-load model (Fig. 2 [8]) | Robustly estimates a single PTT value at the level of MP [TdMP] by modeling wave reflection | Cannot output a PTT-BP calibration curve or track multiple BP levels |
| Nonlinear arterial tube-load model (Fig. 3) | Estimates PTT as a function of BP [Td (P)] and thus multiple PTT values at different BP levels in the cardiac cycle [Td (DP), Td (MP), Td (SP)] by modeling C(P) and wave reflection | Is computationally expensive |
Td (MP) = TdMP. C(P) is BP-dependent large artery compliance.
Fig. 4.
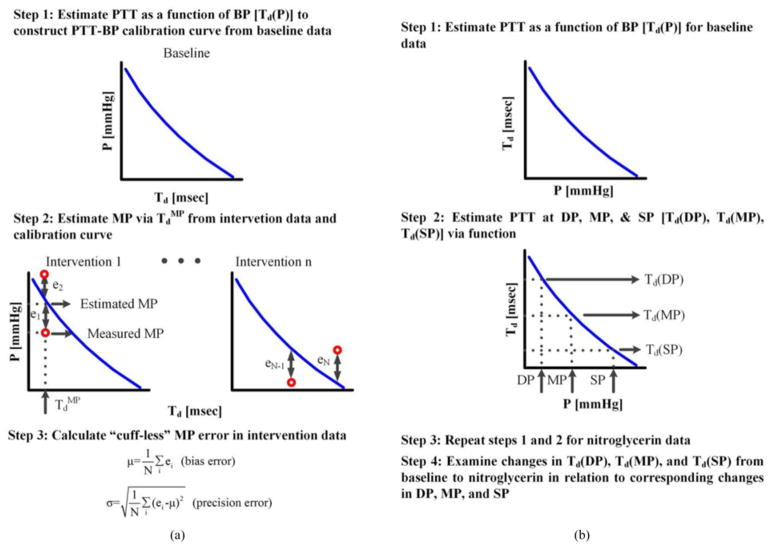
Procedures for assessing the nonlinear arterial tube-load model technique in terms of its ability to (a) calibrate PTT to BP in animals and (b) correlate changes in the PTT values at the levels of DP, MP, and SP with the changes in the corresponding BP levels in patients.
C. Experimental Data
We investigated the proposed technique using animal and patient data that we previously collected. These data are described in detail elsewhere [8], [13], [14]. We mention relevant aspects of the data below.
The animal data were obtained under protocols approved by the Michigan State University All-University Committee on Animal Use and Care [8]. These data included invasive aortic and femoral artery BP waveforms (via micromanometer-tipped catheters) sampled at 500 Hz from 12 healthy adult beagles (10–12 kg) during a baseline period and two to four hemodynamic interventions (among low and high rate cardiac pacing, dobutamine, esmolol, verapamil, phenylephrine, vasopressin, nitroglycerin, norepinephrine, xylazine, saline, hemorrhage) for a duration of about 1200 min in total. The effect of each of these interventions on BP is summarized in [14]. Table I shows the group average (mean over the subjects ± SE over the subjects) range of DP, MP, and SP induced by the interventions and the group average correlation coefficients between pairs of the three BP levels. DP, MP, and SP each ranged over 60–101 mmHg in each animal on average (see y-axes of Fig. 6 for visual illustration of the MP range in each subject). Hence, all BP levels varied widely. Further, the correlation coefficients between each pair of BP levels were 0.84–0.96 in each animal on average. Hence, the BP levels varied similarly (i.e., DP, MP, and SP generally followed each other over time).
TABLE I.
Group Average (Mean ± SE) BP Statistics
| Animal data | BP range (minimum–maximum) [mmHg] | ||
|---|---|---|---|
| DP | MP | SP | |
| 39 ± 2 – 99 ± 8 | 52 ± 2 – 125 ± 9 | 72 ± 4 – 173 ± 11 | |
|
| |||
| Correlation coefficient | |||
| DP and MP | DP and SP | MP and SP | |
| 0.96 ± 0.02 | 0.84 ± 0.06 | 0.94 ± 0.02 | |
|
| |||
| Patient data | BP level [mmHg] | ||
| DP | MP | SP | |
| Baseline | 70 ± 1 | 97 ± 2 | 141 ± 2 |
| Nitroglycerin | 69 ± 2 | 88 ± 2 | 124 ± 2 |
The BP range in animals was elicited by various hemodynamic interventions (see [14]). DP is diastolic BP; MP, mean BP; SP, systolic BP.
Fig. 6.
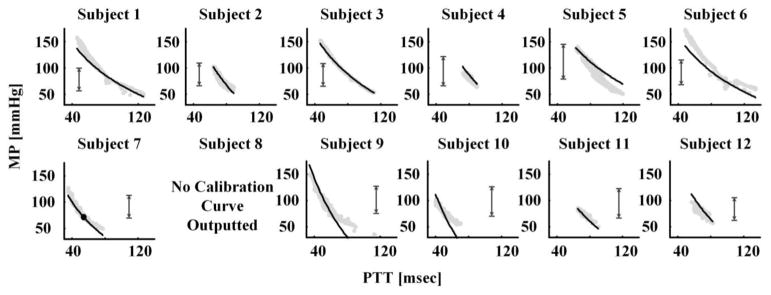
Calibration curves (black lines) derived by the nonlinear arterial tube-load model technique during the baseline period along with pairs of PTT estimated by the linear arterial tube-load model technique and measured MP (gray dots) during the hemodynamic interventions. The vertical arrows indicate the baseline BP range utilized to derive the calibration curves.
The patient data were obtained under a protocol approved by the Taipei Veterans General Hospital Institutional Review Board [13]. These data were deidentified and included invasive aortic and brachial artery BP waveforms (via micromanometer-tipped catheters) sampled at 500 Hz from 54 cardiac catheterization patients (66 ± 13 years; 81% male; clinical diagnoses of mainly hypertension (59% of patients), coronary artery disease (59%), dyslipidemia (31%), and/or diabetes (22%)) before and after sublingual nitroglycerin administration for a duration of about 50 min in total. Table I also shows the group average of DP,MP, and SP during the baseline period and nitroglycerin administration. SP, but not DP, was altered by the intervention. Hence, the BP levels varied differently but much less than in the animal data.
D. Data Analysis
We analyzed the experimental data to assess the proposed technique and competing techniques in three ways. Table II summarizes the considered techniques, while Fig. 4 illustrates procedures for evaluating the techniques. Details follow.
First, we assessed the proposed technique in terms of its ability to improve the fit of the distal BP waveform over the linear arterial tube-load model technique. We used both the animal and patient data for this assessment. We computed the root-mean-squared-error (RMSE) between the estimated and measured distal BP waveforms for both techniques. We also computed the same RMSE value for the linear arterial tube-load model technique, as implemented with a finite-difference method instead of the transfer function, to determine the impact of using the numerical method. We then compared the RMSE values of the techniques using paired t-tests. Ap < 0.0167 (= 0.05/3) was considered significant based on Bonferroni correction for the three pairwise comparisons.
Second, we assessed the proposed technique in terms of its ability to calibrate PTT to BP [see Fig. 4(a)]. We used the baseline period data to construct the calibration curve and the hemodynamic intervention data to test the curve. We employed the animal data here, because the hemodynamic interventions varied BP enough to offer a meaningful assessment (see Table I). In particular, we applied the nonlinear arterial tube-load model technique to the proximal and distal BP waveforms from the baseline period of each subject to estimate PTT as a function of BP and thereby create subject-specific calibration curves. We then applied the linear arterial tube-load model technique to the proximal and distal BP waveforms from the hemodynamic interventions to estimate PTT. Note that we chose this technique to estimate PTT here over other potential techniques (e.g., foot-to-foot detection technique), because 1) it robustly estimates PTT at the level of MP; and 2) MP (as opposed to DP and SP) during the interventions would more likely fall within the baseline BP range used to construct the calibration curves. We next applied the resulting PTT values for a subject to the calibration curve for that subject to estimate MP during the interventions. We finally computed the bias error (μ) and precision error (σ) between the estimated and measured MP.
Note that the nonlinear arterial tube-load model technique can yield a nearly constant PTT (i.e., essentially independent of BP). For example, if elastin dominates arterial wall mechanics such that the operating point of the arterial pressure–volume relationship is in the linear regime (which could occur in young, hypotensive subjects) [2], then the estimated PTT-BP function by the technique may be equivalent to a relatively constant PTT. As another example, if pulse pressure is small (i.e., BP does not change much over the cardiac cycle) such that the arterial pressure–volume relationship can be linearized, then the estimated PTT-BP function may likewise be equivalent to a relatively constant PTT. However, a constant PTT, which is a single PTT value, is of no value in calibration (see Table II). Hence, if the proposed technique does not significantly reduce the RMSE between the estimated and measured distal BP waveform relative to the linear arterial tube-load model technique (which assumes a single PTT value) for a given subject, then a calibration curve will not be outputted for that subject.
For comparison, we likewise assessed the naïve technique of Fig. 1(a). In particular, we applied this technique to the proximal and distal BP waveforms from the baseline period to estimate TdF-F, TdM-M, and TdP-P. We then measured DP, MP, and SP during the same period and fitted an exponential function (Td = Ae−αP) to the three data pairs so as to create subject-specific calibration curves. We next applied the same technique to the proximal and distal BP waveforms from the hemodynamic interventions to estimate TdM-M only. Finally, we similarly applied the resulting PTT values to the corresponding calibration curves to estimate MP and then computed the bias and precision errors. Note that other possible implementations of the naïve techniques yielded larger errors (results not shown).
Third, we assessed the proposed technique in terms of the validity of its multiple PTT estimates. Since we did not have reference arterial stiffness measurements (see Section IV), we specifically evaluated how well changes in its PTT values at the levels of DP, MP, and SP correlated with changes in the corresponding BP levels [see Fig. 4(b)]. We employed the patient data here, because sublingual nitroglycerin changed the BP levels differently enough to offer an interesting assessment (see Table I). By contrast, in the animal data, the interventions happened to change the BP levels similarly (see Table I) such that even a single PTT value could reasonably track all three BP levels. We first applied the nonlinear arterial tube-load model technique to the proximal and distal BP waveforms to estimate PTT as a function of BP. We then substituted the measured DP, MP, and SP into this function to estimate PTT at the three BP levels [Td(DP), Td(MP), Td(SP)] [see step 2 in Fig. 4(b)]. We next examined the changes in these PTT estimates induced by the intervention in relation to the corresponding changes in the measured BP levels, again using paired t-tests and a significance level of p < 0.0167. Since PTT and BP are inversely related, changes in PTT and changes in BP should also be inversely related. For comparison, we likewise assessed the PTT estimates of the naïve technique.
Note that we applied all of the techniques to 15-s segments of the proximal and distal BP waveforms. For the naïve technique, we averaged the beat-to-beat time delays over the 15-s segments to yield single estimates of TdF-F, TdM-M, and TdP-P for each segment. We applied the linear and nonlinear arterial tube-load model techniques to the entire 15-s segment of the waveforms (rather than to individual beats) to yield single estimates of TdMP and Td (P), respectively. We computed the DP, MP, and SP corresponding to the PTT estimates by, respectively, averaging the feet, all samples, and the peaks of the distal BP waveform over the 15-s segments.
III. Results
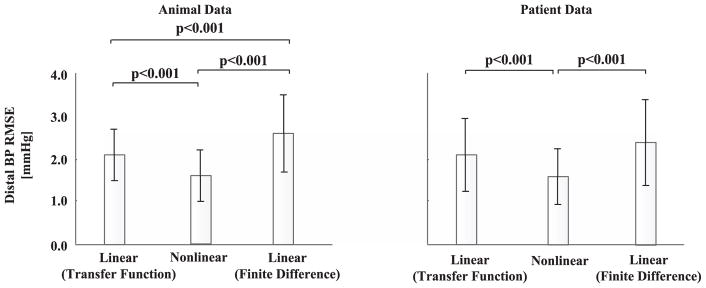
Fig. 5 shows the group average of the RMSE between the distal BP waveforms measured and estimated by the nonlinear and linear arterial tube-load model techniques for the animals during the baseline period and patients. The RMSE values were similar for the animals and patients. Overall, the proposed technique reduced the RMSE by 0.5 and 1.0 mmHg compared to the linear arterial tube-load model technique, as implemented with a transfer function and finite-difference method, respectively. These absolute RMSE reductions were significant in the statistical sense and amounted to 24% and 35% reductions in the relative sense. Although the proposed technique is based on a nonlinear model, it fitted the distal BP waveform using the same number of adjustable parameters as the linear arterial tube-load model technique while also being subject to numerical error introduced by the finite-difference method. In this light, the proposed technique may have afforded a meaningful improvement in the distal BP fitting.
Fig. 5.
Group average (mean ± SE) of the RMSE between the distal BP waveforms measured and estimated by the nonlinear and linear arterial tube-load model techniques. p < 0.0167 is statistically significant.
Fig. 6 shows the calibration curves derived by the nonlinear arterial tube-load model technique for each animal during the baseline period. This figure also includes pairs of PTT estimated by the linear arterial tube-load model technique and measured MP during the hemodynamic interventions (i.e., data not seen by the calibration curve). In one subject, the RMSE between the estimated and measured distal BP waveform was only 2% smaller than that obtained by the linear arterial tube-load model technique as implemented with the finite-difference method. Hence, the proposed technique did not output a calibration curve for this subject. Note that this technique achieved an RMSE reduction of at least 30% in every other subject and thereby produced testable calibration curves in these subjects. As expected, the correspondence between the calibration curve and the PTT-MP pairs was generally the best for the BP range used to generate the curve (indicated with vertical arrows). Table III shows the bias and precision errors between the MP estimated by applying the PTT estimates from the linear arterial tube-load model technique to the calibration curve and the measured MP for each subject during the hemodynamic interventions. The group average bias and precision errors were 5.1 ± 0.9 and 6.6 ± 1.0 mmHg, respectively. Hence, overall, the proposed technique was able to generate useful calibration curves. However, there was appreciable dispersion in the bias and precision errors per subject. The reason may be due more to the variance in the data (e.g., the BP ranges during the baseline period and interventions varied greatly between subjects as shown in Fig. 6) than the variance generated by the technique.
TABLE III.
MP Bias (μ, mmHg) and Precision (σ, mmHg) Errors for the Calibration Curves Derived by the Nonlinear Arterial Tube-Load Model Technique
| Animal | 1 | 2 | 3 | 4 | 5 | 6 | Mean ± SE |
|---|---|---|---|---|---|---|---|
| μ | 6.6 | 0.7 | 0.7 | 7 | 8.8 | 9.1 | μ |
| σ | 8.6 | 3.9 | 2.7 | 3 | 9.4 | 10.1 | 5.1 ± 0.9 |
|
| |||||||
| Animal | 7 | 8 | 9 | 10 | 11 | 12 | |
| μ | 4.8 | * | 3.7 | 5 | 2.2 | 7.2 | σ |
| σ | 4.3 | * | 11.3 | 11 | 2.7 | 5.1 | 6.6 ± 1.0 |
These values precisely represent the mean and standard deviation of the vertical distances between the black lines and gray dots in Fig. 6.
indicates no calibration curve outputted by the technique.
The naïve technique yielded a nonphysiologic calibration curve (i.e., PTT and BP were positively related) for one subject. For the remaining 11 subjects, the group average bias and precision errors were 6.9 ± 1.6 and 10.2 ± 2.6 mmHg, respectively. The naïve technique yielded large errors in three of the subjects (RMSE of about 20 mmHg or greater) while showing comparable errors to the proposed technique in the other eight subjects on average (results not shown). Hence, the naïve technique was not able to provide useful calibration curves as consistently as the proposed technique.
Fig. 7(a) shows the group average of the changes in DP, MP, and SP induced by sublingual nitroglycerin administration in the patients. SP decreased the most, followed by MP, and then DP. These differences were statistically significant (as per pairwise, paired t-tests of the three BP levels with Bonferroni correction). Fig. 7(b) shows the group average of the nitroglycerin-induced changes in PTT at the levels of DP, MP, and SP estimated by the nonlinear arterial tube-load model technique [Td(DP), Td(MP), Td(SP)]. Td(SP) increased the most, followed by Td(MP), and then Td(DP). These differences were also statistically significant (as per pairwise, paired t-tests of the three PTT estimates with Bonferonni correction). (Note that nitroglycerin causes smooth muscle relaxation in addition to BP changes, which may have caused Td(DP) to increase despite little decrease in DP.) Hence, the changes in the three PTT estimates of the technique showed a physiologic, inverse relationship with the changes in the corresponding BP levels on average [compare Fig. 7(a) and (b)]. In this sense, the proposed technique was able to track the three differently varying BP levels. Fig. 7(c) shows the group average of the corresponding changes in PTT estimated by the naïve technique of Fig. 1(a) [TdF-F, TdM-M, TdP-P]. The increase in TdP-P was not statistically different from the changes in TdF-F and TdM-M (as per the same statistical tests). Hence, the naïve technique was not able to track the three BP levels as well as the proposed technique.
Fig. 7.
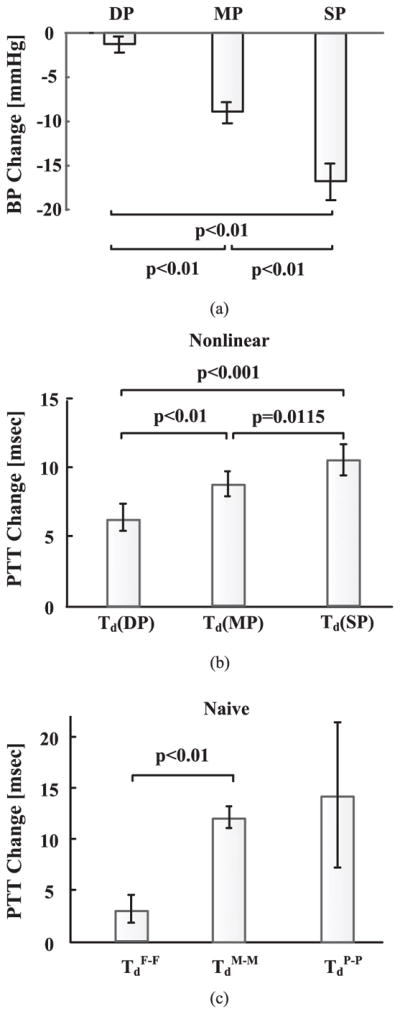
Group average of (a) nitroglycerin-induced BP changes and corresponding PTT changes estimated by (b) nonlinear arterial tube-load model and (b) naïve [see Fig. 1(a)] techniques in patients.
Finally, note that the validated nonlinear arterial tube-load model technique yielded group average baseline PTT estimates at the levels of DP and SP of 81.3 ± 5.6 and 52.3 ± 3.3 ms for the animals and 57.9 ± 2.1 and 39.2 ± 1.5 ms for the patients. The corresponding group average distal pulse pressures were 56 ± 3 mmHg for the animals and 71 ± 2 mmHg for the patients.
IV. Discussion
PTT varies with BP throughout the cardiac cycle, yet, because of wave reflection, only one PTT value at the level of DP is conventionally estimated from proximal and distal arterial waveforms (see Fig. 1). We developed a technique to estimate PTT as a function of BP from proximal and distal BP waveforms using a nonlinear arterial tube-load model (see Fig. 3). This model accounts for the BP-dependent arterial compliance (which makes it nonlinear) and the main wave reflection site at the periphery. Through finite differencing (see the Appendix), the model provides a relationship from the proximal BP waveform to the distal BP waveform in terms of four unknown parameters. One parameter is effectively determined by first applying a linear arterial tube-load model technique to the waveforms (see Fig. 2). The remaining three parameters are then estimated so as to optimally couple or fit the proximal BP waveform to the distal BP waveform through the finite-difference relationship. PTT as a function of BP is finally specified by the parameter estimates. In this way, multiple PTT values at different BP levels in the cardiac cycle may be estimated after implicit mathematical elimination of the reflected wave.
The proposed nonlinear arterial tube-load model technique could potentially be applied to improve arterial stiffness monitoring and help realize cuff-less BP monitoring. For the former application, the technique may offer a marker of arterial stiffness at both DP and SP levels, which could enhance cardiovascular risk stratification [5], [6], and permit correction of PTT estimates for the BP level. For the latter application, the technique may afford a patient-specific curve to calibrate PTT to BP by exploiting the natural pulsatile variation in BP rather than employing an inconvenient and possibly unsafe experimental perturbation to vary BP.
We investigated the proposed technique using proximal and distal BP waveforms from 12 animals whose BP levels varied widely but similarly and 54 cardiac catheterization patients whose BP levels varied differently but to a much less extent (see Table I). The proximal BP waveforms were from the aorta, while the distal BP waveforms were from the femoral artery for the animals and brachial artery for the patients. However, the waveforms could likely have been from other arterial sites that are proximal and distal to each other. We analyzed these data to assess the proposed technique in terms of its ability to fit the distal BP waveform, calibrate PTT to BP, and track multiple BP levels (see Fig. 4). For comparison, we likewise tested competing techniques including the naïve technique of Fig. 1(a), which ignores wave reflection to estimate multiple PTT values via time delays at different BP levels (see Table II).
The proposed technique fitted the distal BP waveforms well for both the animal and patient data (see Fig. 5). Further, it often improved the fitting compared to the linear arterial tube-load model technique in which the underlying model assumes that the arterial compliance is constant but is otherwise similar (see Fig. 5). While the improvement in fitting was not large, it was achieved using the same number of parameters for the fit.
The proposed technique generated subject-specific calibration curves from the baseline period of the animal data that corresponded reasonably well to the pairs of MP and PTT estimates of the linear arterial tube-load model technique from the hemodynamic intervention periods (see Fig. 6). The bias and precision errors of the “cuff-less” MP measured by applying these PTT estimates to the calibration curves during the hemodynamic interventions were near the AAMI bias and precision limits of 5 and 8 mmHg (see Table III). However, the proposed technique may not always generate a calibration curve. In particular, if the technique does not significantly reduce the distal BP waveform fitting error compared to the linear arterial tube-load model technique, then PTT may be nearly constant. In this case, a useful calibration curve would not be obtained. The proposed technique did not output a calibration curve for one of the 12 animals in this study. Similarly, the naïve technique did not produce a physiologic calibration curve in one of the 12 subjects. However, its bias and precision errors were very large in three of the remaining subjects and thus appreciably higher on average than the proposed technique.
The proposed technique produced PTT estimates at the levels of DP, MP, and SP that, on average, tracked the different DP, MP, and SP changes induced by the hemodynamic intervention in the patient data [see Fig. 7(a) and (b)]. By contrast, the naïve technique could not track the SP changes well via the peak-to-peak time delay or otherwise [see Fig. 7(c)].
We used invasive BP waveforms in this study to provide a laboratory demonstration of the potential of the nonlinear arterial tube-load model technique. In practice, the technique could be applied to noninvasive carotid and femoral BP waveforms via applanation tonometry. These waveforms are commonly measured to obtain conventional single PTT estimates for arterial stiffness monitoring [1]. Hence, the technique could be applied to waveforms that are already being measured to offer more information about arterial stiffness. In addition, after applying the technique to derive a patient-specific calibration curve from the noninvasive BP waveforms, the curve could be used to calibrate subsequent conventional PTT estimates to achieve continuous, noninvasive, and cuff-less BP monitoring. For example, photoplethysmography (PPG) or other conveniently measured arterial waveforms could be obtained from the neck and upper thigh. A single PTT value could then be estimated from these waveforms via a conventional technique such as the foot-to-foot detection technique. This PTT value could finally be applied to the calibration curve to determine DP or MP (depending on the particular conventional technique employed). Note that the calibration curve would have to be updated periodically (e.g., every year) to account for age- and disease-induced changes in PTT. Also note that the noninvasive BP waveforms should be well measured to realize these applications.
There are several limitations of this work. One limitation is that the nonlinear arterial tube-load model technique is computationally expensive. However, the speed of the technique could be substantially increased by estimating the model parameters via a fast local search (e.g., sequential quadratic programming or trust region-reflective method) instead of via the currently employed exhaustive search. Also note that computational complexity may not be a factor for the aforementioned applications, as the technique would only be applied on occasion and need not produce an estimate in real time. Another limitation is that the technique employed a simple (two-parameter) exponential model of the BP-dependent arterial compliance rather than a possibly more realistic (three-parameter) derivative of an arctangent model (see [2, eq. (3)]). However, a simpler BP-dependent compliance model facilitates the speed and perhaps the reliability of the parameter estimation. A third limitation is that the evaluation of the technique did not include reference PTT measurements against which the PTT estimates could be directly compared. The reason is that independent measurement of PTT throughout the cardiac cycle is difficult. We thus demonstrated the accuracy of the multiple PTT estimates indirectly via their ability to track changes in BP.
V. Conclusion
We introduced a technique to estimate PTT as a function of BP from proximal and distal BP waveforms using a nonlinear arterial tube-load model. The model accounts for the BP-dependent arterial compliance and peripheral wave reflection. In this way, multiple PTT values at different BP levels in the cardiac cycle may be estimated after implicit mathematical elimination of the reflected wave. Excluding the naïve technique of Fig. 1(a), we are not aware of any other technique in the literature that is able to estimate PTT values throughout the cardiac cycle from a pair of arterial waveforms. We applied the nonlinear arterial tube-load model technique to invasive BP waveforms from animals and patients and showed that the estimated PTT-BP function could be used as a subject-specific curve for calibrating PTT to BP and that the estimated PTT at DP, MP, and SP levels could track the corresponding BP levels. These results suggest that the technique could potentially be used to help realize cuff-less BP monitoring and improve arterial stiffness monitoring. Future studies of the technique should assess its performance as applied to non-invasive BP waveforms and determine if the estimated PTT-BP function can afford an arterial stiffness marker of clinical value superior to conventional single PTT estimates. In addition, subsequent efforts aiming to extend the technique for estimation of multiple PTT values from waveforms that are more easily measured than BP waveforms (e.g., PPG waveforms) may be worthwhile. Such an extended technique would allow for PTT-based cuff-less monitoring of SP in addition to DP.
Acknowledgments
This work was supported in part by the National Institutes of Health under Grant EB-018818.
Biographies

Mingwu Gao received the B.S. degree from Chu Kochen Honors College, Zhejiang University, Hangzhou, China, in 2007, the M.S. degree from Ohio State University, Columbus, OH, USA, in 2008, and the Ph.D. degree from Michigan State University, East Lansing, MI, USA, in 2016, all in electrical engineering.
He was an Electrical Engineer from 2009 to 2010; completed internships in Real Time Embedded System Lab at GE Global Research, Niskayuna, NY, in 2012, and at Retia Medical LLC, East Lansing, from 2013 to 2014. He is currently a Scientist at Philips Connected Sensing Venture, Andover, MA, USA. His research interests include biomedical signal processing, patient monitoring, hemodynamic modeling, and ubiquitous computing technology.

Hao-Min Cheng received the M.D. degree from the Faculty of Medicine, National Yang-Ming University, Taipei, Taiwan, in 2000, and the Ph.D. degree in health sciences from the Faculty of Medicine, The University of Adelaide, Adelaide, SA, Australia, in 2013.
He is a Cardiologist at Taipei Veterans General Hospital, Taipei, with the subspecialty of interventional cardiology and echocardiography. He is currently with National Yang-Ming University, Taipei, where he is an Assistant Professor in the Faculty of Medicine, and joint appointed Assistant Professor in the Institute of Public Health. His research interests include cardiovascular hemodynamics, blood pressure measurements, hypertension management, and evidence-based health care.
Dr. Cheng received an International Postgraduate Research Scholarship from Australian Government and Young Investigator Award from Taiwan Society of Cardiology in 2013. He is an Associate Editor of BMC Cardiovascular Disorders.

Shih-Hsien Sung received the M.D. degree in 2001 and Ph.D. degree in public health in 2014, both from National Yang-Ming University, Taipei, Taiwan.
He has been on the faculty of the Department of Medicine since 2007, where he is currently an Assistant Professor. He completed internal medicine residency training and cardiology fellowship training at Taipei Veterans General Hospital, Taipei, in 2009, where he is currently an Attending Physician. His research interests focus on cardiovascular epidemiology, hemodynamics, vascular aging, heart failure, and pulmonary artery hypertension.

Chen-Huan Chen received the M.D. degree from the Faculty of Medicine, National Yang-Ming University, Taipei, Taiwan, in 1982.
He was a Clinical Research Fellow at Johns Hopkins Hospital, Division of Cardiology, BA, from 1995 to 1997. He has been on the faculty of the Department of Medicine since 1989, where he is currently a Professor. He completed internal medicine residency training and cardiology fellowship training at Taipei Veterans General Hospital, Taipei, in 1990, where he is currently an Attending Physician. His research interests focus on cardiovascular epidemiology, hemodynamics, vascular aging, arterial stiffness, wave reflections, heart failure, and development of new methods for noninvasive assessment of cardiac and vascular functions. His research works have contributed significantly to the understanding and utilization of the generalized transfer function concept and the optimal clinical assessment of the wave reflections.

Nicholas Bari Olivier received the D.V.M. degree in veterinarymedicine from Louisiana State University, Baton Rouge, LA, USA, in 1981, and the Ph.D. degree in physiology from Michigan State University, East Lansing, MI, USA, in 1990.
Since then, he has been on the faculty of the Department of Small Animal Clinical Sciences, College of Veterinary Medicine, Michigan State University, where he is currently an Associate Professor and Chief of clinical cardiology. His research interests include cardiovascular physiology and biomedical engineering, with a specific interest in cardiac electrophysiology as it pertains to arrhythmias.

Ramakrishna Mukkamala (M’02) received the B.S.E. degree in biomedical/electrical engineering from Duke University, Durham, NC, USA, in 1993, and the S.M. and Ph.D. degrees in electrical engineering and computer science from Massachusetts Institute of Technology (MIT), Cambridge, MA, USA, in 1995 and 2000, respectively.
He was a Postdoctoral Fellow/Research Engineer at Harvard-MIT Division of Health Sciences and Technology, Cambridge, from 2000 to 2002. Since then, he has been on the faculty of the Department of Electrical and Computer Engineering, Michigan State University (MSU), East Lansing, MI, USA, where he is currently a Professor. His research interests include biomedical signal processing and identification, modeling of physiologic systems, cardiovascular physiology, and patient monitoring.
Dr. Mukkamala received an American Heart Association Scientist Development Grant, the National Science Foundation CAREER Award, and the MSU Teacher-Scholar Award. He is an Associate Editor of the IEEE Transactions on Biomedical Engineering, the Editor of the Cardiovascular and Respiratory Systems Engineering Theme of the IEEE Engineering in Medicine and Biology Society (EMBS) Conference Proceedings, and a member of the IEEE EMBS Technical Committee on Cardiopulmonary Systems.
Appendix
The governing differential equations of the nonlinear arterial tube-load model of Fig. 3 (top panel) are as follows:
| (A1) |
| (A2) |
| (A3) |
The first two equations govern the transmission line, while the last equation governs the terminal load. P(t, x) and Q̇ (t, x) represent BP and blood flow rate as a function of time [t] and space along the line [x]. They are state variables of the model. The input is Pp (t), and the output is Pd (t).
To solve the nonlinear equations, the transmission line was meshed into N nodes for P and N–1 nodes for Q̇, as shown in Fig. 8. The subscript n is the spatial index, while the superscript k is the temporal index. So, and are Pp (t) and Pd (t), respectively. The distance between adjacent nodes of the same kind is Δx. Eqs. (A1)–(A3) were discretized using this mesh and Euler’s method as follows:
| (A4) |
| (A5) |
| (A6) |
Fig. 8.
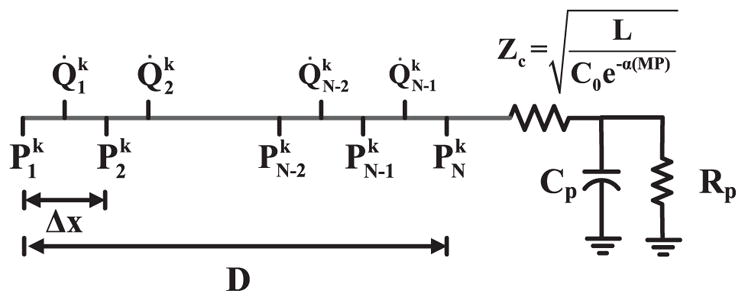
Meshing of the nonlinear arterial tube-load model (top panel of Fig. 3) for numerical solution of the governing model equations. P is BP, while Q̇ is blood flow rate. The superscript k denotes time index, while the subscript N denotes space index.
The number of unknown parameters in the discretized equations may be reduced as follows. First, since Zc represents the characteristic impedance of the transmission line, this parameter was defined as follows:
| (A7) |
Then, substituting (A7) and Δx = D/(N – 1) into (A4)–(A6) and applying some simple manipulations gives the following equations:
| (A8) |
| (A9) |
| (A10) |
Now, RC and ZcC may be expressed in terms of G and fc (see Fig. 2) so that (A10) becomes the following:
| (A11) |
The final discretized model equations are (A8)–(A11). Now, the state variables are P and DLQ̇, and the unknown parameters are D2LC0, α, G, and fc.
For a given set of parameter values and Pp (t) input, these equations were iteratively solved for Pd (t). The iteration commenced with zero initial conditions. Proportional blood flow rate was first solved at all nodes using (A8), and then BP was solved at all nodes using (A9) and (A11). This process was repeated for each successive time step.
The values for N and Δt were chosen to balance accuracy and numerical stability. In particular, Δt was set to 0.02 s, and N was chosen as the largest integer that met the condition: , where Pmax is the maximal BP that can appear on any node during the numerical simulation. This condition enforces the wave speed to not exceed Δx/Δt and is required for a stable solution [12].
Contributor Information
Mingwu Gao, Department of Electrical and Computer Engineering, Michigan State University. He is currently with Philips Connected Sensing Venture.
Hao-Min Cheng, Department of Medicine, School of Medicine, National Yang-Ming University.
Shih-Hsien Sung, Department of Medicine, School of Medicine, National Yang-Ming University.
Chen-Huan Chen, Department of Medicine, School of Medicine, National Yang-Ming University.
Nicholas Bari Olivier, Department of Small Animal Clinical Sciences, Michigan State University.
Ramakrishna Mukkamala, Department of Electrical and Computer Engineering, Michigan State University, East Lansing, MI 48824 USA.
References
- 1.Laurent S, et al. Expert consensus document on arterial stiffness: Methodological issues and clinical applications. Eur Heart J. 2006 Sep;27(21):2588–2605. doi: 10.1093/eurheartj/ehl254. [DOI] [PubMed] [Google Scholar]
- 2.Mukkamala R, et al. Toward ubiquitous blood pressure monitoring via pulse transit time: Theory and practice. IEEE Trans Biomed Eng. 2015 Aug;62(8):1879–1901. doi: 10.1109/TBME.2015.2441951. [DOI] [PMC free article] [PubMed] [Google Scholar]
- 3.Ding X, et al. Continuous cuffless blood pressure estimation using pulse transit time and photoplethysmogram intensity ratio. IEEE Trans Biomed Eng. 2015 Sep;63(5):964–972. doi: 10.1109/TBME.2015.2480679. [DOI] [PubMed] [Google Scholar]
- 4.Solà J, et al. Noninvasive and nonocclusive blood pressure estimation via a chest sensor. IEEE Trans Biomed Eng. 2013 Jul;60(12):3505–3513. doi: 10.1109/TBME.2013.2272699. [DOI] [PubMed] [Google Scholar]
- 5.Hermeling E, et al. Noninvasive assessment of arterial stiffness should discriminate between systolic and diastolic pressure ranges. Hypertension. 2010 Jan;55(1):124–130. doi: 10.1161/HYPERTENSIONAHA.109.143867. [DOI] [PubMed] [Google Scholar]
- 6.Hermeling E, et al. The change in arterial stiffness over the cardiac cycle rather than diastolic stiffness is independently associated with left ventricular mass index in healthy middle-aged individuals. J Hypertension. 2012 Feb;30(2):396–402. doi: 10.1097/HJH.0b013e32834e4b75. [DOI] [PubMed] [Google Scholar]
- 7.Gao M, Mukkamala R. Perturbationless calibration of pulse transit time to blood pressure. Proc Conf IEEE Eng Med Biol Soc. 2012:232–235. doi: 10.1109/EMBC.2012.6345912. [DOI] [PubMed] [Google Scholar]
- 8.Gao M, et al. Improved pulse wave velocity estimation using an arterial tube-load model. IEEE Trans Biomed Eng. 2014 Mar;61(3):848–858. doi: 10.1109/TBME.2013.2291385. [DOI] [PMC free article] [PubMed] [Google Scholar]
- 9.Zhang G, et al. Tube-load model parameter estimation for monitoring arterial hemodynamics. Front Physiol. 2011 Nov;2:1–8. doi: 10.3389/fphys.2011.00072. [DOI] [PMC free article] [PubMed] [Google Scholar]
- 10.Hughes DJ, et al. Measurements of Young’s modulus of elasticity of the canine aorta with ultrasound. Ultrason Imag. 1979;1:356–367. doi: 10.1177/016173467900100406. [DOI] [PubMed] [Google Scholar]
- 11.Remoissenet M. Waves Called Solitons: Concepts and Experiments. Berlin, Germany: Springer-Verlag; 1994. [Google Scholar]
- 12.Lee S, Konrad A. Lossy transmission line transient analysis by the finite element method. IEEE Trans Magn. 1993 Mar;29(2):1730–1732. [Google Scholar]
- 13.Sung S, et al. Measurement of central systolic blood pressure by pulse volume plethysmography with a noninvasive blood pressure monitor. Amer J Hypertension. 2012 May;25(5):542–548. doi: 10.1038/ajh.2011.259. [DOI] [PubMed] [Google Scholar]
- 14.Swamy G, et al. Calculation of forward and backward arterial waves by analysis of two pressure waveforms. IEEE Trans Biomed Eng. 2010 Dec;57(12):2833–2839. doi: 10.1109/TBME.2010.2073467. [DOI] [PubMed] [Google Scholar]


