

Abstract
Diffusion tensor magnetic resonance imaging (DTI) reveals the local orientation and integrity of white matter fiber structure based on imaging multidirectional water diffusion. Group differences in DTI images are often computed from single scalar measures, e.g., the Fractional Anisotropy (FA), discarding much of the information in the 6-parameter symmetric diffusion tensor. Here, we compute multivariate 6D tensor statistics to detect brain morphological changes in 12 blind subjects versus 14 sighted controls. After Log-Euclidean tensor denoising, images were fluidly registered to a common template. Fluidly-convected tensor signals were re-oriented by applying the local rotational and translational component of the deformation. Since symmetric, positive-definite matrices form a non-Euclidean manifold, we applied a Riemannian manifold version of the Hotelling’s T2 test to the logarithms of the tensors, using a log-Euclidean metric. Statistics on the full 6D tensor-valued images outperformed univariate analysis of scalar images, such as the FA and the geodesic anisotropy (GA).
1. Introduction
Detection of systematic patterns of anatomy in brain imaging has become essential to our understanding of disease effects on brain anatomy and function. Unlike other imaging modalities, noninvasive MRI-based measurement of the local water diffusion tensor (DT) in brain tissue can provide vital information on tissue microstructure and composition. DT images can be analyzed to provide 3D images of mean diffusivity, anisotropy and dominant orientation of water diffusion for each imaged voxel in brain tissue. Some brain regions, such as the cortical and subcortical gray matter and cerebrospinal fluid, have largely isotropic diffusivity, as the diffusion process is not heavily constrained by axons running in myelinated fiber tracts. In that case, an overall scalar-valued diffusion measure, such as the trace or mean diffusivity can adequately describe the local characteristics of water diffusion. In the white matter, however, the Fractional Anisotropy (FA) is typically computed from the diffusion tensor eigenvalues, thus providing a single scalar measure at each voxel as an index of specific tissue characteristics. FA is progressively reduced in normal aging and neurodegenerative conditions such as Alzheimer’s disease, as water diffusion becomes less directionally constrained when then myelin sheaths on white matter axons deteriorate. FA is widely used in neuroscientific studies to detect and map disease effects on white matter. Even so, in white matter areas with substantial diffusion anisotropy, multidirectional water mobility can not be described by any single measurement ([5]).
In this paper, we use tensor-valued statistical framework to exploit the information in the full diffusion tensor and identify situations in which this outperforms derived scalar signals for detection of group differences. This question depends on empirical factors such as the noise in each channel of the matrix-valued signals, as well as mathematical factors such as the correct combination and comparison of the tensor components using statistics on associated Lie groups ([20]) such as the symmetric tensor manifold.
Tensor-valued statistics are under rapid development for other types of computational brain imaging studies. Among the many deformation-based approaches for analyzing anatomy, tensor-based morphometry (TBM) computes the spatial derivatives of the deformation fields that match a set of brain images to a common template. When images of many subjects are aligned to the same standard template or atlas, maps of the deformation gradients (Jacobians) can be computed in the atlas coordinate system and group statistics can be computed at each voxel to identify localized group differences in anatomical shape or size.
The standard TBM analysis is performed in on the determinant of the Jacobian matrix, which gives the local volume change recovered by the deformation and thus the directional component of the change is discarded. In [15], the authors retained the local directional parameter of shape change - the eigenvalues of the strain matrix-and performed a manifold version of the Hotelling’s T2 test to obtain statistics on the deformation. This method makes use of the full deformation tensors, but as these tensors do not form a Euclidean vector space, the resulting positive-definite deformation tensors are analyzed using a manifold version of the multivariate statistics. In this paper, we show that comparable statistics on the symmetric tensor manifold can be used to compute statistics on the diffusion tensors, with significant empirical advantages in a neuroscience application (mapping brain structure differences in the blind).
The typical measure of anisotropy is FA which describes the eccentricity of the diffusion when represented as glyph, commonly an ellipsoid. The difference of FA between diseased and control groups is typically used to identify the pathological changes in brain morphology. However, FA is not a valid geodesic measure on the manifold of symmetric positive definite tensors as described in [15]. One measure of anisotropy, derived from metric defined on the tensor manifold, is the Geodesic Anisotropy (GA) introduced by Bachelor et al. ([6]). Here, we used GA, computed in the Log-Euclidean metric defined in Lepore et al. ([15]) as an alternative scalar measure to compare with FA. Like FA, GA is a scalar measure derived from a tensor, but it measures the deviation of a tensor from the zero tensor in the associated log-Euclidean metric. In a sense, GA can be seen as a geodesic distance on the flattened tensor manifold, while FA is just a simple comparison of the tensor eigenvalues. It is an open and important question in DTI analysis which of these metrics has greatest power for detecting clinically relevant differences in groups of tensor-valued images.
While both FA and GA are sensitive scalar measure of directional water diffusion, they still discard information from the reconstructed diffusion tensors that are not used. Eigenvalues of the DT, for example, express the relative rates of diffusion in three principal directions obtained by singular value decomposition. The notion of a valid eigen structure breaks down in cases where fibers cross, and some high-angular resolution diffusion imaging models (HARDI) have been proposed - such as q-ball imaging ([18]), or diffusion spectrum imaging - to overcome this limitation. Even so, in the framework of DTI, several researchers have found that individual eigenvalues may be more specific markers of axonal morphology than other tensor-derived scalar measurement ([11], [16]).
With some caveats regarding fiber crossing, eigenvalue λ1 typically represents the diffusion rate along the principal diffusion direction, where this exists, and eigenvalues of λ2 and λ3 represent diffusion rates in directions perpendicular to the principal direction. The latter two values can indicate demyelination ([1]).
In this work, we analyze and compare the four measurements - the matrix logarithm of the full diffusion tensors (this is a six-parameter matrix), the tensor eigenvalues, and the GA and FA - for a group of 12 blind subjects and 14 matched controls. Since symmetric, positive-definite matrices form a conical subspace of the vector space of matrices, statistics were computed within the Log-Euclidean framework developed in [3], and we used a manifold version of Hotelling’s T2 test as a measure of difference between populations while a Student’s t-test was performed on the scalar statistics.
This approach tackles a general issue in computer vision where pattern classification and statistical inference must be performed on matrix-valued images. Such images arise naturally in brain imaging with DTI, and in the imaging of strain fields in mechanical engineering (e.g. in the flow of foams and in seismic monitoring), and in the analysis of 2D and 3D flows, deformation mappings, and correspondence fields in image processing, as the derivatives of deformation fields are second-rank tensors. Such work in the brain imaging field has been termed tensor-based morphometry ([7], [14], [15], [17]).
2. Methods
3D MPRAGE MRI and DTI scans were acquired from 12 blind subjects and 14 sighted subjects (mean age of 34.5 years; standard deviation (SD) of 10.0 yrs.) A Siemens (Avanto) 1.5 T scanner was used to obtain DTI scans of subjects for the study. A single-shot echo planar (EPI) diffusion tensor sequence with an acquisition time of approximately 40 minutes and 12 gradient directions was used. Full brain axial sections were acquired with 2.5mm slice thickness, and a 128×128 matrix. The imaging parameters were: TR=8000ms, TE=92ms, 2.5 mm slice distance, and 4 averages.
DICOM format diffusion gradient images were converted to tensor components using the software MedINRIA ([9]), and all DT images were denoised with a Log-Euclidean tensor denoising method that eliminates singular or rank-deficient tensors (i.e., negative or zero diffusion eigenvalues) which arise due to acquisition noise but cannot represent a physical diffusion process. After removal of extracerebral tissues, each individual scan was rigidly aligned to a high-resolution single subject average brain MRI scan in ICBM space (the Colin27 brain template, [10]) via a 9-parameter affine registration using the FSL/FMRIB linear image registration tool (FLIRT) algorithm ([12]). A fluid-based 3D registration algorithm ([8]) and described in [15] was used to map each subject’s MP-RAGE MR onto one of the control subjects. To reduce computational time, the source and target images were downsampled using a Hann-windowed sinc kernel [15]. The resulting deformation fields were trilinearly interpolated to restore the warped image to its original resolution.
The deformation fields from the anatomical images were applied to the DT-MR images to map them to the common space. To obtain the right orientation for the DTI tensors, we corrected the orientation of the fluidly-convected tensor signals by applying the local rotational and translational component of the deformation only. The Rotation operator that we applied to DT is described in the next section.
2.1. Handling orientation information
Unlike the case of scalar images, one must ensure that the multidimensional tensor orientations remain consistent with the anatomy after image transformations ([2], [21]).
Both the parameters of the affine registration ([19]) and fluid-based nonlinear registration described in [8] were used to compute the displacement fields and Jacobian matrices to obtain the rotation matrix to correct the orientation of the DT.
Two separate methods were used here to compute the tensor rotations. First, the Finite Strain (FS) method was applied using the transformation matrices M resulting from the affine registration. A preservation of principal direction (PPD) algorithm was then applied to the higher order transformation as described in [2] and [21].
More precisely, to find the rotational component Rr, of the affine transformation, we used
| (1) |
where Q represents the best orthogonal appromination of M.
The relevant reorientation components of the nonlinear transformation (Rn) were computed using (1) Jacobian matrix (J) from the fluid registration with the MP-RAGE MR images, and (2) the principal eigenvector (e1) and secondary eigenvector (e2) computed from DT images, as detailed in [2]:
| (2) |
| (3) |
| (4) |
2.2. Multivariate statistical analysis on the DTI matrices
We applied a Riemannian manifold version of the Hotelling’s T2 test to the logarithms of the tensors, and voxelwise Student’s t-tests to the derived scalar images (GA and FA). In order to apply Hotelling’s T2 test, we need to first compute the geodesic mean and variance matrices from the multi-subject DT data at each voxel. From [15] and [21], in the Log-Euclidean framework the Mahalanobis distance, M, is found to be:
| (5) |
where is the mean of a set of vectors Si,i=1,…,m:
| (6) |
and the covariance is given by
| (7) |
3. Results
We found that, as expected, the Hotelling’s T2 test on the full tensor was more sensitive for detecting differences between populations, including differences that would remain undetected with conventional univariate statistical methods. Group differences between blind subjects and sighted subjects were apparent in broadly distributed brain regions, and diffusely throughout the white matter. Prominent FA deficits were detected in occipital brain regions that house the primary and secondary visual cortices, as well as Meyer’s loop and other thalamostriate pathways that are fundamental to visual-processing in normal subjects, but likely to be developmentally impaired in the blind subjects. Figure 1a displays maps that compared the mean GA of the blind group versus the sighted group, with differences shown as a percentage of the healthy control mean values. Some occipital lobe white matter regions and corpus callosum regions were found to have less anisotropic diffusion for blind versus control subjects.
Figure 1.
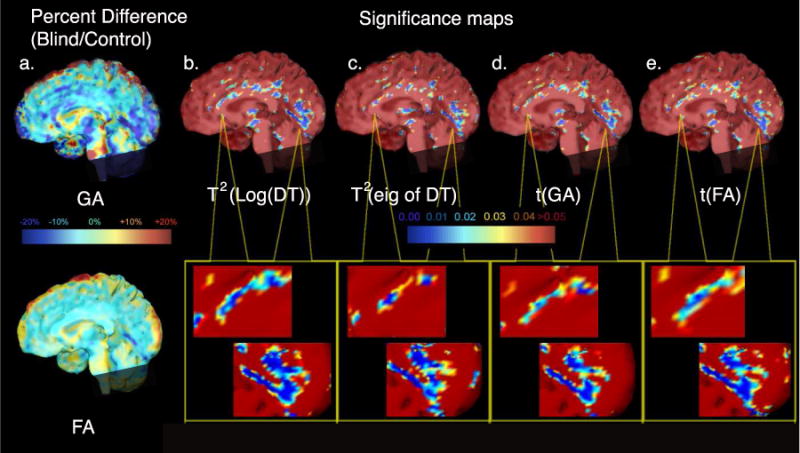
The first column (a) shows ratio maps indicating percent differences in mean GA and FA between groups of blind and sighted subjects. Group differences are indicated as a percentage difference relative to the control group mean at each voxel. Maps (b)–(e) show nonparametric-permutation based p-values derived at each image voxel for the Hotelling’s T2 statistic on the matrix logarithm of the full diffusion tensor, for a Hotelling’s T2 statistic computed on its 3 eigenvalues, treated as a 3-vector, and for a t statistic computed from log (GA) and log(FA). All maps show diffuse differences (largely reductions in diffusion anisotropy) between the blind and control subjects, using different locally derived measures of diffusion.
Figure 1b and 1c show the p-value maps (significance values) from the Hotelling’s T2 statistic computed at each voxel from the matrix logarithm of the full diffusion tensor. These are shown alongside statistical significance maps for tests of group differences in the eigenvalues. Significance maps based on Student’s t tests on the scalar measures, GA and FA, are also mapped in Figure 1d and 1e. The effect sizes, as inferred from the significance maps, were numerically greater for the matrix logarithms of the DT versus the tests of the eigenvalues alone. Differences in the scalar GA and FA measures showed lesser effect sizes, regionally and in general, compared to the differences detected with the multivariate statistics. Minimal differences were observed when comparing the two scalar measures to each other.
Figure 2 illustrates the cumulative distribution function (CDF) of the p-values for the four different scalar and multivariate statistics including the T2 statistics on the tensor logarithms, and t statistics on the eigenvalues, GA and FA of the diffusion tensor. The null distribution, which represents the expected CDF if no group difference were present, is indicated by the solid line, for comparison. The degree of difference between null distribution and the empirical cdf curve for each statistic is a reasonable measure of the effect size of each derived index, as it reflects the extent and distribution of voxels with different significance levels. As expected, the multivariate tests yielded significance CDFs that rose faster and more sharply than the univariate statistics indicating greater effect sizes for the detection of group differences.
Figure 2.
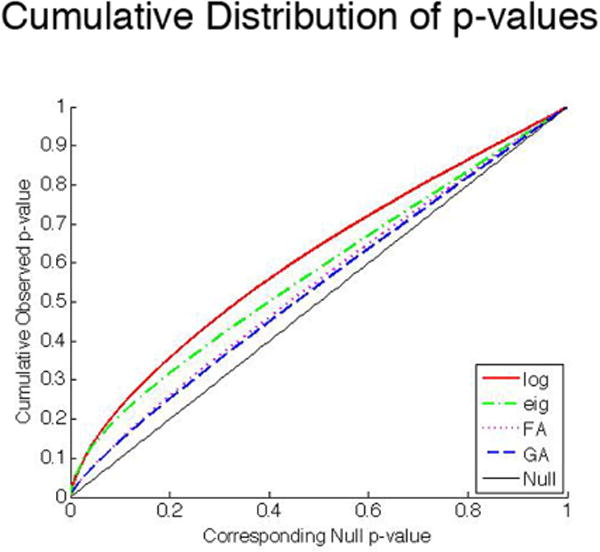
Cumulative distribution plots of p-values. Each graph shows a cumulative distribution function (CDF) plot for the scalar and multivariate statistics and compares them with the null distribution (represented by a solid diagonal line).
Figure 2 also illustrates that, even when using multivariate statistics, the cumulative distribution of p-values from the 6 variables of the full tensor, computed in the Log-Euclidean framework, yields a more steeply rising p-value curve than based on the 3 eigenvalues, treated as a trivariate vector of observations.
4. Discussion
Here we showed that statistics on the full tensor manifold in DTI provided additional power, in some cases for detecting differences in brain morphology between diseased and control groups. Using plots of cumulative distribution functions, estimates of false discovery rates (FDR) and permutation testing on a range of tensor-derived signals, we found that all measures largely agreed in the localization of distributed brain structure differences between blind subjects and controls. These results are consistent with the neuroscientific literature on developmental brain changes and experience-dependent plasticity in subjects with prolonged sensory deprivation or dysfunction. The main contribution of this work is to motivate the use of multivariate, and especially log-Euclidean, methods in the analysis of tensor-valued images. Rather than reducing the rank of the tensor by algebraically combining its scalar components or comparing its eigenvalues, analysis of the full second-rank diffusion tensor is sensitive to group differences in fiber orientations and differences in directional diffusion that are appropriately calibrated with respect to the noise in each channel. As such, the approach is comparable to other pattern classification and discriminant analysis methods in computer vision, where the classifier function is built from a feature set, and the covariance matrix of all features is computed in an appropriate space, prior to dimension reduction and inference. The Hotelling’s T2 tests used here are one of many multivariate statistics that could be applied to the tensors in the log-Euclidean manifold. Geodesic principal component analysis, in the group of image diffeomorphisms ([4], [13]), is an alternative approach for analyzing variation in the non-Euclidean shape spaces that commonly arise in computational anatomy. Ongoing work, by our group and others, is focusing on whether the tensors have an underlying lower-dimensional manifold structure that can be learned for purposes of abnormality detection, or, conversely, whether even higher-order diffusion models (such as HARDI or hybrid diffusion imaging) provide additional benefit for disease classification and characterization. The results of these analysis efforts will depend on both empirical and logistical factors, such as the signal to noise available when sampling the orientation-dependent diffusion function in DTI, and mathematical factors, such as the most efficient spectral or statistical representation of the multidimensional diffusion processes.
References
- 1.Arfanakis K, Haughton VM, Carew JD, Rogers BP, Dempsey RJ, Meyerand ME. Diffusion tensor MR imaging in diffuse axonal injury. American Journal of Neuroradiology. 2002;23:794–802. [PMC free article] [PubMed] [Google Scholar]
- 2.Alexander DC, Pierpaoli C, Basser PJ, Gee JC. Spatial transformations of diffusion tensor magnetic resonance images. IEEE Trans Med Imag. 2001;20(11):1131–1139. doi: 10.1109/42.963816. [DOI] [PubMed] [Google Scholar]
- 3.Arsigny V, Fillard P, Pennec X, Ayache N. Log-Euclidean metrics for fast and simple calculus on diffusion tensors. Magnetic Resonance in Medicine. 2006;56:411–421. doi: 10.1002/mrm.20965. [DOI] [PubMed] [Google Scholar]
- 4.Avants B, Gee JC. Geodesic estimation for large deformation anatomical shape averaging and interpolation. Neuroimage. 2004;23(1):S139–150. doi: 10.1016/j.neuroimage.2004.07.010. [DOI] [PubMed] [Google Scholar]
- 5.Basser PJ, Jones DK. Diffusion-tensor MRI: theory, experimental design and data analysis- a technical review. NMR Biomedicine. 2002;15:456–467. doi: 10.1002/nbm.783. [DOI] [PubMed] [Google Scholar]
- 6.Batchelor P, Moakher M, Atkinson D, Calamante F, Connelly A. A rigorous framework for diffusion tensor calculus. Magnetic Resonance in Medicine. 2005;53:221–225. doi: 10.1002/mrm.20334. [DOI] [PubMed] [Google Scholar]
- 7.Chiang MC, Dutton RA, Hayashi KM, Toga AW, Lopez OL, Aizenstein HJ, Becker JT, Thompson PM. 3D Pattern of Brain Atrophy in HIV/AIDS Visualized using Tensor-Based Morphometry. NeuroImage. 2006 Oct 9; doi: 10.1016/j.neuroimage.2006.08.030. [DOI] [PMC free article] [PubMed] [Google Scholar]
- 8.Christensen G, Rabbitt R, Miller M. Deformable templates using large deformation kinematics. IEEE Trans Image Process. 1996;5:1435–1447. doi: 10.1109/83.536892. [DOI] [PubMed] [Google Scholar]
- 9.Fillard P, Arsigny V, Pennec X, Ayache N. Clinical DT-MRI Estimation, Smoothing and Fiber Tracking with Log-Euclidean Metrics. IEEE Transactions on Medical Imaging. 2006:786–789. doi: 10.1109/TMI.2007.899173. [DOI] [PubMed] [Google Scholar]
- 10.Holmes CJ, Hoge R, Collins L, Woods R, Toga AW, Evans AC. Enhancement of MR images using registration for signal averaging. J Comput Assist Tomogr. 1998;22:324–333. doi: 10.1097/00004728-199803000-00032. [DOI] [PubMed] [Google Scholar]
- 11.Gulani V, Webb AG, Duncan ID, Lauterbur PC. Apparent diffusion tensor measurements in myelin-deficient rat spinal cords. Magnetic Resonance in Medicine. 2001;45:191–195. doi: 10.1002/1522-2594(200102)45:2<191::aid-mrm1025>3.0.co;2-9. [DOI] [PubMed] [Google Scholar]
- 12.Jenkinson M, Smith SM. A global optimisation method for robust affine registration of brain images. Medical Image Analysis. 2001;5(2):143–156. doi: 10.1016/s1361-8415(01)00036-6. [DOI] [PubMed] [Google Scholar]
- 13.Joshi S, Davis B, Jomier M, Gerig G. Unbiased diffeomorphic atlas construction for computational anatomy. Neuroimage. 2004;23(1):S151–160. doi: 10.1016/j.neuroimage.2004.07.068. [DOI] [PubMed] [Google Scholar]
- 14.Lee AD, Leow AD, Lu A, Reiss AL, Hall S, Toga AW, Thompson PM. 3D Pattern of Brain Abnormalities in Fragile X Syndrome Visualized using Tensor-Based Morphometry. NeuroImage. 2007;34(3):924–938. doi: 10.1016/j.neuroimage.2006.09.043. [DOI] [PMC free article] [PubMed] [Google Scholar]
- 15.Lepore N, Brun C, Chiang MC, Chou Y, Dutton RA, Hayashi KM, Lopez OL, Aizenstein HJ, Toga AW, Becker JT, Thompson PM. Multivariate statistics of Jacobian matrices in Tensor Based Morphometry and their application to HIV/AIDS. MICCAI. 2006:191–198. doi: 10.1007/11866565_24. [DOI] [PubMed] [Google Scholar]
- 16.Song SK, Sun SW, Ramsbottom MJ, Chang C, Russell J, Cross AH. Dysmyelination revealed through MRI as increased radial (but unchanged axial) diffusion of water. Neuroimage. 2002;17:1429–1436. doi: 10.1006/nimg.2002.1267. [DOI] [PubMed] [Google Scholar]
- 17.Studholme C, Cardenas V, Blumenfeld R, Schuff N, Rosen HJ, Miller B, Weiner M. Deformation tensor morphometry of semantic dementia with quantitative validation. Neuroimage. 2004;21:1387–1398. doi: 10.1016/j.neuroimage.2003.12.009. [DOI] [PubMed] [Google Scholar]
- 18.Tuch DS. Q-ball imaging. Magn Reson Med. 2004;52(6):1358–1372. doi: 10.1002/mrm.20279. [DOI] [PubMed] [Google Scholar]
- 19.Woods RP, Grafton ST, Holmes CJ, Cherry SR, Mazziotta JC. Automated image registration: I general methods and intra-subject intra-modality validation. J Comput Assist Tomogr. 1998;22:141–154. doi: 10.1097/00004728-199801000-00027. [DOI] [PubMed] [Google Scholar]
- 20.Woods RP. Characterizing volume and surface deformations in an atlas framework: theory, applications, and implementation. Neuroimage. 2003;18:769–788. doi: 10.1016/s1053-8119(03)00019-3. [DOI] [PubMed] [Google Scholar]
- 21.Zhang H, Yushkevich PA, Alexader DC, Gee JC. Deformable registration of diffusion tensor MR images with explicit orientation optimization. Medical Image Analysis. 2002;10:764–785. doi: 10.1016/j.media.2006.06.004. [DOI] [PubMed] [Google Scholar]