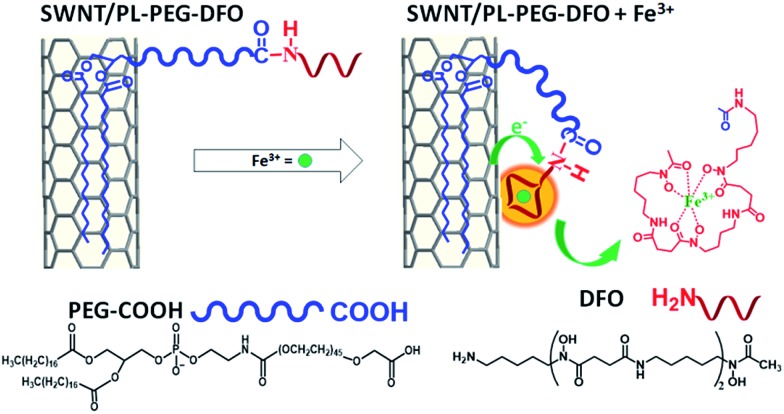
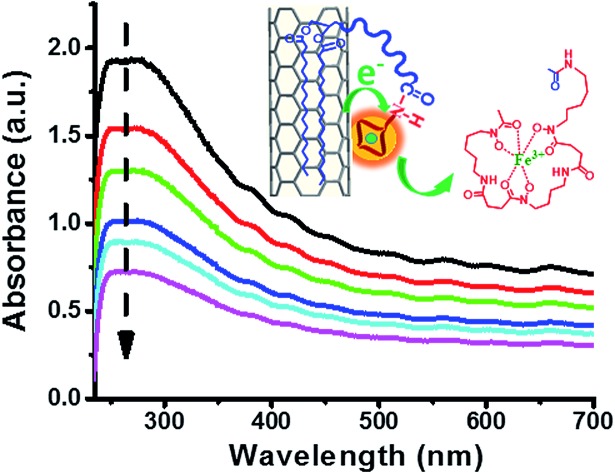
 The π-plasmon band of SWNTs can be used to selectively and sensitively detect Fe3+via the conjugation of Fe3+ selective siderophores.
Abstract
Inspired by the remarkable electronic and optical properties of single walled carbon nanotubes (SWNTs), various molecular sensing devices with sensitivity down to the single molecule level have been developed. However, most sensing approaches such as field effect transistors or near infrared (NIR) fluorescence require the rigorous debundling and separation of metallic tubes and semiconducting tubes in order to reach the desired high sensitivity. Interestingly, all carbon nanomaterials including carbon nanotubes, graphite, graphene, and even amorphous carbon exhibit extremely strong π-plasmon absorption in the ultraviolet region. This strong absorption has been studied as an undesired optical background for applications based on visible and NIR absorptions. For the first time, we found that the strong π-plasmon absorption of SWNTs in the ultraviolet region is extremely sensitive to ion binding. It is even much more sensitive than the absorption in the visible and NIR regions. Herein, we present our first exploration into using the extremely strong plasmon absorption of SWNTs to develop a new sensing platform for the detection of metallic ions. The detection selectivity is realized by modifying the surface of SWNTs with molecular ligands that have a high specificity for metal ions. As a demonstration, the new method is applied to selectively detect iron ions (Fe3+) by modifying the surface of the SWNTs with deferoxamine (DFO), a natural bacterial siderophore, which has a high specificity and affinity for Fe3+. The selective detection of Fe3+ in both aqueous solution and complex rain water is achieved with a pM level of sensitivity and detection limit. In situ resonant Raman spectroscopy demonstrated that the sensitive detection possibly involves electron transfer between the formed Fe–DFO complexes and the SWNTs. We envisage that it can be used to detect other metal ions when a specific binding chelator is attached to the carbon nanotube surface.
1. Introduction
Due to their remarkable electronic and optical properties, single walled carbon nanotubes (SWNTs) have been exploited to develop various molecular sensing devices.1 One widely studied device is based on field effect transistors (FETs), in which an individual SWNT is used as the active channel. The device development has revolutionized our ability to detect single molecules.1 The detection mechanism for this high sensitivity stems from the extremely high efficiency in the modulation of the electrical conductance of a semiconducting SWNT by electrostatic gating or doping through charge transfer between SWNTs and adsorbed molecules. However, devices using single nanotubes have the major flaw of irreproducibility due to challenges in assembling individual tubes into the required positions with atomic level precision.2 Another difficulty is the careful debundling and separation of semiconducting tubes from the metallic ones since most SWNT fabrication techniques produce a mixture of metallic and semiconducting nanotubes,2,3 but only the semiconducting nanotubes exhibit the large conductance change in response to the electrostatic and chemical gating effects that is desired for chemical sensors.1,4,5 SWNT networks have been explored as an alternative configuration to solve this problem.6,7 SWNT networks can be mass produced, and done so at low cost with high efficiency, which is ideal for practical applications.8–11 The devices based on SWNT networks exhibit reproducible characteristics because the electronic properties of a network are averaged over a large number of nanotubes.12,13 However, the relative simplicity comes with a loss in detection sensitivity due to the co-existence of both semiconducting and metallic nanotubes in the network.
Carbon nanotubes have also been intensively explored to develop optical based sensing approaches for biological in vitro and in vivo molecular sensing and imaging applications in recent years due to their unique optical properties.14–17 Specifically, semiconducting SWNTs absorb and emit strongly in the near infrared (NIR) region, where human tissue and biological fluids are largely transparent. Furthermore, their NIR emission is highly sensitive to changes in the local dielectric environment but remains stable to permanent photo-bleaching for prolonged molecular detection with single molecular sensitivity.18 Once again, careful debundling to individual pristine nanotubes is required because the presence of nanotube bundles and defects significantly diminishes the quantum yield of the NIR fluorescence of semiconducting SWNTs, resulting in a significant decrease in detection sensitivity.19
On the other hand, all carbon nanomaterials including carbon nanotubes, C60, graphite, graphene, and even amorphous carbon exhibit extremely strong plasmon absorption in the ultraviolet region.20–27 This strong absorption has been studied as an undesired optical background for visible and NIR absorption based applications.28,29 In this work, we found that the strong π-plasmon absorption of SWNTs in the ultraviolet region is extremely sensitive to ion binding. It is even much more sensitive than the absorption in visible and NIR regions. Herein, we will report the first exploration of this strong plasmon absorption to develop a new sensing platform for metallic ions. Compared to the previously reported FET and NIR fluorescence approaches, the new sensing platform can reach equal or better sensitivity and detection limits simply by using UV absorption spectroscopy. It does not require device fabrication and/or a NIR resource, which are not accessible in many labs. Most importantly, the separation of semiconducting and metallic tubes is not required, simplifying the sensing development and application. Finally, detection selectivity can be realized by modifying the surface of SWNTs with molecular ligands for specific metal ions (Scheme 1). As a demonstration, the new detection method is applied to selectively detect iron ions (Fe3+) in aqueous solution. Fe3+ was chosen because of its essential role in biology, the environment and the food/wine industry.30
Scheme 1. Schematic of SWNT surface modification with DFO and its interaction with Fe3+ for detection.
2. Results and discussion
2.1. π-Plasmon absorption of SWNTs
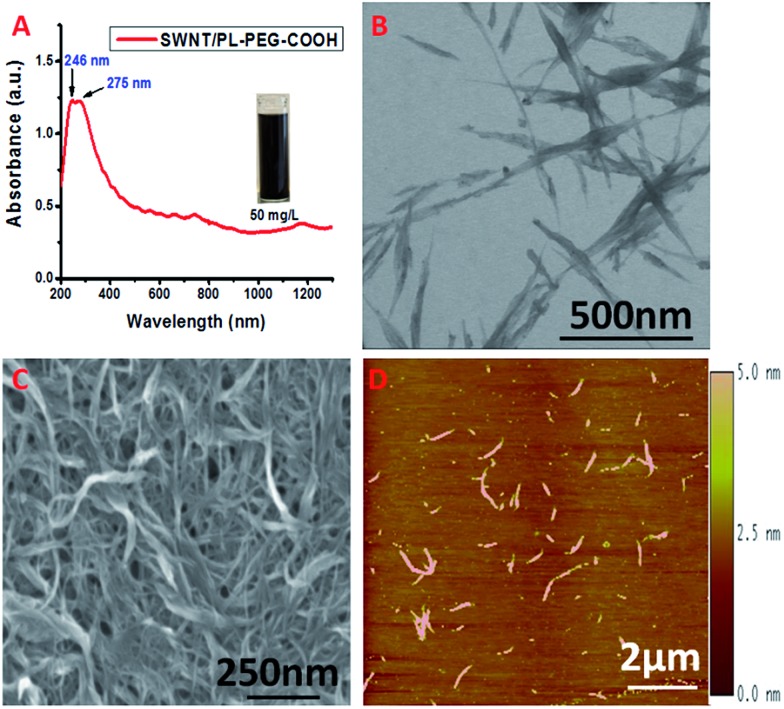
We modified the surface of highly purified SWNTs with carboxyl terminated phospholipid–polyethylene glycol (PL–PEG–COOH).19 It has been reported that the hydrophobic phospholipid tail adsorbs to the nanotube surface via hydrophobic interactions as shown in Scheme 1. The hydrophilic PEG chain imparts the SWNTs with water solubility. It also endows the SWNTs with a remarkable stability against aggregation in a high concentration of salt and a wide range of pH, and temperatures. Very importantly, it thwarts nonspecific protein absorption on to the surface of the SWNTs even in serum solutions granting specific interactions and detections.15 The attachment of PL–PEG–COOH to the SWNT surface results in good dispersion of the SWNTs into aqueous solution (Fig. 1A, inset). Most of the PL–PEG–COOH dispersed SWNTs (SWNT/PL–PEG–COOHs) are small bundles as shown in Fig. 1B–D. The electronic structure of the SWNT/PL–PEG–COOHs was studied using UV-Vis-NIR spectroscopy. Fig. 1A displays the characteristic spectrum of the SWNT/PL–PEG–COOHs. There are two extremely strong absorption peaks located in the UV region with absorption maxima at ∼246 nm and ∼275 nm. These two peaks have been observed and studied by several groups.29,31 However, their origin is still in debate.28,32 It is known that graphite and graphene exhibit two π-plasmon bands (collective oscillations of π electrons) in the ultraviolet frequency region, which originate from the anisotropic optical properties of graphite.33–35 It is worthy to point out that these π-plasmon bands are different from those that appear in the infrared (IR) and mid-IR regions, which originate from the collection of long-lived electron oscillations. Those bands can be observed only on specially patterned high quality (almost defect free) graphene sheets.36,37 The imaginary parts of the dielectric function have a maximum at 4.5 eV (275.8 nm) in the direction perpendicular to the c-axis of graphite (Im{ε⊥}) and the other is at ∼5.25 eV (236 nm) in the direction parallel to the c-axis (Im{–ε∥–1}).34 These two peaks are commonly observed in carbon materials such as carbon nanotubes, fullerenes, and amorphous carbon.20–27 The peak positions may vary depending on the geometries of the carbon nanomaterials, the existence of defects, and the interactions with their environment. The absorption maxima at 246 nm and 275 nm in the SWNT/PL–PEG–COOHs may originate from the maxima in Im{–ε∥–1} and Im{ε⊥} of the graphite and correspond to orientations parallel and perpendicular to the SWNT axis, respectively.
Fig. 1. (A) UV-Vis-NIR spectrum of SWNT/PL–PEG–COOHs in aqueous solution. (B–D) STEM, SEM and AFM images of SWNT/PL–PEG–COOHs, respectively.
The UV-Vis-NIR spectrum of the SWNT/PL–PEG–COOHs also shows fairly strong van Hove singularities from 400 nm to the NIR region.38 This part of the spectrum is dominated by the absorptions from inter-band transitions, which have been the focus of both fundamental and applied studies due to their possible application in various electronic and optical molecular detection and imaging materials.14–17 The first van Hove singularity transition of semiconducting SWNTs (sE11) is in the wavelength range of 800 to 1600 nm. Their second van Hove transition (sE22) is from 550 to 900 nm, which slightly overlaps with the first transition. The first van Hove singularity transition for metallic SWNTs (mE11) falls in the range of 400 to 600 nm. Notice that the van Hove singularities from the SWNT/PL–PEG–COOHs are not extremely prominent as for the ss-DNA dispersed SWNTs we observed before,39 indicating that small bundles of SWNTs exist in the samples, which is consistent with the results from the morphology studies (Fig. 1B–D).
Another interesting phenomenon worth mentioning is that this part of the spectrum also shows a small but obvious background. This background has been attributed to the non-collinear π-plasmon absorption extending into the lower energy region and therefore is an intrinsic optical property of SWNTs originating from the corresponding property of graphite parallel to its c-axis (Im{–ε∥–1}).25 So the overall spectrum in this region (from 400 nm to 1200 nm) is a superimposition of the absorptions of the various van Hove singularity transitions and the π-plasmon backgrounds.29,31
2.2. Sensitive detection of Fe3+ using SWNT/PL–PEG–DFO complex
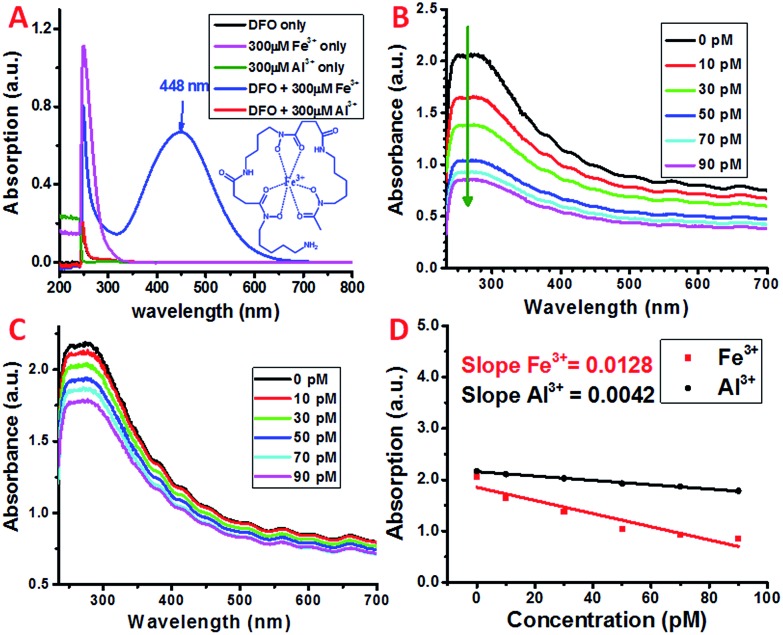
Siderophores are low molecular weight molecules with a high affinity and specificity for Fe3+. Certain bacteria and fungi are able to synthesize large amounts of siderophores in response to limited iron environments.40 Various natural and synthetic siderophores have been used for the selective and sensitive detection of Fe3+.41 One of the most commonly used natural bacterial siderophores is deferoxamine (DFO) (Scheme 1), which can form a very stable hexadentate iron chelate complex with a stability constant of about 1031 M–1.42,43 The DFO siderophore changes its conformation upon binding with Fe3+ (Scheme 1).44 The chelate complex exhibits a characteristic broad peak with a maximum absorption at ∼448 nm (Fig. 2A).45 By monitoring the peak intensity changes, the micromolar concentration of Fe3+ can be detected, which may limit its application with the requirement of a higher sensitivity.
Fig. 2. (A) UV-Visible spectra of DFO only, Fe3+ only, Al3+ only, DFO + Fe3+ and DFO + Al3+ solution in nitric acid (pH = 2). (B and C) UV-Vis spectra of SWNT/PL–PEG–DFO in the presence of (black) 0 pM, (red) 10 pM, (green) 30 pM, (blue) 50 pM, (cyan) 70 pM, and (magenta) 90 pM Fe3+ and Al3+ standard solutions, respectively. (D) The decrease in the absorption of SWNT/PL–PEG–DFOs at 270 nm as a function of the increase in the concentration of Fe3+ and Al3+.
To selectively as well as sensitively detect Fe3+, DFO was covalently attached to the carboxyl group at the distal end of the PEG chain on the dispersed SWNT/PL–PEG–COOHs via EDC/NHS coupling chemistry. EDC/NHS activates the carboxyl group of PL–PEG–COOH and covalently links it to the amine group of DFO. The detection of Fe3+ was performed by adding Fe3+ solution to the formed SWNT/PL–PEG–DFO solution and UV-Vis spectroscopy was applied to follow the spectral change upon each addition (Fig. 2B). Note that the Fe3+ solutions were prepared using a solution with low pH (pH 2) for efficient Fe3+–DFO binding.46 The absorption at ∼448 nm, at which the DFO–Fe complexes strongly absorb, did not increase as the concentration of iron was increased. Surprisingly, the entire absorption spectrum of the SWNTs decreased, with the most dramatic change in absorption occurring between 246 and 275 nm. The response is so sensitive to Fe3+ that picomolar concentrations of Fe3+ can easily be detected. Control experiments were performed by adding the same volume of buffer solution without Fe3+ to the SWNT/PL–PEG–DFO solution. No absorption decrease was observed, demonstrating that the absorption decline upon the addition of Fe3+ was not due to solution dilution effects. Since no SWNT precipitate was observed after the addition of Fe3+, the decrease in absorption is unlikely to be due to a possible concentration decrease of SWNTs.
2.3. Proposed mechanism
The exact mechanism for this sensitive response to Fe3+ remains elusive. We hypothesize that, similar to that of free DFO, DFO–Fe3+ complexes were formed on the SWNT/PL–PEG–DFOs upon the addition of Fe3+, which results in the dramatic quenching of the absorption of the SWNT/PL–PEG–DFOs due to the interaction between the formed DFO–Fe3+ complexes and the SWNTs. This hypothesis was promoted by the recent discovery by Choi et al.47 who found that the plasmon band of gold nanoparticles was largely quenched upon the formation of metal–ligand complexes due to plasmonic resonance energy transfer (PRET). It was reported that PRET took place only when the electronic absorption band of the formed metal–ligand complex matches the Rayleigh scattering frequency of the gold nanoparticles. In a similar manner, we thought that plasmonic energy transfer occurred between SWNTs and DFO–Fe3+ complexes. Although the maximum absorption of the SWNT plasmon band does not directly match that of the electronic absorption of the DFO–Fe3+ complex, plasmonic energy transfer is still possible due to the highly dispersive nature of the SWNT plasmon. As stated earlier, the plasmon band of SWNTs extends to the lower energy regions, which make up the main optical backgrounds for van Hove singularity transitions from 400 nm to the NIR range (400–1200 nm) (Fig. 1A). Therefore, the mechanism for the detection of Fe3+ using SWNT/PL–PEG–DFO complexes may be due to PRET.
On the other hand, it was reported that DFO could also form a stable complex with Al3+, even though the binding constant (1024.1) is six orders of magnitude smaller than for the DFO–Fe complex. Since the empty d-orbital of Al3+ is energetically inaccessible, it is not expected that the formation of the DFO–Al complex would open a band gap like the DFO–Fe complex. In fact, as experimentally shown in Fig. 2A, there is no new absorption peak observed in the UV-Vis spectrum of DFO upon adding Al3+ solution. However, our control experiment demonstrated that DFO–Al complex formation also leads to the absorption decrease of the entire spectrum of the SWNT/PL–PEG–DFO solution, even though the amplitude of decrease is much smaller than that of the DFO–Fe complex (Fig. 2B–D). Since the absorption for DFO did not show any detectable changes upon the formation of the DFO–Al complex, we started to question the energy transfer mechanism and hypothesized that an electron transfer process may have occurred between the SWNTs and the formed DFO complexes.
Ultraviolet-visible-near infrared (UV-Vis-NIR) electronic absorption spectroscopy has been used as a simple and powerful tool to study the electronic structures of carbon nanotubes and electron transfer reactions with SWNTs.48–50 In our previous work, we exploited this simple technique to study the electronic interaction between SWNTs and 3-aminophenylboronic acid (ABA), and the catalytic role of SWNTs in speeding up the polymerization of ABA in the formation of polyaniline boronic acid.39,51,52 It was observed that electron transfer from carbon nanotubes could diminish the absorption intensities of the carbon nanotubes. Therefore, it is very possible that the dramatic decrease of the plasmon band absorption of SWNTs is via an electron transfer mechanism. Upon the addition of Fe3+ or Al3+ into the SWNT/PL–PEG–DFO solution, Fe–DFO and Al–DFO complexes are formed and their interactions with SWNTs decreases the charge density of the tubes, which not only induces Vis-NIR bleaching from singularities, but also a strong UV damping from the local plasmon absorption of the SWNTs. For the first time, we found that UV bleaching is more sensitive compared to those in the visible and NIR ranges.
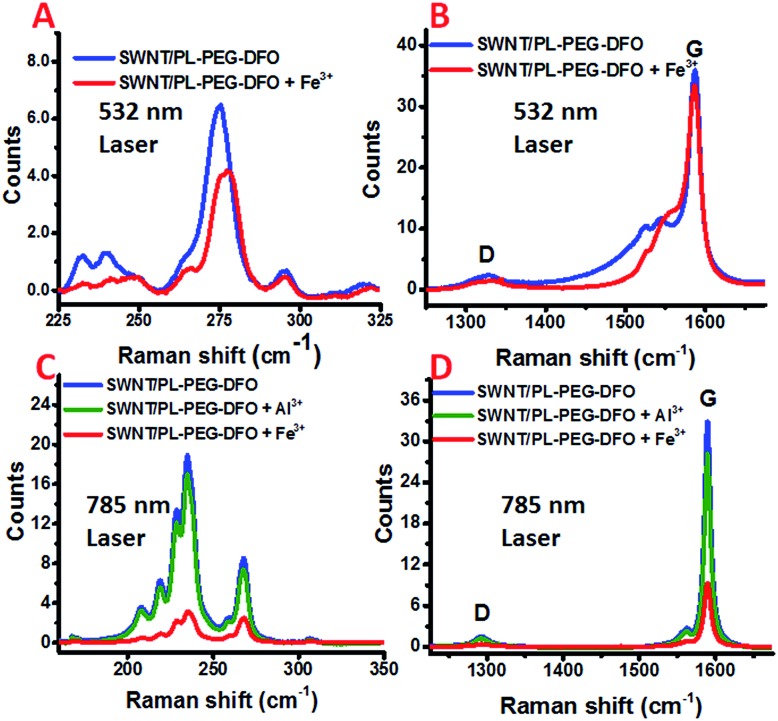
Raman spectroscopy is an exceedingly powerful tool in the study of the vibrational properties and electronic structures of CNTs. It has also been intensively used to study charge carrier doping of carbon nanotubes.53,54 Further, owing to the nature of the resonance Raman scattering process, using lasers of different wavelengths not only can differentiate metallic tubes from semiconducting ones, but also can probe their charge carrier doping separately.55 In general, the intensities of the bands in the Raman spectrum of SWNTs decrease if an adsorbed molecule extracts electrons from the SWNTs. The radial breathing modes (RBMs) are more sensitive than the G and 2G bands. The decrease in the intensity of these bands is sometimes accompanied by a frequency shift. For the G band, the electron transfer interaction from SWNTs to the adsorbed molecule results in a frequency shift to higher values, while the radial breathing modes (RBMs) can be downshifted or upshifted upon electron transfer processes.53 For metallic SWNTs, the broad and asymmetric Breit–Wigner–Fano (BWF) line and the G band also shift to higher frequencies.56 To determine if an electron transfer process occurs between the SWNTs and the formed DFO–Fe complex, the changes of the SWNT/PL–PEG–DFOs Raman spectrum were monitored in situ upon the addition of Fe3+ solution (see details in Experimental section). Since the laser excitation wavelength at 532 nm is mainly in resonance with the absorption band of the metallic tubes and the 785 nm laser excitation is mainly in resonance with that of the semiconductor ones, the two laser excitation wavelengths (532 nm and 785 nm) were used for Raman excitation to probe both the metallic and semiconducting tubes, respectively.
For the metallic tubes probed using the 532 nm laser, the frequency of the G band did not change very much, yet a small but noticeable upshift (∼2 cm–1) of the RBM bands is observed upon the addition of Fe3+ into the SWNT/PL–PEG–DFO solution, as shown in Fig. 3A and B. These results are in agreement with previous studies that RBM bands are more sensitive to changes in the electronic structures of SWNTs.53 Furthermore, we also found that the G– band also shifts to higher frequencies. All of these observations demonstrate that the decrease in the absorption intensities upon the addition of Fe3+ is very likely via an electron transfer mechanism for the metallic tubes. It was reported that metalized porphyrin strongly interacts with carbon nanotubes and graphene via π–π and π–cation interactions.57,58 We hypothesized that a similar π–cation interaction may exist between the π-plasma electrons and the formed DFO–Fe3+ complexes.59,60
Fig. 3. Raman spectra of the SWNT/PL–PEG–DFO solution, before and after the addition of Fe3+ using a 532 nm laser (A and B). Raman spectra of the SWNT/PL–PEG–DFO solution, before and after the addition of Fe3+ and Al3+ using a 785 nm laser (C and D).
For the semiconducting tubes probed by a 785 nm laser, the peak frequency of all of the bands did not shift, while the intensities of both the RBM region and G band region decreased significantly upon the addition of Fe3+ into the SWNT/PL–PEG–DFO solution, as shown in Fig. 3C and D. Since the absorption intensity of the tubes in the visible to NIR regions also decreased upon the addition of Fe3+ into the SWNT/PL–PEG–DFO solution, although by a smaller amount than in the UV region, the observed intensity decrease of the G band and RBM bands is possibly a consequence of the decreased Raman cross section of these Raman modes. Therefore it is still not conclusive if electron transfer occurs between the formed DFO–Fe complexes and these semiconductor tubes. This is because both the electron transfer and energy transfer mechanisms could result in the diminishing of the absorption intensity of the tubes. Since energy transfer is not possible for the Al3+–DFO complexes formed on the carbon nanotubes, we thought that we could get a clear conclusion by comparing the Raman spectra of the SWNT/PL–PEG–DFOs upon the formation of the Al3+–DFO and Fe3+–DFO complexes. So control experiments were performed with Al3+via resonant Raman spectroscopy. Unfortunately, the changes in the Raman spectra of the SWNT/PL–PEG–DFO solution before and after the addition of Al3+ solution was too small to assure a firm conclusion (Fig. 3C and D, and S1 and more detailed discussion in ESI†).
2.4. Selective detection of Fe3+
In atmospheric dust, the mass ratio of Al to Fe is ∼3.5.61 Therefore, Al3+ may interfere with the detection of Fe3+, despite having a stability constant that is 6 orders lower. Indeed, with an increasing concentration of Al3+ the plasmon absorption intensity also decreases, while the decrease is much smaller than that of Fe3+ (Fig. 2C and D). This can be due to the difference in complex stability between Fe and Al with DFO. Since Fe3+ forms a more stable complex with DFO than Al3+, fewer DFO–Al complexes would form to interact with the plasmon band of the SWNTs, thus giving a larger decrease in absorption. This also indicates that Fe3+ may be able to compete with Al3+ so the interference can be minimal during Fe3+ detection.
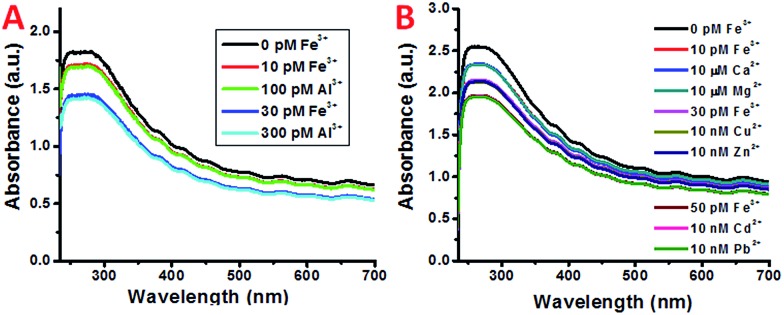
To verify this, both Fe3+ and Al3+ were added to SWNT/PL–PEG–DFOs and the plasmon change was monitored (Fig. 4A). Unlike the previous studies where the UV-Vis spectrum was taken after a 1 minute reaction with iron, all spectra were taken 20–30 seconds after the reaction with iron. The purpose of this is to study the competitive binding of Fe3+ and Al3+. As expected, the addition of 10 pM Fe3+ causes an absorption decrease of the band at ∼260–270 nm. This was followed by the addition of 100 pM Al3+, which will compete with unbound Fe3+ in solution. Due to the higher binding affinity of Fe3+ to DFO, the absorption remains relatively unchanged upon the addition of Al3+ with a 10 times higher concentration. This process was repeated again with an addition of 30 pM Fe3+ followed by 300 pM Al3+. Once again, the absorption intensity decreases upon the addition of Fe3+ but barely changes upon the addition of a 10 times higher concentration of Al3+. These results confirm that the plasmon absorption intensity decrease seen is mainly due to Fe3+ and the interference from Al3+ is minimal.
Fig. 4. (A) UV spectra of SWNT/PL–PEG–DFOs in the presence of (black) 0 pM Fe3+, (red) 10 pM Fe3+, (green) 100 pM Al3+, (blue) 30 pM Fe3+, and (cyan) 300 pM Al3+ solution. (B) UV spectra of SWNT/PL–PEG–DFOs in the presence of (black) 0 pM Fe3+, (red) 10 pM Fe3+, (blue) 10 μM Ca2+, (dark blue) 10 μM Mg2+, (pink) 30 pM Fe3+, (olive) 10 nM Cu2+, (violet) 10 nM Zn2+, (brown) 50 pM Fe3+, (magenta) 10 nM Cd2+, and (green) 10 nM Pb2+.
It should also be noted that despite the high affinity of DFO for Fe3+ and Al3+, it can also bind to other ions such as Cu2+, Zn2+, and Ni2+, as well as other ions listed in Table 1 to form complex structures.62 Besides Al3+, the interference from these ions was also studied and the results are shown in Fig. 4B. Similarly, only the addition of Fe3+ showed a noticeable decrease in absorption. All of the other metal ions show almost no response even with a 3–6 magnitude higher concentration.
Table 1. Stability constants for different DFO–metal ion complexes. These values were obtained from ref. 63.
| Metal ions | Pb2+ | Fe3+ | Fe2+ | Ni2+ | Cu2+ | Zn2+ | Cd2+ | Al3+ | Ca2+ | Mg2+ |
| Stability constant (log k) | 10.5 | 30.6 | 7.2 | 10.9 | 14.1 | 10.1 | 7.9 | 24.1 | 2.64 | 4.1 |
2.5. Detection of Fe3+ in natural rainwater
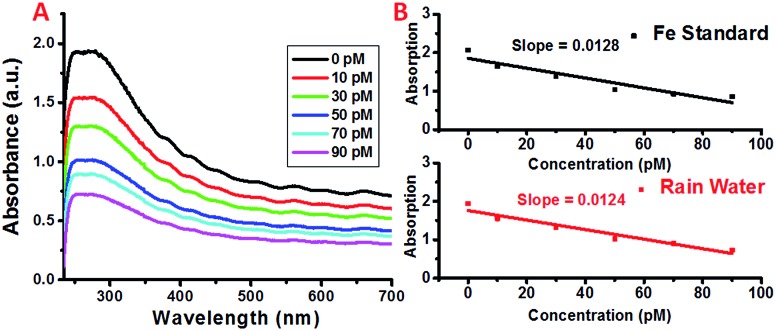
In order to determine the feasibility of this iron detection approach for practical applications, we attempted to detect the iron concentrations in rainwater collected from Newark, New Jersey. The concentrations of selected metal ions present in the collected rain water were determined using High Resolution Inductively Coupled Plasma Mass Spectrometry (HR-ICPMS).64 The rain water was diluted accordingly to obtain the concentrations used for detection and the results are shown in Fig. 5. As expected, the plasmon absorption band decreased with the increasing concentration of iron. More importantly, the absorption decrease for each addition of the diluted rain water is comparable to that of the Fe standard samples, demonstrating the feasibility of this simple detection method for practical applications.
Fig. 5. (A) UV spectra of SWNT/PL–PEG–DFOs in the presence of (black) 0 pM, (red) 10 pM, (green) 30 pM, (blue) 50 pM, (cyan) 70 pM, and (magenta) 90 pM Fe3+ rain water. (B) A comparison of the absorption decrease as a function of Fe3+ in standard solution and rain water.
3. Conclusions
For the first time, a new concept based on the π-plasmon band of SWNTs is explored for the simple detection of metal ions with high selectivity and sensitivity. This method does not require expensive instrumentation and a pre-concentration step to achieve picomolar sensitivity. In situ resonant Raman studies with different excitation wavelengths revealed that both semiconducting and metallic tubes contribute to detection, so the separation of semiconducting tubes from metallic tubes is not necessary for sensitive detection, which is the key advantage compared to the previously reported approaches based on FET and NIR fluorescence. In this work, the highly selective detection of Fe3+ in both standard aqueous solution and complex rain water was accomplished via surface modification of the carbon nanotubes with a Fe3+ selective siderophore. We envisage that this detection approach can be used to detect other metal ions including heavy metal ions when a specific binding chelator is attached to the carbon nanotube surface.
4. Experimental section
4.1. Reagents
N-Hydroxysulfosuccinimide sodium salt (NHS), N-(3-dimethylaminopropyl)-N′-ethylcarbodiimide hydrochloride (EDC), deferoxamine mesylate salt (DFO), MES hydrate buffer, iron standard solution, and aluminium standard solution were purchased from Aldrich and used as received without further purification. Calcium chloride dihydrate and nickelous chloride 6-hydrate were purchased from J. T. Baker and used as received. Zinc chloride, copper reference standard solution, cadmium reference standard solution, and lead reference standard solution were purchased from Fisher and used as received. Magnesium chloride hexahydrate was purchased from EM science Merck kGaA and used as received. Rain water samples were collected from Newark in New Jersey with sampling details in the previous work.64 The sample was diluted 106 times before it was used in this experiment. Highly purified single-walled carbon nanotubes (SWNTs) were prepared via the HiPCO process and obtained from Carbon Nanotechnologies. 1,2-Distearoyl-sn-glycero-3-phosphoethanolamine-N[carboxy(polyethylene glycol)-2000] (ammonium salt) (PL–PEG–COOH) was purchased from Avanti Polar Lipids Inc. All solutions were prepared using deionized water (18.2 M) (Nanopore water, Barnstead).
4.2. Dispersion of CNTs into aqueous solution
SWNTs were dispersed into aqueous solution using a method previously described by Kam et al.15 Briefly, single walled carbon nanotubes were suspended in an aqueous solution containing PL–PEG–COOH. The mixture was sonicated using a Sonics Vibracell (Model VCX 130) for 90 minutes. The sonication process was performed in an ice-water bath to prevent local heating of the CNTs which may cause unnecessary scission of the CNTs. After sonication, the sample was centrifuged using a Beckman J2-21 centrifuge (Eppendorf 5415C) at 6000 rpm to remove insoluble materials, leaving PL–PEG–COOH dispersed single walled carbon nanotubes (SWNT/PL–PEG–COOHs). The SWNT/PL–PEG–COOH solution was dialyzed using an Amicon Ultra-15 centrifugal filter (Millipore) with 0.1 M MES buffer to adjust its pH to 4.5 prior to EDC coupling. The resulting solution consists of highly dispersed and functionalized SWNT/PL–PEG–COOHs with a mass concentration of 200–400 mg L–1.
4.3. Characterization of Fe-free carbon nanotube solution
To ensure that the SWNT/PL–PEG–COOHs used were free of Fe catalysts, DFO was added into an aliquot of carbon nanotube water solution and mixed. The mixture was then left to react for 2 h and dialyzed to remove free DFO. UV-Vis spectra of the filtrated solution (which contains no carbon nanotubes) were used to monitor the absorption band at 448 nm, which is attributed to binding between DFO and Fe3+. The above process was repeated several times until the absorption at 448 nm disappeared.
4.4. Preparation of SWNT/PL–PEG–COOH/DFO complexes
SWNT/PL–PEG–COOH/DFO complexes were prepared via EDC/NHS mediated coupling. Briefly, SWNT/PL–PEG–COOHs and MF–SWNTs with concentrations between 200 mg L–1 and 250 mg L–1 were mixed with NHS and EDC (2.5 to 1 ratio) in 0.1 M MES buffer (pH 4.5). The reaction was allowed to proceed for 1 hour. Upon activation of the carboxyl group, the amide bond was formed by adding DFO to the mixture and allowing it to react for 2 hours. The resulting mixture was subjected to extensive centrifugation and dialysis to remove free DFO, NHS, EDC, and unreacted SWNTs.
4.5. Characterization of SWNT/PL–PEG–COOH/DFO complexes
The SWNT/PL–PEG–COOH/DFOs were characterized using a tapping mode Nanoscope IIIA atomic force microscope (AFM) (Veeco instrument, now Bruker) in air. AFM samples were prepared by drop casting diluted DFO complexed SWNT solution onto cleaned mica surfaces. The samples were incubated for 3–5 minutes, rinsed with deionized water, and dried under vacuum prior to AFM measurements.
4.6. Fe3+ detection in SWNT/PL–PEG–COOH/DFO complexes
The detection of Fe was monitored using a Cary 500 UV-Vis-NIR spectrophotometer. In preparing the sample for UV-Vis-NIR analysis, an aliquot of SWNT/PL–PEG–COOH/DFOs was diluted in nitric acid (pH 2). The UV-Vis-NIR spectrum was acquired after the addition of various concentrations of Fe in nitric acid. The samples were allowed to react with iron for 1 minute before the spectra were obtained.
4.7. Characterization
4.7.1. Ultraviolet-visible-near infrared spectroscopy
Spectra were acquired using a Cary 500 UV-Vis-NIR spectrophotometer. The spectra were collected over the range of 200–800 nm. In preparing the samples for UV-Vis spectral analysis, SWNT/PL–PEG–COOH/DFOs were diluted to 3 mL with pH 2 nitric acid.
4.7.2. Atomic force microscopy
AFM images were obtained using a tapping mode atomic force microscope (Nanoscope IIIA, Digital Instruments). Samples were prepared by depositing 5 μL of solution onto a freshly cleaved mica surface. After incubating for 5 minutes, the mica surface was rinsed with de-ionized water and dried with nitrogen.
4.7.3. Raman spectroscopy
Raman spectra were collected using excitation from a single frequency 785 nm diode laser and 532 nm diode-pumped solid state laser with ∼10 mW of power, a Trivista triple monochromator and a 1340 × 100 pixel Spec-10 liquid nitrogen-cooled CCD detector (Princeton Instruments). With a 100 μm entrance slit width, the spectral resolution was <5 cm–1 and peak frequency shifts of <1 cm–1 could be measured. Data were collected using quartz cuvettes with a 1 mm path length. To avoid any dilution/solvent effects, three SWNT–DFO samples (500 μL of 41.9 mg L–1) were prepared in three separate cuvettes. Then to one of them, 20 μL of Fe3+ (8.96 μM in 2% HNO3) was added. To the second cuvette, 20 μL of blank solvent 2% HNO3 was added and to the third cuvette, 20 μL of Al3+ (8.96 μM in 2% HNO3) was added. The final concentration of SWNTs in all of the cuvettes was 40.3 mg L–1. Raman spectra of all three cuvettes were collected after the addition of the respective ions or blank solvent. The presence of HNO3 in all of the three cuvettes serves as an internal standard and all of the final Raman spectra were normalized with a NO3– peak (at 1046 cm–1 for both the 532 nm and 785 nm laser) before comparison.
Supplementary Material
Acknowledgments
Financial support was provided from the National Science Foundation (CBET 1438493, MRI 1429062 and DMR 1507812).
Footnotes
†Electronic supplementary information (ESI) available. See DOI: 10.1039/c6sc00006a
References
- Kong J., Franklin N. R., Zhou C. W., Chapline M. G., Peng S., Cho K., Dai H. J. Science. 2000;287:622–625. doi: 10.1126/science.287.5453.622. [DOI] [PubMed] [Google Scholar]
- Hu L., Hecht D. S., Grüner G. Nano Lett. 2004;4:2513–2517. [Google Scholar]
- Chen R. J., Bangsaruntip S., Drouvalakis K. A., Kam N. W. S., Shim M., Li Y., Kim W., Utz P. J., Dai H. J. Proc. Natl. Acad. Sci. U. S. A. 2003;100:4984–4989. doi: 10.1073/pnas.0837064100. [DOI] [PMC free article] [PubMed] [Google Scholar]
- Kong J., Dai H. J. Phys. Chem. B. 2001;105:2890–2893. [Google Scholar]
- Boussaad S., Tao N. J., Zhang R., Hopson T., Nagahara L. A. Chem. Commun. 2003:1502–1503. [Google Scholar]
- Star A., Tu E., Niemann J., Galbriel J.-C. P., Joiner C. S., Calcke C. Proc. Natl. Acad. Sci. U. S. A. 2006;103:921–926. doi: 10.1073/pnas.0504146103. [DOI] [PMC free article] [PubMed] [Google Scholar]
- Qi P. F., Vermesh O., Grecu M., Javey A., Wang Q., Dai H. J. Nano Lett. 2003;3:347–351. doi: 10.1021/nl034010k. [DOI] [PubMed] [Google Scholar]
- Kaempgena M., Duesbergb G. S., Rotha S. Appl. Surf. Sci. 2005;252:425. [Google Scholar]
- Artukovic E., Kaempgen M., Hecht D. S., Roth S., Grüner G. Nano Lett. 2005;5:757–760. doi: 10.1021/nl050254o. [DOI] [PubMed] [Google Scholar]
- Wu Z., Chen Z., Du X., Logan J. M., Sippel J., Nikolou M., Kamaras K., Reynolds J. R., Tanner D. B., Hebard A. F., Rinzler A. G. Science. 2004;305:1273–1276. doi: 10.1126/science.1101243. [DOI] [PubMed] [Google Scholar]
- Zhang D., Ryu K., Liu X., Polikarpov E., Ly J., Tompson M. E., Zhou C. Nano Lett. 2006;6:1880–1886. doi: 10.1021/nl0608543. [DOI] [PubMed] [Google Scholar]
- Li J., Lu Y., Ye Q., Cinke M., Han J., Meyyappan M. Nano Lett. 2003;3:929–933. [Google Scholar]
- Grüner G. J. Mater. Chem. 2006;16:3533–3539. [Google Scholar]
- Carbon Nanotubes: In Vitro and In Vivo Sensing and Imaging, ed. W. Cheung and H. X. He, WILEY-VCH Verlag GmbH & Co KGaA, Weinheim, 2011. [Google Scholar]
- Kam N. W. S., O'Connell M., Wisdom J. A., Dai H. J. Proc. Natl. Acad. Sci. U. S. A. 2005;102:11600–11605. doi: 10.1073/pnas.0502680102. [DOI] [PMC free article] [PubMed] [Google Scholar]
- Liu Z., Li X., Tabakman S. M., Jiang K., Fan S., Dai H. J. Am. Chem. Soc. 2008;130:13540–13541. doi: 10.1021/ja806242t. [DOI] [PMC free article] [PubMed] [Google Scholar]
- De La Zerda A., Zavaleta C., Keren S., Vaithilingam S., Bodapati S., Liu Z., Levi J., Smith B. R., Ma T.-J., Oralkan O., Cheng Z., Chen X., Dai H., Khuri-Yakub B. T., Gambhir S. S. Nat. Nanotechnol. 2008;3:557–562. doi: 10.1038/nnano.2008.231. [DOI] [PMC free article] [PubMed] [Google Scholar]
- O'Connell M. J., Bachilo S. M., Huffman C. B., Moore V. C., Strano M. S., Haroz E. H., Rialon K. L., Boul P. J., Noon W. H., Kittrell C., Ma J. P., Hauge R. H., Weisman R. B., Smalley R. E. Science. 2002;297:593–596. doi: 10.1126/science.1072631. [DOI] [PubMed] [Google Scholar]
- Welsher K., Liu Z., Sherlock S. P., Robinson J. T., Chen Z., Daranciang D., Dai H. J. Nat. Nanotechnol. 2009;4:773–780. doi: 10.1038/nnano.2009.294. [DOI] [PMC free article] [PubMed] [Google Scholar]
- Marinopoulos A. G., Wirtz L., Marini A., Olevano V., Rubio A., Reining L. Appl. Phys. A: Mater. Sci. Process. 2004;78:1157–1167. [Google Scholar]
- Marinopoulos A. G., Reining L., Rubio A., Vast N. Phys. Rev. Lett. 2003;91:046402. doi: 10.1103/PhysRevLett.91.046402. [DOI] [PubMed] [Google Scholar]
- Marinopoulos A. G., Reining L., Rubio A., Olevano V. Phys. Rev. B: Condens. Matter Mater. Phys. 2004;69:245419. [Google Scholar]
- Kramberger C., Hambach R., Giorgetti C., Rummeli M. H., Knupfer M., Fink J., Buchner B., Reining L., Einarsson E., Maruyama S., Sottile F., Hannewald K., Olevano V., Marinopoulos A. G., Pichler T. Phys. Rev. Lett. 2008;100:196803. doi: 10.1103/PhysRevLett.100.196803. [DOI] [PubMed] [Google Scholar]
- Yoo S., Jung Y. M., Lee D. S., Han W. T., Oh K., Murakami Y., Edamura T., Maruyama S. Opt. Lett. 2005;30:3201–3203. doi: 10.1364/ol.30.003201. [DOI] [PubMed] [Google Scholar]
- Murakami Y., Einarsson E., Edamura T., Maruyama S. Phys. Rev. Lett. 2005;94:087402. doi: 10.1103/PhysRevLett.94.087402. [DOI] [PubMed] [Google Scholar]
- Murakami Y., Einarsson E., Edamura T., Maruyama S. Carbon. 2005;43:2664–2676. doi: 10.1103/PhysRevLett.94.087402. [DOI] [PubMed] [Google Scholar]
- Kelly M. K. Phys. Rev. B: Condens. Matter Mater. Phys. 1992;46:4963–4968. doi: 10.1103/physrevb.46.4963. [DOI] [PubMed] [Google Scholar]
- Huang X. Y., McLean R. S., Zheng M. Anal. Chem. 2005;77:6225–6228. doi: 10.1021/ac0508954. [DOI] [PubMed] [Google Scholar]
- Landi B. J., Ruf H. J., Evans C. M., Cress C. D., Raffaelle R. P. J. Phys. Chem. B. 2005;109:9952–9965. doi: 10.1021/jp044990c. [DOI] [PubMed] [Google Scholar]
- Vallejos S., Muñoz A., Ibeas S., Serna F., García F. C., García J. M. J. Mater. Chem. A. 2013;1:15435–15441. [Google Scholar]
- Kramberger C., Hambach R., Giorgetti C., Ruemmeli M. H., Knupfer M., Fink J., Buechner B., Reining L., Einarsson E., Maruyama S., Sottile F., Hannewald K., Olevano V., Marinopoulos A. G., Pichler T. Phys. Rev. Lett. 2008;100:196803. doi: 10.1103/PhysRevLett.100.196803. [DOI] [PubMed] [Google Scholar]
- Itkis M. E., Perea D. E., Niyogi S., Rickard S. M., Hamon M. A., Hu H., Zhao B., Haddon R. C. Nano Lett. 2003;3:309–314. [Google Scholar]
- Taft E. A., Philipp H. R. Phys. Rev. 1965;138(1A):A197–A202. [Google Scholar]
- Marinopoulos A. G., Reining L., Olevano V., Rubio A., Pichler T., Liu X., Knupfer M., Fink J. Phys. Rev. Lett. 2002;89:076402. doi: 10.1103/PhysRevLett.89.076402. [DOI] [PubMed] [Google Scholar]
- Podila R., Anand B., Spear J. T., Puneet P., Philip R., Sai S. S. S., Rao A. M. Nanoscale. 2012;4:1770–1775. doi: 10.1039/c2nr11206j. [DOI] [PubMed] [Google Scholar]
- Lin M. F., Shung K. W. K. Phys. Rev. B: Condens. Matter Mater. Phys. 1994;50:17744–17747. doi: 10.1103/physrevb.50.17744. [DOI] [PubMed] [Google Scholar]
- Rodrigo D., Limaj O., Janner D., Etezadi D., Javier Garcia de Abajo F., Pruneri V., Altug H. Science. 2015;349:165–168. doi: 10.1126/science.aab2051. [DOI] [PubMed] [Google Scholar]
- Welsher K., Liu Z., Sherlock S. P., Robinson J. T., Chen Z., Daranciang D., Dai H. J. Nat. Nanotechnol. 2009;5:773. doi: 10.1038/nnano.2009.294. [DOI] [PMC free article] [PubMed] [Google Scholar]
- Ma Y. F., Chiu P. L., Serrano A., Ali S. R., Chen A. M., He H. X. J. Am. Chem. Soc. 2008;130:7921–7928. doi: 10.1021/ja7112189. [DOI] [PubMed] [Google Scholar]
- Torres M. A., West A. J. and Nealson K., in Geochemistry of the Earth's Surface Ges-10, ed. J. Gaillardet, 2014, vol. 10, pp. 118–122. [Google Scholar]
- Inomata T., Tanabashi H., Funahashi Y., Ozawa T., Masuda H. Dalton Trans. 2013;42:16043–16048. doi: 10.1039/c3dt51448j. [DOI] [PubMed] [Google Scholar]
- Porter J. B. Am. J. Hematol. 2007;82:1136–1139. doi: 10.1002/ajh.21100. [DOI] [PubMed] [Google Scholar]
- Crumbliss B. H. BioMetals. 2002;15:325–339. doi: 10.1023/a:1020218608266. [DOI] [PubMed] [Google Scholar]
- Kraemer S. M. Aquat. Sci. 2004;66:3–18. [Google Scholar]
- Monzyk B., Crumbliss A. L. J. Am. Chem. Soc. 1982;104:4921–4929. [Google Scholar]
- Ihnat P. M., Vennerstrom J. L., Robinson D. H. J. Pharm. Sci. 2002;7:1733–1741. doi: 10.1002/jps.10168. [DOI] [PubMed] [Google Scholar]
- Choi Y., Park Y., Kang T., Lee L. P. Nat. Nanotechnol. 2009;4:742–746. doi: 10.1038/nnano.2009.258. [DOI] [PubMed] [Google Scholar]
- Strano M. S. J. Phys. Chem. B. 2003;107:6979–6985. [Google Scholar]
- Zheng M., Diner B. A. J. Am. Chem. Soc. 2004;126:15490–15494. doi: 10.1021/ja0457967. [DOI] [PubMed] [Google Scholar]
- O'Connell M., Eibergen E. E., Doorn S. K. Nat. Mater. 2005;4:412–418. doi: 10.1038/nmat1367. [DOI] [PubMed] [Google Scholar]
- Ma Y. F., Ali S. R., Wang L., Chiu P. L., Mendelsohn R., He H. X. J. Am. Chem. Soc. 2006;128:12064–12065. doi: 10.1021/ja063375e. [DOI] [PubMed] [Google Scholar]
- Ma Y. F., Cheung W., Wei D., Bogozi A., Chiu P. L., Wang L., Pontoriero F., Mendelsohn R., He H. X. ACS Nano. 2008;2:1197–1204. doi: 10.1021/nn800201n. [DOI] [PubMed] [Google Scholar]
- Britz D. A., Khlobystov A. N. Chem. Soc. Rev. 2006;35:637–659. doi: 10.1039/b507451g. [DOI] [PubMed] [Google Scholar]
- Tsang J. C., Freitag M., Perebeinos V., Liu J., Avouris P. Nat. Nanotechnol. 2007;2:725–730. doi: 10.1038/nnano.2007.321. [DOI] [PubMed] [Google Scholar]
- Hatting B., Ernst F., Reich S. Phys. Status Solidi B. 2014;251:2491–2494. [Google Scholar]
- Cha M., Jung S., Cha M. H., Kim G., Ihm J., Lee J. Nano Lett. 2009;9:1345–1349. doi: 10.1021/nl8029948. [DOI] [PubMed] [Google Scholar]
- Karachevtsev V. A., Zarudnev E. S., Stepanian S. G., Glamazda A. Y., Karachevtsev M. V., Adamowicz L. J. Phys. Chem. C. 2010;114:16215–16222. [Google Scholar]
- Zou H. L., Li B. L., Luo H. Q., Li N. B. Sens. Actuators, B. 2015;207:535–541. [Google Scholar]
- Gao S., Shi G., Fang H. Nanoscale. 2016;8:1451–1455. doi: 10.1039/c5nr06456b. [DOI] [PubMed] [Google Scholar]
- Liu J., Shi G. S., Guo P., Yang J. R., Fang H. P. Phys. Rev. Lett. 2015;115:164502. doi: 10.1103/PhysRevLett.115.164502. [DOI] [PubMed] [Google Scholar]
- Tria J., Butler E. C. V., Haddad P. R., Bowie A. R. Anal. Chim. Acta. 2007;588:153–165. doi: 10.1016/j.aca.2007.02.048. [DOI] [PubMed] [Google Scholar]
- Farkas E., Csoka H., Micera G., Dessi A. J. Inorg. Biochem. 1997:281–286. [Google Scholar]
- Kiss T., Farkas E. J. Inclusion Phenom. Mol. Recognit. Chem. 1998;32:385–403. [Google Scholar]
- Song F., Gao Y. Atmos. Environ. 2009;43:4903–4913. [Google Scholar]
Associated Data
This section collects any data citations, data availability statements, or supplementary materials included in this article.


