Abstract
Context:
Acute Physiology and Chronic Health Evaluation (APACHE) III and Simplified Acute Physiology Score (SAPS) II are frequently used to predict the outcome of Intensive Care Unit (ICU) patients of sepsis.
Aim:
The aim of the study was to compare the predictability of outcome with APACHE III and SAPS II score in ICU patients of sepsis, severe sepsis, and septic shock and the 28-day mortality.
Settings and Design:
This study was an observational, prospective cohort study.
Materials and Methods:
A total of 100 consecutive patients of sepsis were studied over 20 months. The worst physiological and biochemical parameters during the first 24 h were recorded for the scores and the patient's 28-day outcome followed up.
Statistical Analysis Used:
Continuous data were expressed as mean ± standard deviation or median. Receivers operating characteristic (ROC) curve was used to find the cutoff value, area under the curve, sensitivity and specificity of APACHE III score, and SAPS II score. Binary logistic regression with response variable as the outcome was utilized. P < 0.05 was considered statistically significant.
Results:
The mean APACHE III score in the survivor group was 66.49 ± 18.56 as opposed to 80.67 ± 19.03 for nonsurvivors. The mean SAPS II score for the survivor group was 43.32 ± 13.02 as against the nonsurvivor group at 51.92 ± 12.34. The area under the ROC curve for APACHE III was 0.711 with 95% confidence interval as against 0.686 for SAPS II. The best cutoff value obtained for mortality prediction using the ROC curve was 69 for APACHE III while that for SAPS II was 49.
Conclusions:
APACHE III was found to be a better predictor of mortality as compared to SAPS II though the margin of difference in mortality prediction was not high.
Keywords: Acute Physiology and Chronic Health Evaluation III, Intensive Care Unit, predictor of outcome, Simplified Acute Physiology Score II, sepsis
INTRODUCTION
Sepsis can be described as the presence of infection, either probable or documented, along with systemic manifestations of the infection. Severe sepsis is defined as sepsis and the presence of sepsis-induced organ dysfunction and tissue hypoperfusion. It is a systemic deleterious host response to infection. Sepsis can progress to severe sepsis and septic shock in no time with septic shock being the presence of hypotension in the setting of severe sepsis which is not corrected by fluid resuscitation.[1,2]
Sepsis is one of the leading causes of mortality among the patients admitted to the Intensive Care Unit (ICU). Severe sepsis and septic shock are major health-care problems around the world killing one in four patients and increasing in the incidence every year. The reason for this may include an increase in elderly population, recognition of disease, performance of invasive procedures, immunosuppressive agents, and chronic diseases such as end-stage renal disease. It has a major impact on health-care resources and expenditure. Hence, the need arises for correct stratification and assessment of the risks, morbidity and mortality of the patients.[3,4]
This requirement has led to the development of scoring systems for predicting the mortality of patients admitted to ICU.[5] There are various scoring systems available for predicting the mortality and morbidity of patients. Acute Physiology and Chronic Health Evaluation (APACHE) III and Simplified Acute Physiology Score (SAPS) II are among the frequently used scores. There have been very few studies in Indian ICUs over comparison of scoring systems. Being a resource-limited nation, it becomes imperative for us to know where to apply or resources to generate good outcomes. This study is thus aimed at comparing the APACHE III and SAPS II score in predicting the outcome of sepsis, severe sepsis, and septic shock in patients admitted to the ICU and helps encourage the use of scoring systems for patient evaluation.
MATERIALS AND METHODS
This was an observational prospective cohort study. Patients having sepsis, severe sepsis, or septic shock admitted to the ICU (medical and surgical) of a tertiary care teaching hospital were included in the study based on the fulfillment of the inclusion criteria. The approval of the Institutional Ethical Committee was obtained in November 2014. Based on the previous studies, the mean scores of APACHE III and SAPS II in an ICU were calculated as 23.66 and 13.42, respectively. A sample size of 14 was calculated taking power of study as 80% and level of significance as 5%. It was decided to assess a total of 100 patients, and the study was conducted from November 2014 to August 2016.
The inclusion criteria were as follows: evidence of sepsis with two of the four systemic inflammatory response syndrome criteria (heart rate >90/min, respiratory rate >20/min or PaCO2<32 mmHg, temperature >100.9°F, and WBC count >12 × 109/L or <4 × 10⁹/L or >10% immature forms); presence of severe sepsis with at least one organ dysfunction (systolic blood pressure <90 mmHg or mean arterial pressure <70 mmHg, unexplained metabolic acidosis pH <7.30 or base deficit >5 mmol/L, urine output <0.5 ml/kg/h for 2 h or serum creatinine >2 mg/dl, PaO2/FiO2<250, platelet count 100 × 109/L or 50% drop in preceding 3 days or INR >1.5, bilirubin >2 mg/dl); and septic shock (persistence of hypotension despite adequate fluid resuscitation with the presence of organ dysfunction over the last 48 h). The exclusion criteria were age <16 years, patients requiring ICU admission for <24 h, burns patient, and patients with myocardial infarction.
All the patients were closely monitored and clinical data were recorded by the ICU residents and staff who were unaware of the study. The physiological parameters of 100 consecutive patients of sepsis who satisfied the inclusion criteria were recorded hourly. The heart rate, blood pressure (arterial invasive), and core temperature were recorded using the electronic bedside monitors attached to the patient. The respiratory rate was recorded by direct bedside physical count over 1 min. All the patients were catheterized in ICU for hourly urine output measurement. Arterial blood gas analysis of the patient was performed first on arrival to the ICU and then on 6–8 hourly basis. The relevant laboratory investigations of the patients were sent as soon as they arrived in ICU and then every morning as a routine protocol.
The data thus collected were analyzed 24 h after admission to ICU after the patients satisfied the inclusion criteria. The worst physiological and biochemical parameters recorded during the first 24 h were used for the purpose of scoring. Once the data were fed into the computer database, then the software for calculation of APACHE III and SAPS II score for the respective values were obtained. After obtaining the scores, the patients were then followed up for 28 days to assess their outcome. The outcome of the illness was classified into either survival or mortality and was charted into the computer database. The data tabulated were then analyzed to establish a correlation between the mortality prediction by the two scores and the actual mortality of the patient.
Statistical analysis
Statistical analysis was done using (IBM SPSS Statistics for Windows, Version 20.0. Armonk, NY: IBM Corp). Continuous data were expressed as mean ± standard deviation or median, categorical variables as frequencies, number, or percentage. Two independent sample t-test was used to compare the physiological parameters and biochemical parameters. Receivers operating characteristic (ROC) curve was used to find the cutoff value, area under the curve, and sensitivity and specificity of APACHE III and SAPS II score. Binary logistic regression with response variable as outcome (survival or mortality) was used to compare the two scores. P < 0.05 was considered statistically significant.
RESULTS
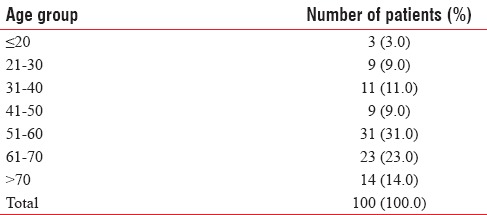
A total of 100 patients satisfying the inclusion criteria were studied. Of the 100 patients evaluated, 72 were male and 28 were female. Majority of the participants (54%) lay in the 51–70 years age group, out of which 31% were in 51–60 years age group and 28% were in 61–70 years age group [Table 1].
Table 1.
Age-wise distribution of patients
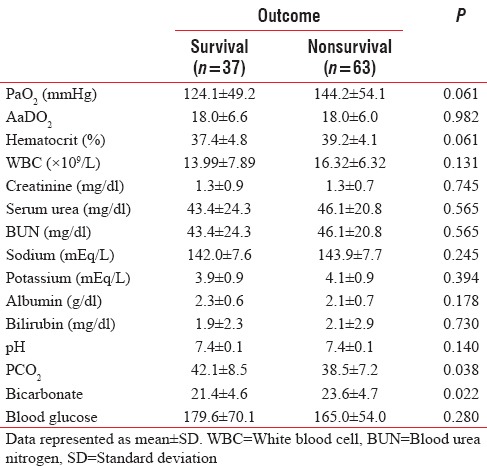
The presence of major comorbidities such as hypertension, diabetes, alcoholic liver disease, chronic kidney disease, and chronic obstructive pulmonary disease was found in 24%, 11%, 8%, 1%, and 1%, respectively. It was observed that 47% of the participants analyzed did not have any preexisting comorbidities [Figure 1]. The baseline physiological, biochemical, and laboratory parameters of all the patients were comparable except for PaCO2 which was lower and bicarbonate values which were higher in the nonsurvivor group as depicted in Tables 2 and 3.
Figure 1.
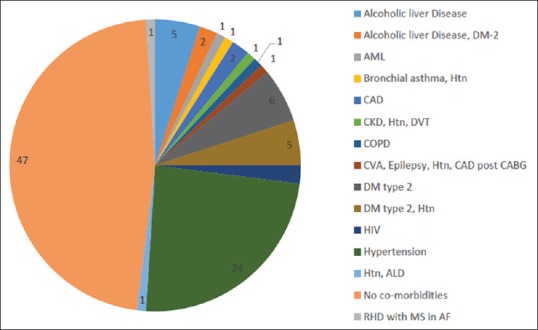
Distribution of comorbidities
Table 2.
Baseline physiological parameters of survivors versus nonsurvivors
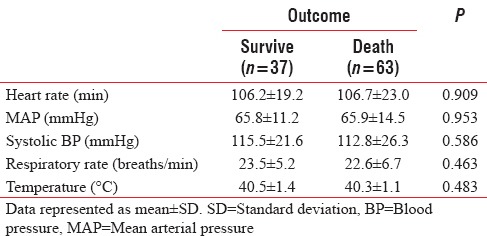
Table 3.
Baseline biochemical parameters of survivors versus nonsurvivors
Out of the 100 patients of sepsis, severe sepsis, or septic shock that were included in the study, a favorable outcome (survival) was observed in 37 patients, whereas 63 patients had an unfavorable outcome (mortality) at the end of 28 days.
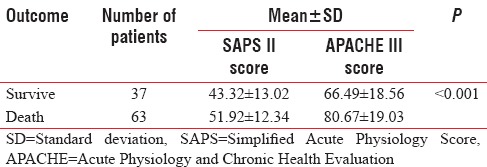
Both the APACHE III and SAPS II scores were calculated in all the 100 patients 24 h after their admission to ICU. The mean APACHE III score in the survivor group was low as compared to the nonsurvivor group. It was 66.49 ± 18.56 for the survivors, as opposed to 80.67 ± 19.03 for nonsurvivors. The APACHE III score was significantly higher for the nonsurvivor group with P < 0.001. In a similar manner, the correlation between higher SAPS II score and mortality as the 28-day outcome was also seen with P < 0.001. The mean SAPS II score for the survivor group was 43.32 ± 13.02 which was significantly lower than the nonsurvivor group 51.92 ± 12.34 [Table 4].
Table 4.
Mean Acute Physiology and Chronic Health Evaluation III and Simplified Acute Physiology Score II
The prediction success of APACHE III and SAPS II score was compared using the receiver operator curve or the ROC curve. The area under the ROC curve for APACHE III was 0.711 with 95% confidence interval of 0.612–0.797 [Figure 2]. The best cutoff value obtained for mortality prediction using the ROC curve is 69 with a sensitivity of 74.6 and specificity of 64.9.
Figure 2.
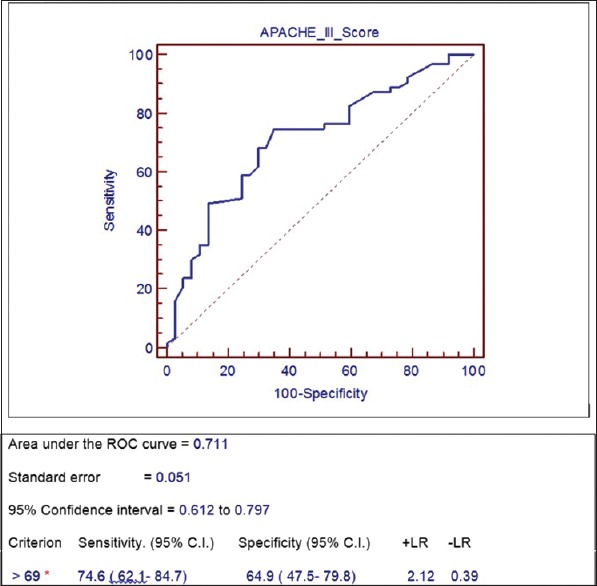
Receivers operating characteristic Acute Physiology and Chronic Health Evaluation III
The area under the ROC curve for SAPS II score was calculated as 0.686 with a 95% confidence interval of 0.586–0.775 [Figure 3]. The best cutoff value for mortality prediction using the ROC curve for SAPS II score was found as 49 with a sensitivity of 63.5 and specificity of 73.0.
Figure 3.
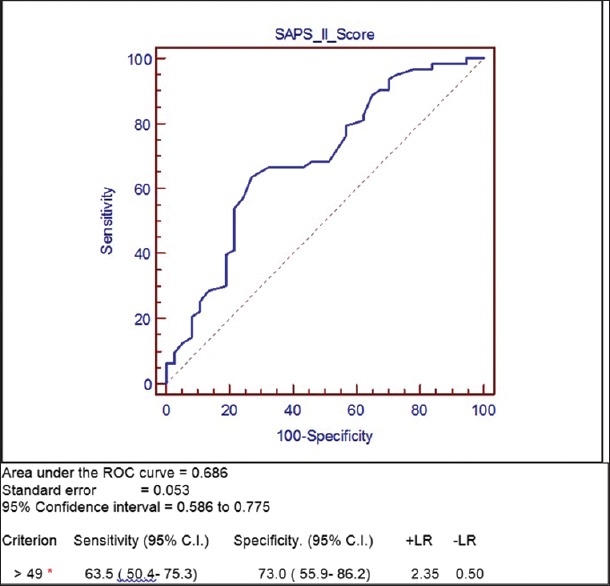
Receivers operating characteristic Simplified Acute Physiology Score II
As per the calculation obtained from the ROC curve, 69 was the value of APACHE III score which was best correlated with the mortality of the patient. APACHE III score of 60 patients was found to be >69, with a mean value of 87.81, of which 47 patients did not survive and 13 patients had a favorable outcome at the end of 28 days. The remaining 40 patients had APACHE III score <69 with a mean value of 56.37. Out of these 40 patients, 16 had an unfavorable outcome in the form of mortality. When compared with the actual mortality observed in the sample, which was seen in 63 patients, APACHE III score had accurately predicted mortality in 47 of these patients. A total of 47 patients out of the 63 patients who could not survive following sepsis had APACHE III score value >69. It was also observed that higher APACHE III scores correlated very well with mortality with P < 0.001.
As per the calculation obtained from the ROC curve, 49 was the value of SAPS II score which was best correlated with the mortality of the patient. SAPS II score of 50 patients was found to be >49, with a mean value of 58.71, of which 40 patients did not survive, but 10 patients had a favorable outcome at the end of 28 days. The remaining 50 patients had SAPS II score <49 with a mean value of 37.67. Out of these 50 patients with lower SAPS II scores, 23 had an unfavorable outcome in the form of mortality.
When compared with the actual mortality observed in the sample, which was seen in 63 patients, SAPS II score had accurately predicted mortality in 40 of these patients. Thus, expressing in other words, 40 of the 63 patients who could not survive had SAPS II score >49. It was also observed that higher SAPS II scores correlated well with mortality with P < 0.001.
On comparing the ROC curve of APACHE III with the SAPS II score, it was observed that the area under the curve was greater for APACHE III (0.711) as opposed to SAPS II (0.686) and was found to be a better predictor of mortality. The margin of difference in mortality prediction though was not found to be high.
DISCUSSION
The concept of scoring systems in ICU has been in practice for long. They were introduced and brought into practice for stratification of the patients and correct allocation of resources. These scoring systems used the physiological variables of the patient to predict the requirement for ICU admission and also to predict the outcome.[4]
Mortality rate is a key to identify and assess the quality of ICU care, including the use of best practices, accurate diagnosis, and effective and timely administration of therapies. ICU scoring systems provide mortality predictions based on ICU admission status/severity of illness. Although these predictions provide little value in managing individual patients, aggregate predictions correlate very well with observed outcomes in the reference population.[4]
There are several scoring systems and prognostic models in general use for outcome prediction in hospitalized patients. The rationale behind using these scales, commonly, is to rate illness severity to yield comparison between patients. Objective risk estimates are particularly important in the high cost, emotional, and technologically demanding environments of ICU. Due to the high costs of ICU, precise quality assurance and utilization management strategies are essential.[4,6,7]
The APACHE, the Mortality Probability Model (MPM), and the SAPS are the three most frequently used general severity-of-illness scores in adult ICU. The first generations of these scoring systems were introduced in critical care during the 1980s. They analyze the previous comorbidities of the patient along with the present physiological and laboratory parameters for risk assessment.[8]
Our study compared the effectiveness of predicting the outcome of sepsis patients using two widely employed scoring systems, namely, APACHE III and SAPS II. Sepsis is growing as a disease burden with increasing severity all across the globe including India.[4] Thus, being a resource-poor country, application of severity illness scoring systems to the patients being admitted to ICU becomes even more important for our case management.
This study revealed that both APACHE III and SAPS II scores were higher in the nonsurvivor group as compared to the survivor group with the mean value of 80.67 ± 19.03 and 51.92 ± 12.34, respectively, indicating that higher scores at the time of admission reflect increased mortality.
On plotting the ROC curve for the two scores, APACHE III score correlated better with the outcome prediction of patients with sepsis as opposed to SAPS II. The ROC curve also provided the best cutoff value for mortality prediction for both the scores. The value thus obtained helped in analyzing and comparing the number of patients who were predicted to have a poor outcome by these scores, with the actual number of patients with a poor outcome, that is, mortality. Using these cutoff values, thus obtained, it was found that the APACHE III score accurately predicted the mortality of 47 patients, while SAPS II accurately predicted the same for only 40 patients out of the total 63 patients who had mortality as their outcome at the end of the study period. Thus, there was a definite correlation between the actual mortality and that predicted by both these scores. Although there was slight underprediction of mortality by the SAPS II score, still it correlated well with the outcome of the patient and there was no difference between APACHE III and SAPS II statistically (P > 0.05). SAPS II employs only 17 variables as opposed to 20 variables in APACHE III. It is an easier score to calculate and if the predictability of outcome is comparable for the two scores, then the use of SAPS II becomes a better choice.
The study revealed that the patients had low PaCO2 and higher bicarbonate values at the time of admission. The lower PaCO2 value was suggestive of metabolic acidosis most likely due to early sepsis and hence poor survival. Though higher bicarbonate value does not suggest sepsis and metabolic acidosis on the contrary it suggests respiratory acidosis, yet these patients had poor outcomes in our study. These are two markers which can be readily available to us for the rapid and early assessment of the patients, but due to dearth of literature on them they are not routinely used. There is no data to suggest co-relation between higher bicarbonate values and mortality at present, and we believe this parameter requires further studies to accept it as a marker of early sepsis.
By far, there have been few studies in Indian setting for assessment of the mortality prediction scores or severity illness scores in the critical care environment. A study conducted by Dabhi et al., in sepsis patients comparing APACHE IV and SAPS II revealed that neither of the scores correlated with the mortality well as APACHE IV had underpredicted and SAPS II had overpredicted the mortality.[4]
In another study conducted by Hsu et al., at an ICU in a tertiary care center at China, it was observed that APACHE III correlated very accurately with the observed mortality rate as compared to APACHE II score.[9] In a study done by Jeon et al. for analysis the value of APACHE III, SAPS II, and procalcitonin in the assessment of infectious fever in ICU, it was found that both the APACHE III and SAPS II scores had closely predicted the same.[6] Xiao et al. conducted a study for comparing the prognostic value of APACHE III, SAPS II, Sequential Organ Failure Assessment (SOFA), APACHE II, and Multiple Organ Dysfunction Score and found that the SOFA score correlated best with the outcome of the patient followed by SAPS II and APACHE III.[10] Sekulic et al. analyzed various scoring systems including APACHE II, SAPS II, and MPM II in critically ill patients and concluded that APACHE II had a better prediction of mortality as compared to SAPS II.[11] In a similar study conducted by Gilani et al. in a surgical ICU, the results were found to be similar to the present study. They also concluded that the predictability of APACHE III and SAPS II was comparable to each other while APACHE II performed better.[12]
The ideal scoring system should not only be simple and reproducible but also reliable. The reliability should especially be high during the initial 2 days of patient admission so that patients at risk are not discharged too early potentially leading to ICU readmission and prolonged hospital stay, both of which are associated with higher mortality rates. Although we may use these systems as an adjunct to our risk stratification, none of them can replace the bedside assessment of a patient by the physician. They can only serve as an objective tool in decision-making. Although the scoring systems provide prognostication for the patient, they should not be used as sole basis for therapeutic decisions.[13]
The incidence of sepsis has been increasing multifold in our society and has been increasing the burden on limited resources. Use of mortality prediction formulas and severity illness scoring helps us in stratification of the patients and also in judicious allocation of resources.[14]
CONCLUSIONS
Judicious use and application of the scoring systems, especially in our setting, can help in effective usage of resources and would thus be significantly helpful in bringing the overall hospital mortality down. The present study reveals the comparable nature of APACHE III and SAPS II in terms of predictability of patient outcome although APACHE III had a statistically insignificant edge over SAPS II.
The employment of scoring systems to the critically ill patients admitted to ICU provides the clinician/intensivist with an important tool not only for improvement in decision-making but also for the prognostication of the families. However the study reveals both scoring systems have low sensitivity and specificity for mortality prediction, this is the limitation of using these systems. Thus, a study with a larger sample size is further required to find an ideal scoring system in setting of sepsis.
Financial support and sponsorship
Nil.
Conflicts of interest
There are no conflicts of interest.
REFERENCES
- 1.Munford RS. Severe sepsis and septic shock. In: Longo DL, Harrison TR, editors. Harrison's Principles of Internal Medicine. 18th ed. New York: McGraw-Hill; 2012. –20.pp. 4519 [Google Scholar]
- 2.Dellinger RP, Levy MM, Rhodes A, Annane D, Gerlach H, Opal SM, et al. Surviving sepsis campaign: International guidelines for management of severe sepsis and septic shock: 2012. Crit Care Med. 2013;41:580–637. doi: 10.1097/CCM.0b013e31827e83af. [DOI] [PubMed] [Google Scholar]
- 3.Zhou J, Qian C, Zhao M, Yu X, Kang Y, Ma X, et al. Epidemiology and outcome of severe sepsis and septic shock in Intensive Care Units in Mainland China. PLoS One. 2014;9:e107181. doi: 10.1371/journal.pone.0107181. [DOI] [PMC free article] [PubMed] [Google Scholar]
- 4.Dabhi AS, Khedekar SS, Mehalingam V. A prospective study of comparison of APACHE-IV & SAPS-II scoring systems and calculation of standardised mortality rate in severe sepsis and septic shock patients. J Clin Diagn Res. 2014;8:MC09–13. doi: 10.7860/JCDR/2014/9925.5052. [DOI] [PMC free article] [PubMed] [Google Scholar]
- 5.Alberti C, Brun-Buisson C, Burchardi H, Martin C, Goodman S, Artigas A, et al. Epidemiology of sepsis and infection in ICU patients from an international multicentre cohort study. Intensive Care Med. 2002;28:108–21. doi: 10.1007/s00134-001-1143-z. [DOI] [PubMed] [Google Scholar]
- 6.Jeon EJ, Jung JW, Choi JC, Shin JW, Park IW, Choi BW, et al. The value of procalcitonin and the SAPS II and APACHE III scores in the differentiation of infectious and non-infectious fever in the ICU: A prospective, cohort study. J Korean Med Sci. 2010;25:1633–7. doi: 10.3346/jkms.2010.25.11.1633. [DOI] [PMC free article] [PubMed] [Google Scholar]
- 7.Livingston BM, MacKirdy FN, Howie JC, Jones R, Norrie JD. Assessment of the performance of five intensive care scoring models within a large Scottish database. Crit Care Med. 2000;28:1820–7. doi: 10.1097/00003246-200006000-00023. [DOI] [PubMed] [Google Scholar]
- 8.Juneja D, Singh O, Nasa P, Dang R. Comparison of newer scoring systems with the conventional scoring systems in general intensive care population. Minerva Anestesiol. 2012;78:194–200. [PubMed] [Google Scholar]
- 9.Hsu CW, Wann SR, Chiang HT, Lin CH, Kung MH, Lin SL, et al. Comparison of the APACHE II and APACHE III scoring systems in patients with respiratory failure in a medical Intensive Care Unit. J Formos Med Assoc. 2001;100:437–42. [PubMed] [Google Scholar]
- 10.Xiao K, Guo C, Su L, Yan P, Li X, Xie L, et al. Prognostic value of different scoring models in patients with multiple organ dysfunction syndrome associated with acute COPD exacerbation. J Thorac Dis. 2015;7:329–36. doi: 10.3978/j.issn.2072-1439.2014.11.27. [DOI] [PMC free article] [PubMed] [Google Scholar]
- 11.Sekulic AD, Trpkovic SV, Pavlovic AP, Marinkovic OM, Ilic AN. Scoring systems in assessing survival of critically ill ICU patients. Med Sci Monit. 2015;21:2621–9. doi: 10.12659/MSM.894153. [DOI] [PMC free article] [PubMed] [Google Scholar]
- 12.Gilani MT, Razavi M, Azad AM. A comparison of Simplified Acute Physiology Score II, Acute Physiology and Chronic Health Evaluation II and Acute Physiology and Chronic Health Evaluation III scoring system in predicting mortality and length of stay at surgical Intensive Care Unit. Niger Med J. 2014;55:144–7. doi: 10.4103/0300-1652.129651. [DOI] [PMC free article] [PubMed] [Google Scholar]
- 13.Doerr F, Badreldin AM, Heldwein MB, Bossert T, Richter M, Lehmann T, et al. A comparative study of four intensive care outcome prediction models in cardiac surgery patients. J Cardiothorac Surg. 2011;6:21. doi: 10.1186/1749-8090-6-21. [DOI] [PMC free article] [PubMed] [Google Scholar]
- 14.Bos L, Schouten L, van Vught L, Wiewel M, Ong D, Cremer O, et al. ESICM lives 2016: Part One. Intensive Care Med Exp. 2016;4:27. [Google Scholar]


