Abstract
Background and Aims:
Currently, there is a lack of real-time metric with high sensitivity and specificity to diagnose sepsis. Insulin sensitivity (SI) may be determined in real-time using mathematical glucose-insulin models; however, its effectiveness as a diagnostic test of sepsis is unknown. Our aims were to determine the levels and diagnostic value of model-based SI for identification of sepsis in critically ill patients.
Materials and Methods:
In this retrospective, cohort study, we analyzed SI levels in septic (n = 18) and nonseptic (n = 20) patients at 1 (baseline), 4, 8, 12, 16, 20, and 24 h of their Intensive Care Unit admission. Patients with diabetes mellitus Type I or Type II were excluded from the study. The SI levels were derived by fitting the blood glucose levels, insulin infusion and glucose input rates into the Intensive Control of Insulin-Nutrition-Glucose model.
Results:
The median SI levels were significantly lower in the sepsis than in the nonsepsis at all follow-up time points. The areas under the receiver operating characteristic curve of the model-based SI at baseline for discriminating sepsis from nonsepsis was 0.814 (95% confidence interval, 0.675–0.953). The optimal cutoff point of the SI test was 1.573 × 10⁻⁴ L/mu/min. At this cutoff point, the sensitivity was 77.8%, specificity was 75%, positive predictive value was 73.7%, and negative predictive value was 78.9%.
Conclusions:
Model-based SI ruled in and ruled out sepsis with fairly high sensitivity and specificity in our critically ill nondiabetic patients. These findings can be used as a foundation for further, prospective investigation in this area.
Keywords: Critical care, diagnosis, insulin sensitivity, model-based, sepsis
INTRODUCTION
Sepsis can sometimes be difficult to diagnose, and its distinction from noninfectious conditions in critically ill patients is often a challenge. Relying on clinical features of infection alone is challenging as these may not be obvious in some patients.[1] A positive culture is considered the most accepted tool to diagnose infection; however, this takes 24–48 h, or longer, to process.[2] More rapid diagnosis can be achieved using a variety of biomarkers, such as C-reactive protein, procalcitonin, and interleukin-6;[1] however, a minimum lag time of typically 2–3 h is still present and successes are varied.[2] Therefore, other markers must be investigated to assist in making the timeliest diagnosis of sepsis.
Sepsis is known to have a negative effect on insulin sensitivity (SI).[3,4,5] It has been suggested that sepsis induces a counter-regulatory hormone response, i.e., glucagon, catecholamines, cortisol, and growth hormone which increases insulin resistance thereby decreasing insulin action.[3,4,5,6] Thus, low SI and sepsis are strongly linked; however, its effectiveness as a diagnostic test of sepsis has only been investigated in few small studies outside our local setting.[7,8] Adding to the complexity in the study of SI in sepsis is that, not only sepsis, but other severe illness and effects through metabolic changes could be responsible for a low SI in critically ill patients.[9] A further study with more careful methodological framework conducted in our local Intensive Care Unit (ICU) is therefore warranted.
SI can be derived using mathematical glucose-insulin models that have had extensive clinical validation.[10,11,12] An example of one such model is the intensive control of insulin-nutrition-glucose (ICING) model, which has been rigorously validated within clinically acceptable ranges.[12] The model relates the rate of glucose decay to the concentration of insulin availability in the interstitium to assess SI. In the model's equations, there is only one parameter that needs to be identified which is SI of each patient. All other parameters are population constants based on prior studies and clinical data, i.e., blood glucose (BG) levels, insulin infusion, and glucose input rates. SI can be derived at the bedside using application software incorporating such model and thus can provide real-time information to the clinicians. Derivation of SI does not involve extra procedures or costs outside of those required for BG control in the ICU. Despite those reliability and simplicity of ICING model, the diagnostic value of model-based SI for sepsis is largely unknown.
The purpose of the present study was to determine the levels and diagnostic value of model-based SI for sepsis in critically ill patients. We tested the hypothesis that SI levels are significantly lower in sepsis than in nonsepsis and thus able to discriminate these two groups of patients with a good performance in the critical care setting.
MATERIALS AND METHODS
Study designs and participants
This was a retrospective cohort study performed in the ICU of a major tertiary hospital in Pahang, Malaysia, from June 2014 to May 2016. The inclusion criteria were consecutive adult patients who received insulin infusion in the first 24 h of their ICU admission. The insulin infusion protocol was based on the guideline for BG management in the ICU by the Malaysian Society of Intensive Care (2012).[13] The guideline recommends to perform BG level on ICU admission and start the protocol when the BG exceeds 10 mmol/L for two consecutive readings, 1 h apart. The aim was to maintain BG between 6 and 10 mmol/L.
All patients in whom the diagnosis of diabetes mellitus (DM) Type I or Type II was known from their past medical history were excluded from the study to remove any bias from their lower SI due to DM. Such diagnosis was usually made by their primary care physicians and for the most common form of DM, i.e., Type II, this was based on the criteria outlined in the local clinical practice guideline by Ministry of Health Malaysia.[14] Patients were also excluded if their ICU admission was <24 h or if the data required to calculate SI were incomplete. The study was approved by the Local Medical Research and Ethics Committee and was registered under the National Medical Research Registry (NMRR-13-1592-18706). A waiver of consent was approved due to the retrospective nature of the study.
Glucose-insulin system model
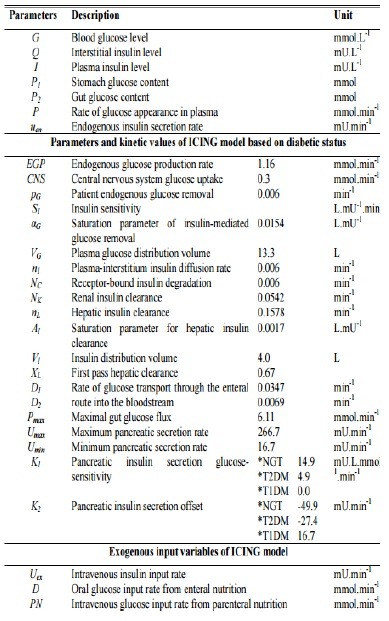
The glucose-insulin system model used in this study is the ICING model and is listed in equations (1) to (7) [Appendix 1].[12] In these equations, there is only one parameter that needs to be identified which is SI of each patient. All other parameters are population constants based on prior studies and clinical data, i.e., BG levels, insulin infusion, and glucose input rates [Appendix 1]. By fitting these population, constants and clinical data into the model's equations, SI of each patient can be derived.
Data collection
We reviewed the ICU chart to obtain baseline demographic and clinical data including age, sex, body mass index, initial Simplified Acute Physiological Score II, Sequential organ failure assessment score, septic shock, comorbidities as assessed by Charlson Comorbidity Index, treatment received in the first 24 h, length of ICU, and hospital stays and ICU mortality. Patients who were admitted with sepsis were confirmed clinically by the judgement of senior intensive care clinicians and/or by positive blood culture. Sepsis and septic shock were defined according to the American College of Chest Physicians/Society of Critical Care Medicine Consensus Conference.[15] Patients who were nonsepsis were deemed so if there was no suspicion of infection and by negative blood culture. To derive the SI profiles, we collected BG levels, insulin infusion and glucose input rates that the patients received at 1 (baseline), 4, 8, 12, 16, 20, and 24 h of their ICU admission.
Statistical analysis
Data are presented as mean ± standard deviation or median (interquartile range), and comparison of variables between the sepsis and nonsepsis groups was analyzed using independent t-test or Mann–Whitney test. Normality of data was tested with Shapiro–Wilk test. Categorical variables are presented as frequency (percentage) and were compared with Chi-squared test. Changes in mean BG over time between the two groups were compared using repeated-measures analysis of variance (ANOVA). The diagnostic performance of the model-based SI was assessed by the area under the receiver operating characteristic curve (AUROC) of the sensitivity against 1-specificity across a series of SI readings. The AUROC ranges from 0.5 (no discrimination) to 1 (perfect discrimination).[16,17] Clinical validity is assumed at an AUROC of more than 0.7. The optimal cutoff point was defined as the measured quantity, which maximized sensitivity and specificity. The sensitivity, specificity, predictive values, and likelihood ratios of the test at the optimal cutoff point were calculated. Statistical analysis was performed using SPSS version 24.0 (IBM, Armonk, NY, USA) and MedCalc for Windows, version 17.5.5 (MedCalc Software, Ostend, Belgium).
Sample size calculation
A minimum sample size of 10 sepsis and 10 nonsepsis patients was required to achieve the relevant anticipated AUROC of 0.8, based on the diagnostic performance of the SI test in a previous study,[7] at a significance level of 5%, power of 80%, and allocation ratio of 1.
RESULTS
Baseline demographics, clinical characteristics, and outcomes
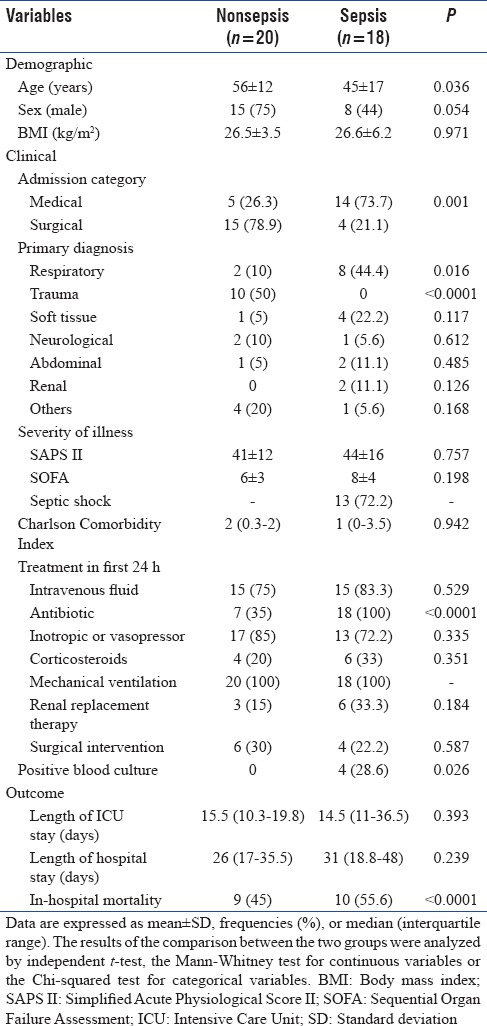
Throughout the study, a total of 210 patients requiring insulin infusion protocol were screened for eligibility, of whom 38 patients were included and classified to the sepsis group (n = 18) or the nonsepsis group (n = 20) [Figure 1]. The baseline demographics, clinical characteristics, and outcomes as stratified by sepsis status are presented in Table 1. Patients with sepsis were younger (P = 0.036) and mostly were medical cases (P = 0.001) compared with nonsepsis. Most patients in the sepsis group had respiratory as their primary diagnosis class (P = 0.001), whereas most nonsepsis was classified as trauma (P < 0.0001). Antibiotic use was higher in the sepsis group for obvious reason (P < 0.0001), although 7 or 35% of patients in the nonsepsis group also required antibiotic for surgical prophylaxis. The rate of positive blood culture in the sepsis group was 28.6%. In relation to outcome, the in-hospital mortality rate was significantly higher in those diagnosed with sepsis compared with nonsepsis (P < 0.0001).
Figure 1.
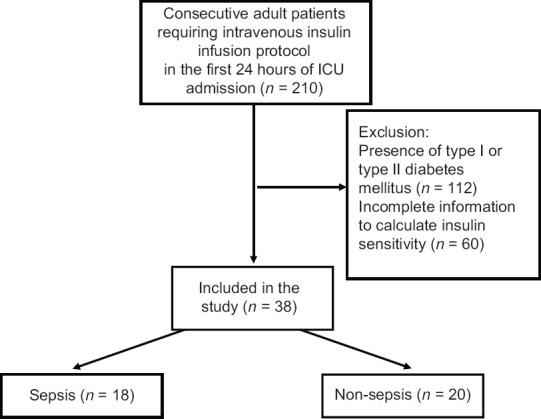
Flowchart of patient selection
Table 1.
Baseline demographics, clinical characteristics, and outcomes of nonsepsis and sepsis
Blood glucose, insulin infusion, and glucose input profiles
The BG levels over the entire study duration for all patients in both sepsis and nonsepsis groups are shown in Figure 2. Repeated-measures ANOVA showed BG was higher in the sepsis group compared to the nonsepsis group (P = 0.005) and significant effect of time (P < 0.0001). The mean intravenous insulin received in the first 24 h was higher in sepsis compared with nonsepsis with the difference approaching statistical significance (37.5 ± 16.6 vs. 28.4 ± 10.8 IU, P = 0.051). The mean enteral glucose input in the first 24 h was lower in those with sepsis compared with nonsepsis (58.1 ± 51.1 vs. 95.5 ± 42.8 mg, P = 0.019). There was no statistically significant difference in the mean parenteral glucose input between the sepsis and nonsepsis groups (72.9 ± 108.7 vs. 57.1 ± 58 Gm, P = 0.575).
Figure 2.
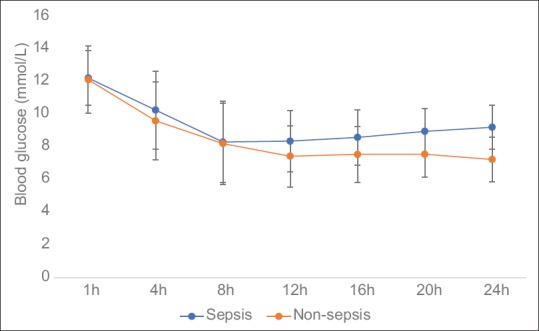
The blood glucose profiles (in mmol/L) in the first 24 h of admission of nonsepsis and sepsis. Data are expressed as mean ± standard deviation
Insulin sensitivity profiles
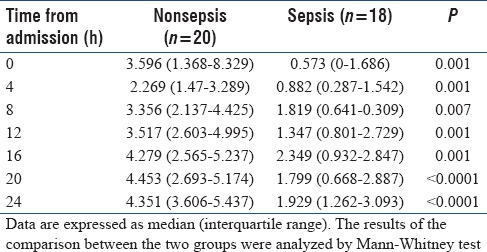
Median changes in SI (×10−4 L/mu/min) during the first 24 h of ICU admission are shown in Table 2. At all follow-up time points, SI was lower in patients who were diagnosed with sepsis than those without sepsis (P < 0.05). SI decreased from baseline to hour 4 in the nonsepsis group, but gradually increased thereafter although it did not attain the baseline value by h 24. Changes in SI are more variable in the sepsis group; however, the general trend is an increase from the baseline to h 24 of ICU stay.
Table 2.
Insulin sensitivity profiles (× 10−4 L/mU/min) in the first 24 h of Intensive Care Unit admission and their diagnostic performance for sepsis
Diagnostic performance of insulin sensitivity
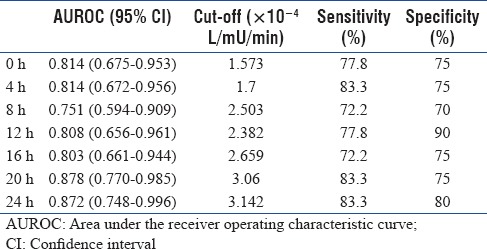
Table 3 shows the AUROC of the model-based SI for the diagnosis of sepsis. The AUROC of the test was more than 0.8 at majority of the time points, which suggested its good performance for discriminating sepsis from nonsepsis. At baseline, at the optimal cutoff value of 1.573 × 10⁻⁴ L/mu/min, the sensitivity and specificity of model-based SI were 77.8% and 72%, respectively. The positive predictive value was 73.7%, the negative predictive value was 78.9%, the positive likelihood ratio was 2.8, and the negative likelihood ratio was 0.3.
Table 3.
Diagnostic performance of model-based insulin sensitivity for sepsis
DISCUSSION
This retrospective single-center study was carried out to provide proof of concept and preliminary information on the usefulness of model-based SI as a real-time marker of sepsis in critically ill nondiabetic patients. The median value of model-based SI in healthy volunteers established from a previous study is 14.225 L/mu/min.[18] A markedly reduced SI from the value during health was demonstrated in our cohort regardless of their sepsis status indicating that SI was affected by critical illness. When analyzed by their sepsis status, SI within 24 h of ICU admission were significantly lower in patients diagnosed with sepsis than in those without sepsis. In both groups of patients, SI tended to increase over time which we postulate may be due to improvement in condition of the patients as critical care therapy and monitoring began. Analysis of the receiver-operating characteristic curve assumed that the model-based SI was a clinically valid marker with an AUROC more than 0.7 at each follow-up time point.
In a retrospective study of 30 patients with sepsis conducted in a Christchurch ICU, similar to our study, significant relationship between lower SI and presence of sepsis was observed.[8] However, the median SI of their sepsis cohort was 4.153 × 10⁻⁴ L/mU/min. The SI was markedly lower in our sepsis patients; 0.573 × 10⁻⁴ L/mU/min. We postulated that lower SI in our cohort is due to the high prevalence of undiagnosed DM in our population although this postulation needs to be ascertained. Lower SI in our cohort yielded to a lower cutoff point of the baseline SI test observed in our study, 1.573 × 10⁻⁴ L/mU/min, compared to 4.5 × 10⁻⁴ L/mU/min in the previous study.[8]
In another retrospective study of 143 critically ill patients, low SI was found not useful as a sepsis diagnostic test with a low positive predictive value of 2.8%, but a far higher negative predictive value of 99.8% was observed making the test suitable for ruling out but not for ruling in sepsis.[7] In our study, we found that low SI was able to diagnose sepsis with 84.2% certainty, while high SI ruled out sepsis with 88.9% certainty. The positive results could be due to the consequence of higher sepsis severity in our cohort; 72.2% of our patients were in septic shock on admission compared to 9.8% in the previous study.[7] This agrees to the hypothesis that greater severity of sepsis yields to better prediction of the condition using SI.[8] In both of the previous studies,[7,8] many potential confounders on SI were not recorded. For example, low SI can be exacerbated by the use of corticosteroids,[19,20] which are sometimes indicated in the treatment of sepsis.
Biomarker tests have been developed to facilitate early diagnosis of sepsis; however, they still suffer some disadvantages. Over the last several decades, C-reactive protein and more recently procalcitonin and interleukin-6 have emerged as biomarkers for identifying sepsis. However, these biomarkers have been used with varying success.[21] Furthermore, as with other test measured in the laboratory, by the time, the results are available to the clinicians, they may not represent the current status of the highly dynamic critically ill patients. SI can be measured hourly at the bedside and thus could provide real-time information to the clinicians. Obtaining the value of SI does not rely on processing of the test in the laboratory. This could avoid delay in the decision-making and treatment as with tests that are measured in the laboratory. Measurement of SI does not involve extra procedure or costs outside of those required for BG control in the ICU. Thus, SI has the potential to be cost-effective enough that it can be utilized routinely in patients' diagnosis.
This study has several pertinent limitations. First, patients who have Type I or Type II DM were excluded from this study. The prevalence of Type II DM is high in some ICU settings.[22,23] Thus, additional studies on this specific cohort must be done to extend the methods used here for application in those cases. Second, patients with undiagnosed DM as well as those in the prediabetic state may have not been excluded from our study contributing to lower SI being observed. Approximately 12% of all hyperglycaemic patients being admitted to ICU have no previous diagnosis of DM.[24] This limitation can be overcome in future studies by screening the patients using hemoglobin A1c on admission. Third, as model-based SI was only studied in hyperglycemic patients who received intravenous insulin infusion, our results is of limited clinical applicability to the general ICU population. Fourth, in addition to testing the model-based SI as a standalone biomarker, its performance could have been compared with classic or well-studied biomarkers such as procalcitonin and interleukin-6. Last, the results that we generated in this study predicted our single-centered data set, but whether it is generalizable to external populations is unknown.
CONCLUSIONS
Presence of sepsis was associated with a significantly lower SI levels in our critically ill non-diabetic patients. Sepsis can be ruled out when model-based SI is above 1.573 x10⁻⁴ L/mu/min and can be ruled in when SI is below the cut-off, with fairly high sensitivity and specificity. This preliminary study showed the potential of model-based SI as a new diagnostic marker for sepsis in critically ill non-diabetic patients. The findings can be used as a foundation for further, prospective investigation in this area.
Financial support and sponsorship
Nil.
Conflicts of interest
There are no conflicts of interest.
Appendix 1: Intensive control of insulin-nutrition-glucose model equations and nomenclatures

Ṗ1 = –d1P1+D(t) (4)
Ṗ2 = –min(d2P2,Pmax)+d1P1 (5)
P(t) = min(d2P2,Pmax)+PN(t) (6)
 ; when C-peptide data is not available (7)
REFERENCES
- 1.Vincent JL. The clinical challenge of sepsis identification and monitoring. PLoS Med. 2016;13:e1002022. doi: 10.1371/journal.pmed.1002022. [DOI] [PMC free article] [PubMed] [Google Scholar]
- 2.Carrigan SD, Scott G, Tabrizian M. Toward resolving the challenges of sepsis diagnosis. Clin Chem. 2004;50:1301–14. doi: 10.1373/clinchem.2004.032144. [DOI] [PubMed] [Google Scholar]
- 3.Agwunobi AO, Reid C, Maycock P, Little RA, Carlson GL. Insulin resistance and substrate utilization in human endotoxemia. J Clin Endocrinol Metab. 2000;85:3770–8. doi: 10.1210/jcem.85.10.6914. [DOI] [PubMed] [Google Scholar]
- 4.Chambrier C, Laville M, Rhzioual Berrada K, Odeon M, Boulétreau P, Beylot M, et al. Insulin sensitivity of glucose and fat metabolism in severe sepsis. Clin Sci (Lond) 2000;99:321–8. [PubMed] [Google Scholar]
- 5.Rusavy Z, Macdonald IA, Sramek V, Lacigova S, Tesinsky P, Novak I, et al. Glycemia influences on glucose metabolism in sepsis during hyperinsulinemic clamp. JPEN J Parenter Enteral Nutr. 2005;29:171–5. doi: 10.1177/0148607105029003171. [DOI] [PubMed] [Google Scholar]
- 6.Virkamäki A, Yki-Järvinen H. Mechanisms of insulin resistance during acute endotoxemia. Endocrinology. 1994;134:2072–8. doi: 10.1210/endo.134.5.8156907. [DOI] [PubMed] [Google Scholar]
- 7.Blakemore A, Wang SH, Le Compte A, M Shaw G, Wong XW, Lin J, et al. Model-based insulin sensitivity as a sepsis diagnostic in critical care. J Diabetes Sci Technol. 2008;2:468–77. doi: 10.1177/193229680800200317. [DOI] [PMC free article] [PubMed] [Google Scholar]
- 8.Suhaimi FM, Chase JG, Pretty CG, Shaw GM, Razak NN, Jamaludin UK. Insulin sensitivity and sepsis score: A correlation between model-based metric and sepsis scoring system in critically ill patients. Biomed Signal Process Control. 2017;32:112–23. [Google Scholar]
- 9.Li L, Messina JL. Acute insulin resistance following injury. Trends Endocrinol Metab. 2009;20:429–35. doi: 10.1016/j.tem.2009.06.004. [DOI] [PMC free article] [PubMed] [Google Scholar]
- 10.Chase JG, Shaw GM, Lotz T, LeCompte A, Wong J, Lin J, et al. Model-based insulin and nutrition administration for tight glycaemic control in critical care. Curr Drug Deliv. 2007;4:283–96. doi: 10.2174/156720107782151223. [DOI] [PubMed] [Google Scholar]
- 11.Lotz TF, Chase JG, McAuley KA, Shaw GM, Wong XW, Lin J, et al. Monte Carlo analysis of a new model-based method for insulin sensitivity testing. Comput Methods Programs Biomed. 2008;89:215–25. doi: 10.1016/j.cmpb.2007.03.007. [DOI] [PubMed] [Google Scholar]
- 12.Lin J, Razak NN, Pretty CG, Le Compte A, Docherty P, Parente JD, et al. Aphysiological intensive control insulin-nutrition-glucose (ICING) model validated in critically ill patients. Comput Methods Programs Biomed. 2011;102:192–205. doi: 10.1016/j.cmpb.2010.12.008. [DOI] [PubMed] [Google Scholar]
- 13.Malaysian Society of Intensive Care. Blood glucose management in the intensive care unit: Insulin infusion protocol. Management protocols in ICU. 2012;2:73–5. [Google Scholar]
- 14.Health Ministry of Malaysia. Clinical practice guidelines; management of type 2 diabetes. Clin Pract Guidel Manag Type 2 Diabetes. 2009;5:73. [Google Scholar]
- 15.Levy MM, Fink MP, Marshall JC, Abraham E, Angus D, Cook D, et al. 2001 SCCM/ESICM/ACCP/ATS/SIS international sepsis definitions conference. Crit Care Med. 2003;31:1250–6. doi: 10.1097/01.CCM.0000050454.01978.3B. [DOI] [PubMed] [Google Scholar]
- 16.Bewick V, Cheek L, Ball J. Statistics review 13: Receiver operating characteristic curves. Crit Care. 2004;8:508–12. doi: 10.1186/cc3000. [DOI] [PMC free article] [PubMed] [Google Scholar]
- 17.Cook NR. Use and misuse of the receiver operating characteristic curve in risk prediction. Circulation. 2007;115:928–35. doi: 10.1161/CIRCULATIONAHA.106.672402. [DOI] [PubMed] [Google Scholar]
- 18.Lotz TF, Chase JG, McAuley KA, Shaw GM, Docherty PD, Berkeley JE, et al. Design and clinical pilot testing of the model-based dynamic insulin sensitivity and secretion test (DISST) J Diabetes Sci Technol. 2010;4:1408–23. doi: 10.1177/193229681000400616. [DOI] [PMC free article] [PubMed] [Google Scholar]
- 19.Dimitriadis G, Leighton B, Parry-Billings M, Sasson S, Young M, Krause U, et al. Effects of glucocorticoid excess on the sensitivity of glucose transport and metabolism to insulin in rat skeletal muscle. Biochem J. 1997;321(Pt 3):707–12. doi: 10.1042/bj3210707. [DOI] [PMC free article] [PubMed] [Google Scholar]
- 20.Qi D, Rodrigues B. Glucocorticoids produce whole body insulin resistance with changes in cardiac metabolism. Am J Physiol Endocrinol Metab. 2007;292:E654–67. doi: 10.1152/ajpendo.00453.2006. [DOI] [PubMed] [Google Scholar]
- 21.Chan T, Gu F. Early diagnosis of sepsis using serum biomarkers. Expert Rev Mol Diagn. 2011;11:487–96. doi: 10.1586/erm.11.26. [DOI] [PubMed] [Google Scholar]
- 22.Plummer MP, Bellomo R, Cousins CE, Annink CE, Sundararajan K, Reddi BA, et al. Dysglycaemia in the critically ill and the interaction of chronic and acute glycaemia with mortality. Intensive Care Med. 2014;40:973–80. doi: 10.1007/s00134-014-3287-7. [DOI] [PubMed] [Google Scholar]
- 23.Krinsley JS, Egi M, Kiss A, Devendra AN, Schuetz P, Maurer PM, et al. Diabetic status and the relation of the three domains of glycemic control to mortality in critically ill patients: An international multicenter cohort study. Crit Care. 2013;17:R37. doi: 10.1186/cc12547. [DOI] [PMC free article] [PubMed] [Google Scholar]
- 24.Hensen J, Thomas T, Mueller-Ziehm J, Worthmann W, Kleine E, Behrens EM, et al. Management of diabetes mellitus and hospital-related hyperglycemia in patients of a medical ICU, with the use of two “down-to-earth” protocols: A feasibility study. Exp Clin Endocrinol Diabetes. 2007;115:577–83. doi: 10.1055/s-2007-980177. [DOI] [PubMed] [Google Scholar]


