It is well established1 that light flashes produce a succession of oxidation events in photosystem II (PSII), driving an initially dark-equilibrated sample (the S1-state) through a series of states (S2 and S3) that represent the accumulation of oxidizing equivalents at the Mn-containing oxygen-evolving complex (OEC), while electrons are transferred to a remote acceptor site. Recently Kupitz et al.2 claimed that significant photoinduced conformational changes are observed in PSII using “diffract before destroy” X-ray crystallography techniques at an X-ray free-electron laser (XFEL) source. While crystallography experiments can potentially give mechanistic insights into PSII-mediated water splitting, (1) the authors’ illumination conditions are not suited to move a significant fraction of the system into the S3-state and (2) their claim of conformational differences between the S1-state and the 2-flash sample is not supported by their crystallographic data. Therefore, the data published do not provide additional mechanistic details for oxygen evolution.
(1) Stable charge separation after light absorption is a prerequisite for S‐state advancement of the OEC. Due to the slow acceptor-side kinetics for the final electron transfer step from quinones QA to QB, a delay between flashes on the order of >100 ms is routinely used for quantitative formation of the higher S-states. Although no direct kinetic data are available for the crystals used by Kupitz et al., rate constants are available for same-species PSII preparations3,4. Based on purified protein, the 210 μs flash-spacing used in the XFEL experiment2 can yield at best 20% of the centers being populated in the S3-state at the moment of the XFEL probe, 570 μs after the second flash3–5. Alternatively, using measured rate constants for intact thylakoids or membrane fragments6, at most 23% of the centers have reoxidized QA 210 μs after the first light flash and are able to undergo stable charge separation after the second flash to form the S3 state. The reported EPR data (Extended Data Fig. 1f, g in ref. 2) were recorded with a flash-spacing of 1 second and therefore do not indicate successful S-state turnover with the almost 5000-fold shorter flash-spacing used during the XFEL experiments.
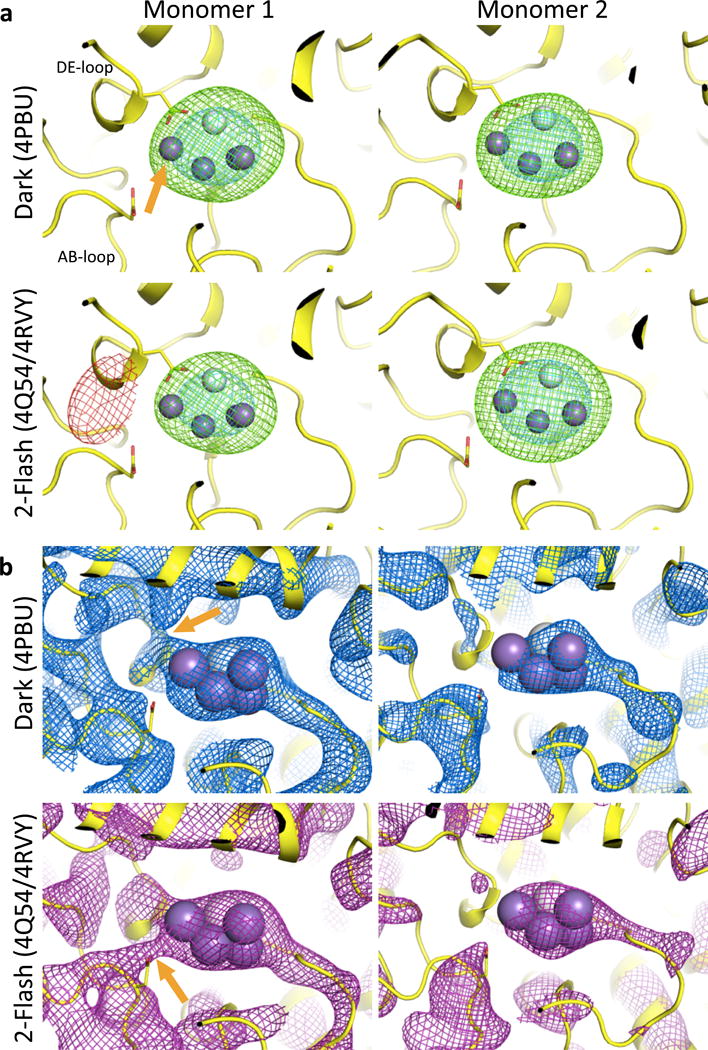
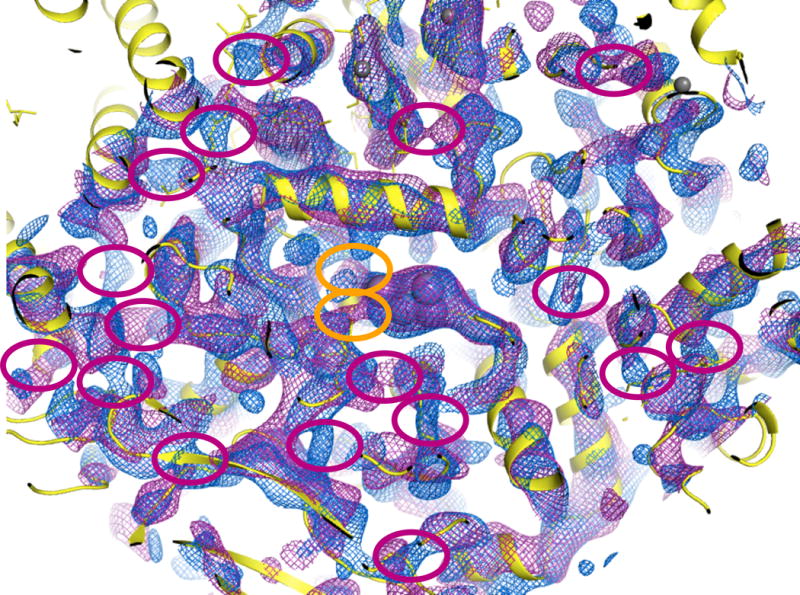
(2) The analysis of the crystallographic electron density is problematic for multiple reasons: a) No mFo-DFc difference maps were reported, although such maps are the most indicative of small changes in the OEC. b) Inspection of the deposited structures (Protein Data Bank accession codes 4PBU and 4Q54) revealed that the authors transposed the two PSII monomers in the 2-flash state relative to the dark state. As a result, the differences interpreted to arise from flash states could have arisen from the differing crystal environments between the two monomers.* c) The changes in the density surrounding the OEC presented in the authors’ Figure 3 are not reproducible using the majority of well-validated methods for map calculation (with or without bias removal, Fig. 1a). Only when generating simulated annealing (SA) omit maps exactly as published2 using phenix.autobuild (a program that was never intended to reveal fine structural details), were we able to reproduce partially the claimed changes in the region of the OEC, but only for one of the two monomers (Fig. 1b). However, these maps are very sensitive to uncertainties in the atomic model used for phasing, and inspecting a slightly larger area of the SA omit map produced by the authors’ protocol reveals numerous areas with similar differences between the light and dark states (ellipses in Fig. 2). If these were true structural changes, one would conclude that the entire protein backbone is modified by illumination. However, the most likely interpretation is that the differences are below the significance level of the experiment, given the limited resolution (5.0 and 5.5Å) of the diffraction data.
Figure 1.

a) Simulated annealing mFo-DFc omit maps generated by phenix.refine with the OEC set to zero occupancy and surrounding atoms restrained. Green and red mesh: +/− 3.0σ; cyan mesh: +6.0σ; in the dark (PDB id 4PBU) and 2-flash states (PDB id 4Q54 with corrected monomer assignment, equivalent to PDB id 4RVY). No change of the density around Mn4 (indicated by an orange arrow) is visible when comparing dark and 2-flash data. b) phenix.autobuild SA-omit maps recalculated following the ref. 2 protocol, contoured at 1.5σ. Orange arrows indicate the claimed conformational change. No changes are visible in Monomer 2. Purple spheres: Mn; white sphere: Ca.
Figure 2.

View of larger area around the OEC in monomer 1, showing phenix.autobuild SA-omit maps contoured at 1.5σ as in Fig. 1b (blue = 4PBU, purple = 4Q54 with corrected monomer assignment as in 4RVY). Orange ellipses: structural differences claimed by Kupitz et al. Red ellipses: additional map differences throughout the structure, showing that the claimed differences at the OEC are within the noise level of these electron density maps.
In summary, femtosecond X-ray crystallography at XFEL sources promises to provide great insights into complex biological systems such as PSII. However, every care has to be taken to ensure that the correct states are being studied and that the interpretation is consistent with the level of uncertainty in the data. These requirements are not fulfilled in the work by Kupitz et al.2
Methods
The maximum possible S3-state population was calculated using t1/2(S2→S3) = 70 μs, t1/2(QA−→QB−)=0.54 ms4,5, a miss factor of 10%, and 100% quinone occupancy of the QB acceptor site. Alternatively t1/2fast(QA−→QB−)=0.2 ms and t1/2slow(QA− →QB−)=1.6 ms with a ratio of 0.47:0.53, and an overall fraction of centers involved in QA−→QB− electron transfer of 0.75 was used6. Relative monomer placement between states was analyzed with phenix.emma7, and the molecules placed on the same crystallographic origin using phenix.find_alt_orig_sym_mate8. This led to the conclusion that the monomers in the 2-flash state coordinate file (4Q54) are swapped relative to the dark state file (4PBU). SA omit maps were calculated using the atomic coordinates and experimental data deposited in the Protein Data Bank for 4PBU and 4Q54 (with correctly swapped monomer assignment as in 4RVY), with OEC atoms set to zero occupancy and using either phenix.refine9,10 with surrounding atoms tightly restrained (Fig. 1a) or phenix.autobuild9,10 in the composite_omit mode (Figs. 1b,2).
Footnotes
After bringing this to the authors’ attention they deposited an updated coordinate file for the 2-flash state (PDB accession code 4RVY) correcting the transposition of monomer labels.
The authors declare no competing financial interests.
All authors participated in writing the paper.
References
- 1.Kok B, Forbush B, McGloin M. Photochemistry and Photobiology. 1970;11:457–475. doi: 10.1111/j.1751-1097.1970.tb06017.x. [DOI] [PubMed] [Google Scholar]
- 2.Kupitz C, et al. Nature. 2014;513:261–265. doi: 10.1038/nature13453. [DOI] [PMC free article] [PubMed] [Google Scholar]
- 3.Krivanek R, et al. Biochimica et Biophysica Acta. 2007;1767:520–527. doi: 10.1016/j.bbabio.2007.02.013. [DOI] [PubMed] [Google Scholar]
- 4.Zimmermann K, et al. Biochimica et Biophysica Acta. 2006;1757:106–114. doi: 10.1016/j.bbabio.2005.12.002. [DOI] [PubMed] [Google Scholar]
- 5.Noguchi T, et al. Biochemistry. 2012;51:3205–3214. doi: 10.1021/bi300294n. [DOI] [PubMed] [Google Scholar]
- 6.de Wijn R, van Gorkom HJ. Biochemistry. 2001;40:11912–11922. doi: 10.1021/bi010852r. [DOI] [PubMed] [Google Scholar]
- 7.Grosse-Kunstleve RW, Adams PD. Acta Crystallogr D Biol Crystallogr. 2003;59:1974–1977. doi: 10.1107/s0907444903021206. [DOI] [PubMed] [Google Scholar]
- 8.Oeffner RD, Bunkóczi G, Read RJ. Computational Crystallography Newsletter. 2012;3:5–10. [Google Scholar]
- 9.Adams PD, et al. Acta Crystallogr D. 2010;66:213–221. doi: 10.1107/S0907444909052925. [DOI] [PMC free article] [PubMed] [Google Scholar]
- 10.Afonine PV, et al. Acta Crystallogr D. 2012;68:352–367. doi: 10.1107/S0907444912001308. [DOI] [PMC free article] [PubMed] [Google Scholar]


