
Figure 1.
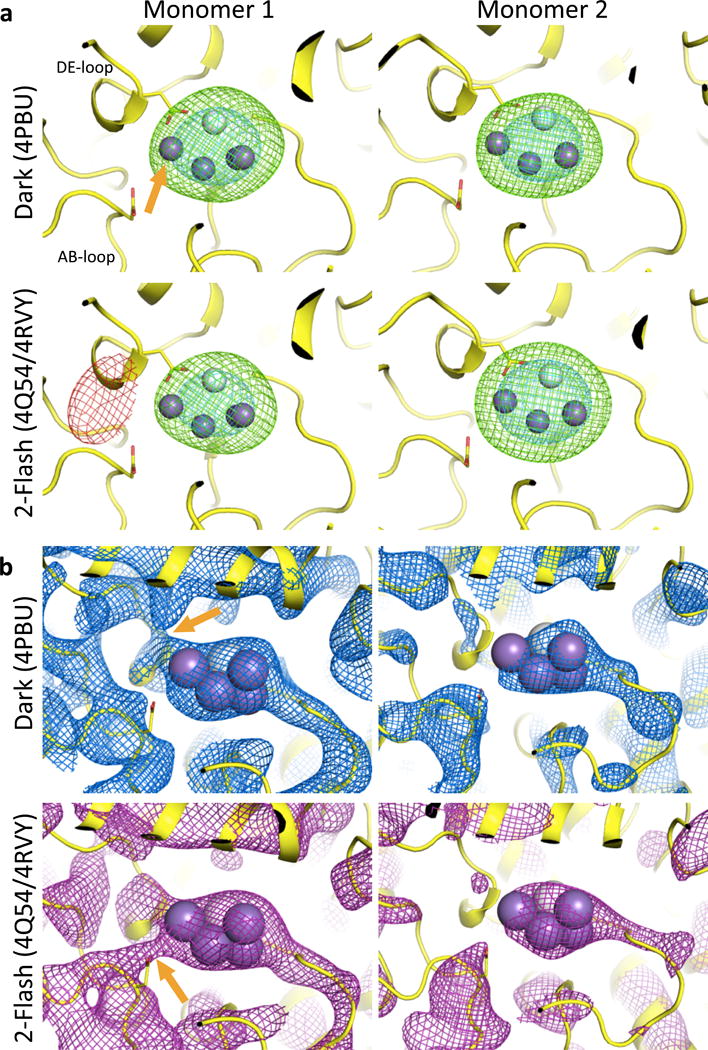
a) Simulated annealing mFo-DFc omit maps generated by phenix.refine with the OEC set to zero occupancy and surrounding atoms restrained. Green and red mesh: +/− 3.0σ; cyan mesh: +6.0σ; in the dark (PDB id 4PBU) and 2-flash states (PDB id 4Q54 with corrected monomer assignment, equivalent to PDB id 4RVY). No change of the density around Mn4 (indicated by an orange arrow) is visible when comparing dark and 2-flash data. b) phenix.autobuild SA-omit maps recalculated following the ref. 2 protocol, contoured at 1.5σ. Orange arrows indicate the claimed conformational change. No changes are visible in Monomer 2. Purple spheres: Mn; white sphere: Ca.