Abstract
Measurement of total suspended solids (TSS) and total dissolved solids (TDS) loadings in streams is often used to assess potential impacts from mining on surface water quality within a drainage basin. It has been suggested that TSS could be used as an indicator to estimate TDS loading through the use of a TDS/TSS ratio. The reliability of this approach was tested by examining empirical linear relationships between TSS and TDS loads at three locations within a mining-influenced watershed in Colorado. Predictive accuracy of the relationships was assessed using an independent source of data for the same locations, with comparisons between estimated and observed TDS loads for periods within and outside the years used to develop relationships. Evaluations were conducted over the entire flow regime and for separate periods of low- and high-flow. Improved representation of the data was achieved by incorporation of a regressed average baseflow contribution, indicating the relationship between TDS and TSS loads is not accurately represented by a simple ratio. High variability in data between locations prevents application of a basin scale relationship to all locations within that basin. Local-scale relationships developed under specific flow regimes resulted in more accurate predictions, but results suggest that factors additional to flow may need to be considered to improve predictability. Usefulness of linear empirical relationships to predict TDS load from TSS load will depend on the magnitude of uncertainty that is tolerable for a given situation.
Keywords: TDS/TSS ratio, TMDL, water quality monitoring
Introduction
The extraction of mineral and energy resources has the potential to increase both total suspended solids (TSS) and total dissolved solids (TDS) loading to an adjacent waterbody. Examples of mining-related activities that could lead to TSS and TDS production include mine site preparation, sorting, crushing, and washing of materials, and storage of materials that may be exposed to precipitation. Total suspended solids are defined in the American Public Health Association (APHA) Standard Methods (Rice et al. 2012) as the organic and inorganic material in a known volume of a water sample that is retained by a filter with a pore size of 2 μm or less. TSS is measured by weighing the dried material on the filter. TDS is defined as the portion of organic and inorganic solids passing through the same filter (Rice et al. 2012). The TDS concentration can be determined directly by weighing the residue remaining following evaporation of a known volume of the filtered water sample. Alternatively, TDS can be calculated indirectly by summation of measured concentrations of constituents in the filtrate or estimated by multiplying a measured conductivity value by an empirically determined conversion factor between 0.5 and 0.9. The exact factor depends on the solution’s composition and is determined through linear regression of repeated paired measurements of specific conductance and TDS. However, when the exact conversion factor is not known, 0.67 commonly is used as an approximation for most natural water systems (Gupta 2011; Weiner 2013).
The composition of TSS may include sand, silt, clay, mineral precipitates, and biological matter. TSS formation primarily depends on physical processes driven by hydrology. Processes that generate TSS in streams include erosion of adjacent surface soils and stream banks, scouring of the streambed, and aggregation of dissolved organic matter or chemical precipitation of inorganic solids within the water column (Hudson-Edwards 2003). TDS composition may include salts, metals, metalloids, and dissolved organic matter. Processes that generate organic TDS in streams include release of organic molecules during biological growth (e.g. plant roots, microbes) and decay of biological matter within the stream or stream bank. Processes that generate inorganic TDS in streams include dissolution of soil/sediment minerals, desorption of ions attached to solids, and introduction of ions present in atmospheric precipitation and groundwater discharge. Formation of inorganic TDS by dissolution and desorption depends on many parameters associated with biological and chemical processes, such as pH, ionic strength, temperature, and concentrations of dissolved oxygen and organic carbon. Additionally, some rocks release ions from their minerals easily when water flows over them (e.g. carbonaceous rocks), while others, such as granitic rocks, are more resistant to dissolution (Byrne et al 2012); thus, residence time of the overlying water is important. The sources discussed above are not all-inclusive, but demonstrate the wide variety of biological, chemical, and physical processes that contribute to the origin, composition, fate, and transport of both TSS and TDS in stream systems.
Native aquatic organisms are acclimated to some level of existing TDS and TSS concentrations, but increases in loads can degrade aquatic ecosystems through several mechanisms. TSS increases the turbidity of a waterbody, which decreases light penetration, which in turn impairs photosynthetic activities of aquatic plants, potentially leading to oxygen depletion (Bilotta and Brazier 2008). Additionally, TSS can result in fish kills through clogging of their gills (Bilotta and Brazier 2008). Suspended sediment may settle to the streambed in quiescent stream sections, potentially smothering fish eggs or other benthos. TDS is an aggregate measure of the amount of soluble components in a waterbody. The specific ions and their concentrations contributing to TDS may cause ecotoxicological effects (Society of Environmental Toxicology and Chemistry 2004; Weber-Scannell and Duffy 2007). TDS also can contaminate groundwater via recharge to the aquifer and exceed drinking water standards.
The United States Clean Water Act (CWA, 33 U.S.C. § 1251 et seq.) requires authorization of all point source discharges under a national pollutant discharge elimination system (NPDES, CWA Section 402) permit. While different states may have different permit limits for TSS and TDS in given streams depending on allowable total maximum daily loads (TMDLs, CWA Section 303(d)), each are monitored to assess potential degradation of water quality and to track effectiveness of controls placed to minimize their release. Water quality is also monitored in many streams where there is no known point source. In-stream increases in either TSS or TDS may suggest an anthropogenic influence, which can then be investigated through assessment of additional water quality parameters and constituent concentrations.
To simplify TMDL development or monitoring requirements, it has been proposed to use a TDS/TSS ratio to estimate TDS loading and to predict reduction in TDS load based on reductions in TSS load achieved by best management practice (BMP) controls. In review of the literature, however, the authors could not find any studies that had validated development and use of a TDS/TSS ratio for these purposes. Whether or not TDS and TSS present in a stream water sample at a given point in time and space are directly related is a function of each’s origin and composition, and their responses to external factors, such as the magnitude of streamflow. Higher streamflow (resulting from either storms or seasonally-controlled discharge) can carry particles having both a larger size and a higher mass, while larger particles generally settle to the streambed at a lower discharge. Thus, it is expected that a ratio would differ in time based on streamflow. In mineralized areas, increased groundwater inflows may contribute increased inorganic TDS loads. In a case where TDS originates solely from the TSS, or vice versa, and outside influences affect each proportionally, there would be a direct relationship.
Studies examining the relationship between TDS and TSS in mining-influenced watersheds are scarce; however, the relationship has been studied with respect to erosional processes and land denudation rates (e.g. Einsele 1992; Milliman 1997; Milliman and Farnsworth 2011; Ran et al. 2015). Einsele (1992) notes that there is no clear relationship between TSS and TDS loads, but that some general trends for regions of different climate and topography can be identified. Ran et al. (2015) found that TSS flux increased faster than the TDS flux in China’s Yellow River Basin. Examining data from a number of river systems, Milliman (1997) and Milliman and Farnsworth (2011) note that highland river systems show increasing TSS/TDS load ratios with decreasing basin area. The higher ratios in smaller highland river basins is suggested to be due to decreased chemical weathering relative to mechanical weathering, potentially due to limited storage capacity (Milliman 1997), as well as suggesting that there is a “…subtle but important difference in the source and delivery of fluvial suspended sediment and dissolved solids” (Milliman and Farnsworth 2011). Milliman and Farnsworth (2011) also note that TSS/TDS load ratios appear relatively constant in lowland river systems, regardless of basin size.
This study sought to determine if a simple linear relationship existed between TDS and TSS loads that then could be used to accurately predict TDS loads from TSS load measurements. The relationship between TSS and TDS loads as a function of time, location, and the magnitude of streamflow was examined for three locations within a watershed influenced by historical metal mining. Empirical linear relationships with and without a forced zero-intercept (herein referred to as constrained and unconstrained, respectively) were developed for the individual study locations, combinations of study locations, and high and low flow conditions based on TDS and TSS loads during a fixed period. The accuracy and reliability of these empirical relationships were then evaluated through comparison of observed TDS loads and estimated TDS loads derived from observed TSS loads reported in an independent source of data covering periods within and outside of the fixed study period.
Materials and Methods
Study Site
The Upper Clear Creek (CC) Watershed (HUC8 subbasin: 10190004) covers an area of 1,021 km2 (394 mi2, Upper Clear Creek Watershed Association 2014) and is located in the Rocky Mountains along the eastern slope of the Front Range west of Denver, Colorado, in Clear Creek, Gilpin, and Jefferson Counties. The watershed ranges in elevation from 1,710 m (5,610 ft) AMSL to 4,351 m (14,275 ft) AMSL (USGS 2016a), is drained by high-gradient streams, is impacted by historical metal mining, and was listed on the National Priorities List (NPL) in 1983. In 1996, the U.S. Geological Survey (USGS) estimated there were 1,343 abandoned or inactive mines in the Clear Creek Watershed (Federer 1996). These mines are located within a number of different historic mining districts; further information on mines and minerals within the districts is provided by the Colorado Geologic Survey’s online database (http://coloradogeologicalsurvey.org/mineral-resources/historic-mining-districts/).
The Colorado School of Mines (CSM) conducted sampling in a portion of the CC Watershed over 2.5 years as part of a larger study. The three sampling locations were located at USGS gages: 1) CC-40, located on the mainstem of CC about 3 km upstream from the confluence with North Fork Clear Creek (NCC); 2) CC-50, located on NCC, less than one km upstream from the confluence with the CC mainstem; and 3) CC-60, located on the mainstem of CC about 16 km downstream from the confluence with NCC. These identifiers follow the Upper Clear Creek Watershed Association (UCCWA) nomenclature, but also are known as CC-SW-4 (CC-40), CC-SW-1 (CC-60), and NCC-SW-3 (CC-50) when following the nomenclature of the Colorado Dept. of Public Health and Environment. The sampling locations are shown on Fig. 1, along with the HUC12 subwatersheds associated with them. Also shown on Fig. 1 is an additional, unmonitored (in this study) HUC12 subwatershed drainage area positioned between the CC-50 and CC-60 study locations.
Fig. 1.
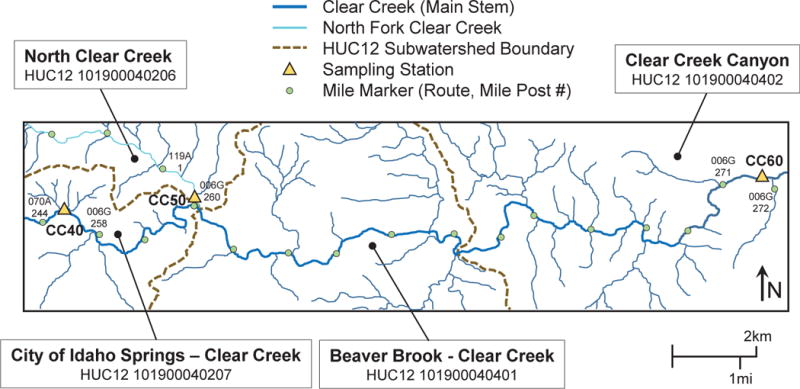
Sampling site locations of the Clear Creek Watershed section, following the Upper Clear Creek Watershed Assoc. (UCCWA) nomenclature and associated HUC12 subwatershed subunits; map was derived from https://www.coloradodnr.info/H5V/Index.html?Viewer=mapviewer
Suspended sediment at CC-40 originates predominantly from scouring of streambed sediments and erosional material washed in from the watershed (Butler et al 2008). The site was historically influenced by input from mine drainage, but since 1998 these inputs have been treated by a water treatment facility at Idaho Springs, CO (≈ 9 km upstream from CC-40), which has improved water quality in Clear Creek (Upper Clear Creek Watershed Association 2014). North Fork Clear Creek currently is influenced by mine drainage and chemical precipitation; transport of metal oxyhydroxides is the dominant source of TSS at CC-50 (Butler et al 2008). The TSS sources at CC-60 include what is transported from CC-40 and CC-50, and what is derived from in-stream scouring and input of erosional material from the watershed (Butler et al 2008).
Data Evaluation and QA/QC
This work used dissolved element concentrations (filtered at 0.45 μm) determined by ICP-AES (Perkin–Elmer Optima-3000) for calculation of TDS, measured TSS (filtered at 0.45 μm; weighed on a Mettler MT5 balance), alkalinity (Hach™ digital titrator), date, and time data from samples collected by CSM on 39 sampling dates between February 2003 and July 2004 to evaluate and consider relationships between TDS and TSS loads. A single disposable syringe filter was used to obtain both the dissolved metals and TSS samples for each event. Additional details for the sampling and analytical methods used to obtain the CSM data are discussed in detail in Butler et al. (2008); the rest of this section focuses on the use of these secondary data.
Some TSS data were noted as being in error; therefore, those samples were not used in this work. For TDS, available filtered metals data included Al, As, B, Ba, Be, Ca, Cd, Co, Cr, Cu, Fe, K, Li, Mg, Mn, Mo, Na, Ni, P, Pb, S, Sb, Se, Si, Sn, Sr, Ti, V, and Zn. Some sampling dates had more than 20% difference between field duplicates (one site duplicated for each sampling date), primarily for elements having concentrations below the analytical quantitation limit (QL). Duplicates were treated as independent samples for this study. When present in field blanks above their analytical detection limit (DL, three times the standard deviation of a blank run ten times), ions other than boron were at concentrations at least an order of magnitude less than the lowest measured concentration and generally at levels less than the QL (defined as 10 times the DL). Boron was present in field blanks at concentrations similar to those measured in the samples and therefore was not used for this study. Concentrations of Al, As, Be, Cd, Co, Cr, Mo, P, Pb, Sb, Se, Sn, Ti, and V were either below their respective DL or QL and were not used for this study. Sulfate concentrations were calculated by multiplying the ICP-measured S concentrations by three and HCO3− concentrations were calculated by multiplying the alkalinity as mg/L CaCO3 by 1.22 (all alkalinity was bicarbonate alkalinity). No other anion data were available.
To evaluate suitability of the dissolved element data, a charge balance was calculated for each water sample using a method similar to that reported by Fritz (1994) from total, filtered analyte concentrations, assuming the following ionic species: Ba+2, Ca+2, Cu+2, Fe+2, K+1, Li+1, Mg+2, Mn+2, Na+1, Ni+2, Sr+2, Zn+2, HCO3−1, and SO42−. Charge balance errors ranged from 6-22% for CC-40, 10-30% for CC-50, and 6-27% for CC-60. Concentrations of NO3/NO2 at all sites in 2003 and 2004 were below 0.6 mg/L and dissolved phosphorus was below 8 μg/L (1994-2013, UCCWA data provided by Tim Steele, TDS Consulting, Denver, 2016). Because the low concentrations of these ions would contribute little to the charge balance, chloride was assumed to be the dominant missing ion and used to balance the charges to 5%. The mass of chloride necessary to balance charge to 5% was 14% or less (CC-40 and CC-60) and 12% or less (CC-50) than the total mass of each sample, with the exceptions of the CC-50 replicate samples from 3/24/03 (21%), CC-40 sample from 4/8/03 (18%), and CC-60 sample from 3/24/03 (18%). Because all but one of these were < 20%, the CSM data were determined to be acceptable.
Streamflow
To calculate loads, streamflow data were obtained from the USGS National Water Information System (USGS 2016b). The three USGS site IDs and descriptions are:
CC-40: Clear Creek above Johnson Gulch near Idaho Springs, CO, USGS #06718300
CC-50: North Clear Creek above mouth near Blackhawk, CO, USGS #06718550
CC-60: Clear Creek at Golden, CO, USGS #06719505
When instantaneous data were unavailable (typically late fall and winter months), or when sampling times were not provided (independent UCCWA data 2008-2009 used for testing described in "Evaluating linear TDS-TSS relationships" below), average daily streamflow data were used. Instantaneous data used were for the time closest to the sample collection time. For developing relationships, average daily data were used for 2/11/03 at all sites, 3/11/03 at CC-40 and CC-50, 3/24/03 at CC-60, 6/17/03 at CC-50, from 10/10/03 through 2/27/04 at CC-50, and from 11/22/03 through 2/27/04 at CC-40 and CC-60.
To differentiate between high and low flows, a distribution of streamflow data for the 39 CSM sampling dates was developed for each site. The plots were examined for the first large inflection point representing a change in flow from low to high. Additionally, the 50th-percentile values were calculated for each dataset. Each of these methods arrived at the same streamflow values indicating the lower limits for the high-flow data: CC-40 3.03 m3s−1 (107 ft3s−1), CC-50 0.243 m3s−1 (8.6 ft3s−1), and CC-60 2.83 m3s−1 (100 ft3s−1).
Developing Empirical TDS-TSS Relationships
TDS concentration was calculated from the CSM data using the following equation:
TSS and TDS loads were calculated and examined as a function of time and streamflow. TDS/TSS load ratios for individual samples also were examined as a function of streamflow. Constrained and unconstrained linear relationships between TDS and TSS loads were developed for each of the scenarios in Table 1. For Scenario 1, TDS and TSS load data were pooled over all dates and sites, and then regressed to determine whether a single linear relationship (constrained or unconstrained) could reliably estimate TDS load across all sites in the watershed over all stream flows. For Scenario 2, a similar relationship was developed using only the mainstem sampling locations (CC-40 and CC-60). Linear relationships also were developed for each individual sampling location based on all flows (Scenario 3) and under separate low- and high-flow conditions (Scenario 4) to evaluate the expectation that ratios would differ as a function of flow.
Table 1.
Parameters for linear relationships developed between TSS and TDS loads for all scenarios (TDS load = m* TSS load + b)a
| Scenario | Description | Equation | m | b | R2 | Slope P | RSS |
|---|---|---|---|---|---|---|---|
| ID | value | ||||||
| 1 | All sites, all sampling dates | S1-1 | 1.42 | 2.87×10⁴ | 0.43 | < 0.0001 | 1.13×10¹¹ |
| S1-2 | 1.95 | 0 | 0.47 | < 0.0001 | 2.09×10¹¹ | ||
| 2 | CC-40 + CC-60, all sampling dates | S2-1 | 1.19 | 4.27×10⁴ | 0.44 | < 0.0001 | 7.22×10¹⁰ |
| S2-2 | 1.95 | 0 | 0.47 | < 0.0001 | 2.08×10¹¹ | ||
| 3 | CC-40, all sampling dates | S3-1 | 1.54 | 4.18×10⁴ | 0.28 | 0.0002 | 3.48×10¹⁰ |
| S3-2 | 3.00 | 0 | 0.39 | < 0.0001 | 9.81×10¹⁰ | ||
| S3-3 | 2.16 | 3.38×10³ | 0.72 | < 0.0001 | 2.11×10⁸ | ||
| CC-50, all sampling dates | S3-4 | 3.01 | 0 | 0.70 | < 0.0001 | 5.94×10⁸ | |
| CC-60, all sampling dates | S3-5 | 1.14 | 4.24×10⁴ | 0.54 | < 0.0001 | 3.65×10¹⁰ | |
| S3-6 | 1.77 | 0 | 0.56 | < 0.0001 | 1.01×10¹¹ | ||
| 4 | CC-40, low-flow (< 3.03 m3s−1) | S4-1 | 6.24 | 2.12×10⁴ | 0.54 | 0.0001 | 3.33×10⁸ |
| S4-2 | 21.24 | 0 | 0.55 | < 0.0001 | 6.09×10⁹ | ||
| CC-50, low-flow (< 0.243 m3s−1) | S4-3 | 8.12 | 1.83×10³ | 0.70 | < 0.0001 | 7.98×10⁶ | |
| S4-4 | 16.03 | 0 | 0.82 | < 0.0001 | 3.78×10⁷ | ||
| CC-60, low-flow (< 2.83 m3s−1) | S4-5 | 20.63 | 1.82×10⁴ | 0.70 | < 0.0001 | 3.68×10⁸ | |
| S4-6 | 44.95 | 0 | 0.90 | < 0.0001 | 1.95×10⁹ | ||
| CC-40, high-flow (≥ 3.03 m3s−1) | S4-7 | 0.79 | 6.48×10⁴ | 0.14 | 0.0762 | 1.89×10¹⁰ | |
| S4-8 | 2.95 | 0 | 0.42 | 0.0005 | 8.65×10¹⁰ | ||
| CC-50, high-flow (≥ 0.243 m3s−1) | S4-9 | 1.87 | 4.65×10³ | 0.67 | < 0.0001 | 1.60×10⁸ | |
| S4-10 | 2.95 | 0 | 0.75 | < 0.0001 | 4.37×10⁸ | ||
| CC-60, high-flow (≥ 2.83 m3s−1) | S4-11 | 0.90 | 5.87×10⁴ | 0.44 | 0.0003 | 2.76×10¹⁰ | |
| S4-12 | 1.76 | 0 | 0.61 | < 0.0001 | 8.31×10¹⁰ |
Parameters were determined from regression data analysis using Microsoft Office 365 ProPlus Excel® 2016
Errors associated with TDS included standard deviations of the filtered element concentrations from triplicate ICP-AES measurements (ranging from ≈ 0.1% to ≈ 10% across all elements and samples) and a ± 1% error associated with the measurement of alkalinity. A ± 2% error was estimated for TSS concentrations, with ± 1% uncertainty in measured volume originating from syringes used and ± 1% from uncertainty in measured weights. An estimate of 6% error was assumed for streamflow data (Sauer and Meyer 1992). Errors were propagated through load calculations using the root-mean-square approach (Topping 1972).
Evaluating Linear TDS-TSS Relationships
Data collected by the UCCWA at CC-60, CC-50, and CC-40 from 1994-2014 were provided to the authors by Tim Steele (TDS Consulting 2016). UCCWA data used in this study included date, time (except 2008-2011), average daily flow (cfs), conductivity (μS/cm), and TSS (mg/L) (SM 2540D). TDS (mg/L) was calculated from the UCCWA data by multiplying conductivity values by 0.67. Dates selected for testing the accuracy and reliability of TDS-TSS relationships included 2003-2004 (to match dates over which relationships were developed), 1995-1997 (3 years from a prior period), and 2007-2009 (3 years from a post period). CC-40 was not evaluated for the post period because the record for streamflow ended in 2005 and thus loads could not be calculated. Scenarios 1-3 were evaluated using all samples within the respective date ranges, while Scenario 4 was evaluated using samples having flow data fitting the conditions of the relationship developed. Dates having TSS or conductivity data noted as anomalous or having undefined qualifications within the UCCWA data compilation were not used.
Results
TDS and TSS Load Relationships
TDS and TSS loads and streamflow are presented for each sampling location in Fig. 2 as a function of time. A TDS/TSS load ratio specific for each sampling date for each of the three monitoring locations is presented as a function of streamflow in Fig. 3. Relationship parameters for all scenarios are presented in Table 1, where constrained relationships are indicated by b = 0. Fig. 4a compares constrained and unconstrained relationships derived for Scenarios 1 and 2, and the Scenario 3 relationship for CC-50; Figs. 4b and 4c show unconstrained relationships derived under Scenario 4 for low-flow and high-flow conditions, respectively. Plotting on a linear scale resulted in individual data markers being difficult to discern due to large ranges in data values for each monitoring location, especially at lower loads, so graphs in Fig. 4 are plotted on log-log scales for ease of viewing.
Fig. 2.
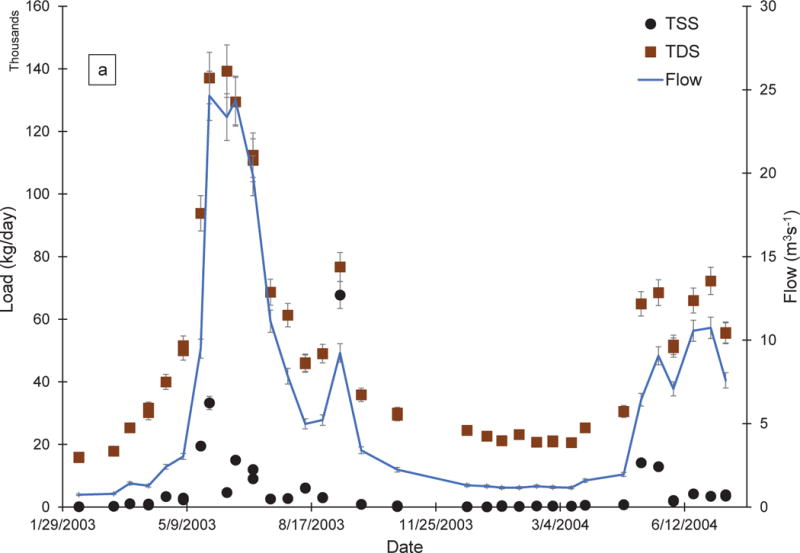
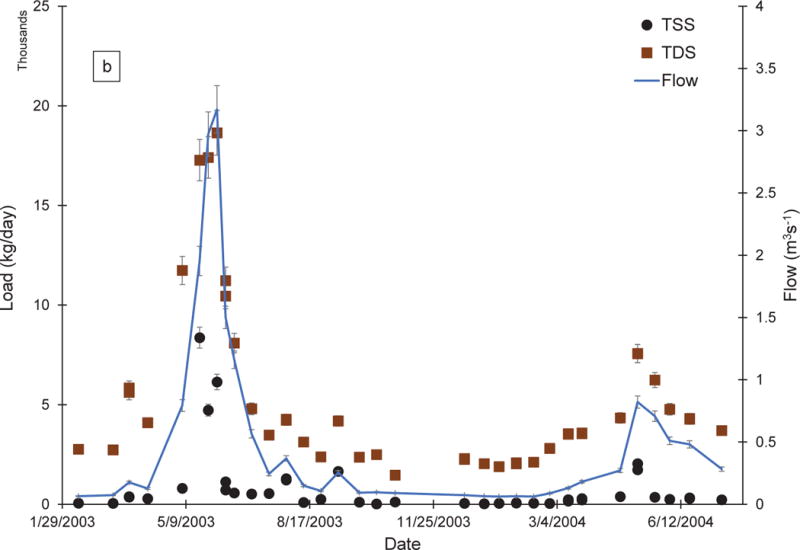
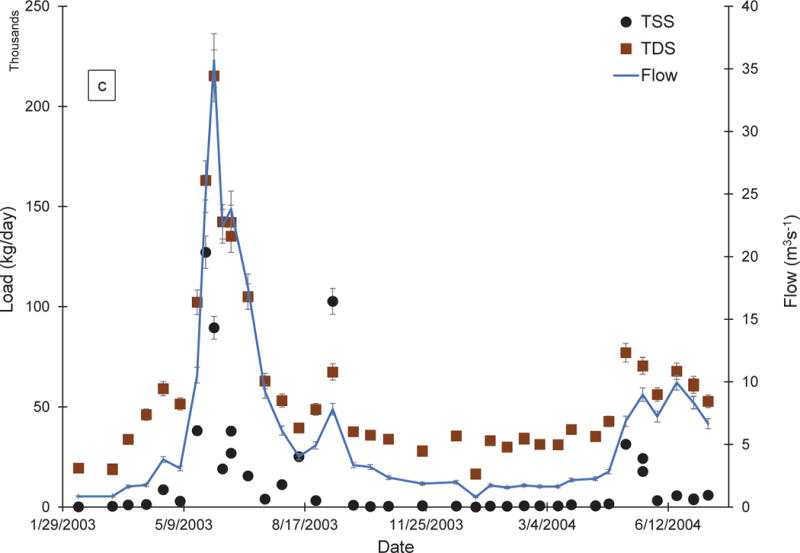
TDS load (brown squares), TSS load (black circles), and flow (solid blue line) over time for CC-40 (a), CC-50 (b), and CC-60 (c). Error bars represent propagated known and estimated measurement errors
Fig. 3.
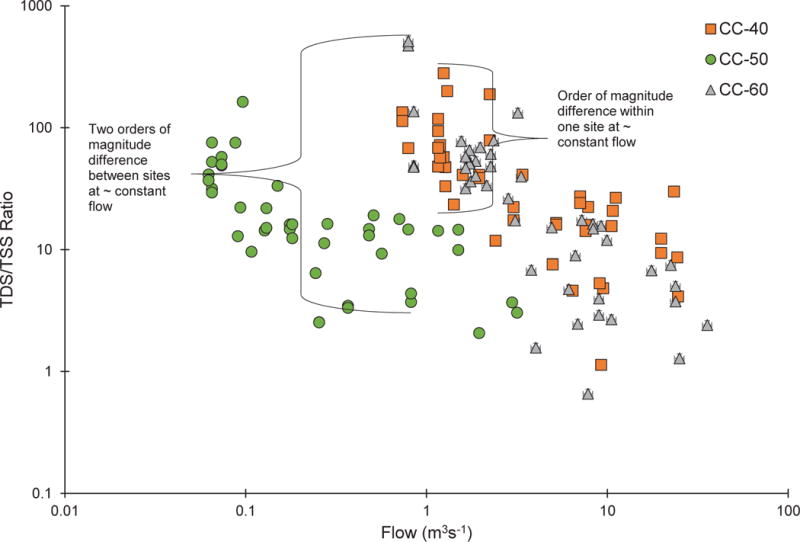
Individual TDS/TSS load ratios vs flow, plotted on log-scale for ease of viewing for CC-40 (orange squares), CC-50 (green circles) and CC-60 (gray triangles). Error bars represent propagated known and estimated measurement errors. The left-hand bracket represents a selection of the data indicating a large range in ratios from all monitoring locations at a constant streamflow, and the right-hand bracket represents a selection of the data from CC-40 indicating a large range in ratios for a single monitoring location
Fig. 4.
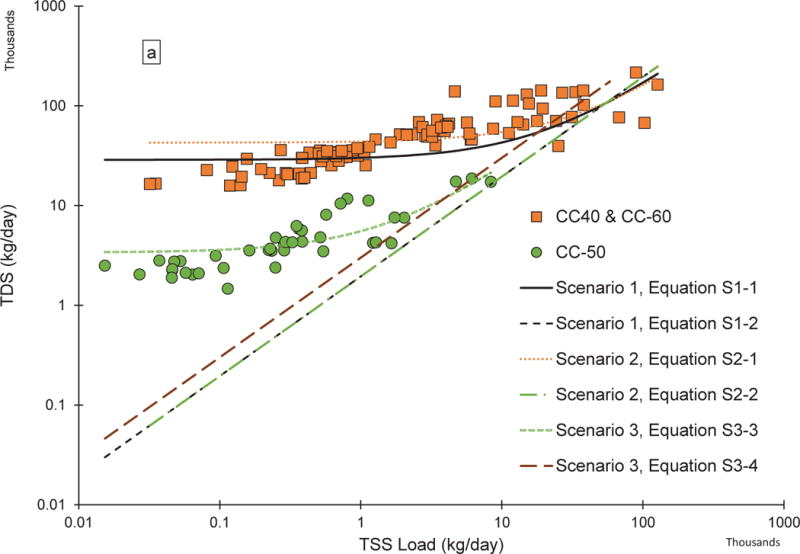
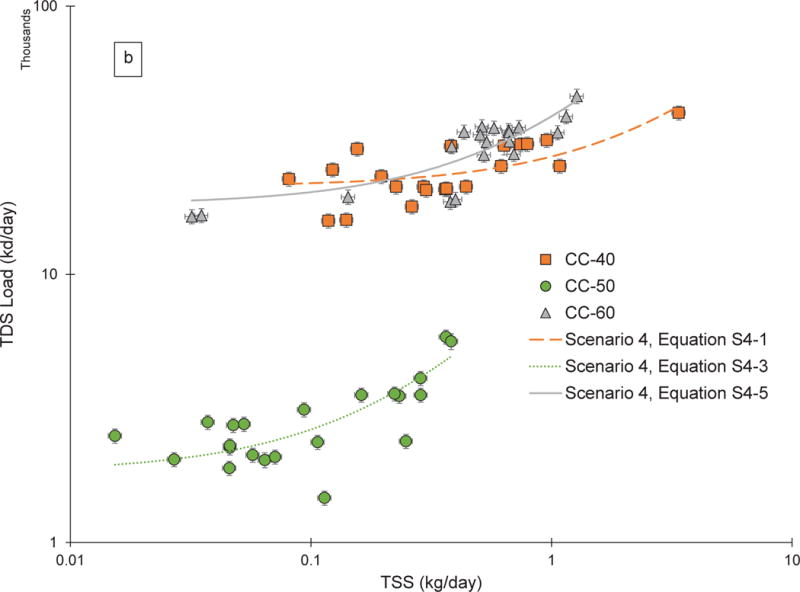
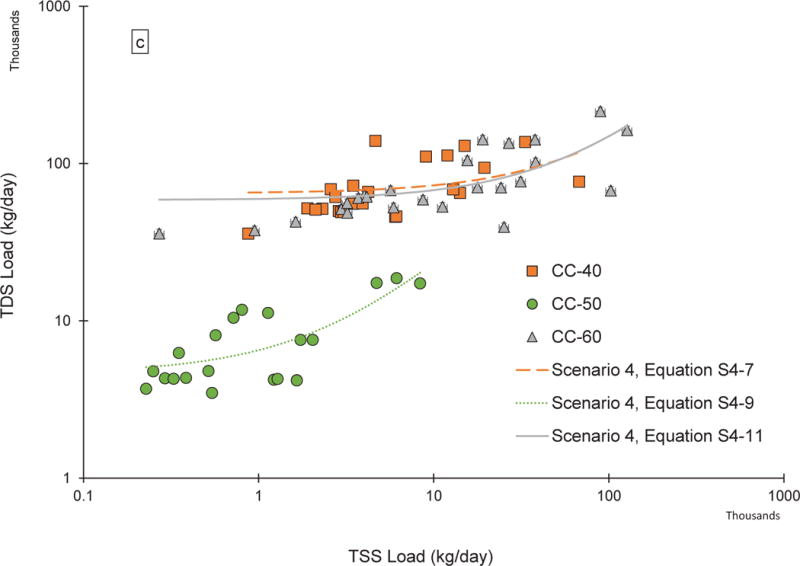
TDS load versus TSS load. (a) Scenarios 1, 2, and 3 (CC-50 only). Green circles represent CC-50 (Scenario 3), orange squares represent CC-40 and CC-60 data combined (Scenario 2), and both sets of symbols represent CC-60, CC-50, and CC-40 data combined (Scenario 1). (b) Each monitoring location using data collected under low-flow conditions (Scenario 4), orange squares represent CC-40, green circles represent CC-50, and gray triangles represent CC-60. (c) Each location using data collected under high-flow conditions (Scenario 4), orange squares represent CC-40, green circles represent CC-50, and gray triangles represent CC-60. Error bars in all plots represent propagated known and estimated measurement errors
Evaluating Linear Relationships
Comparisons between observed and estimated TDS loads for the UCCWA data covering the matching period (2003-2004), prior period (1995-1997), and post period (2007-2009), using unconstrained linear relationships developed under Scenario 3 (equations S3-1, S3-3, and S3-5 from Table 1) and Scenario 4 (equations S4-1, S4-3, S4-5, S4-9, and S4-11 from Table 1), are presented in Figs. 5 and 6, respectively. Results from Equation S4-7 (CC40, high-flow) are not shown because the regressed slope was not statistically different from zero (see TDS-TSS load relationships). Ranges of percent differences between observed and estimated TDS loads for unconstrained relationships are provided in Table 2 (equation ID numbers match regression equations used from Table 1), with individual sampling date results provided as Supplementary Information.
Fig. 5.
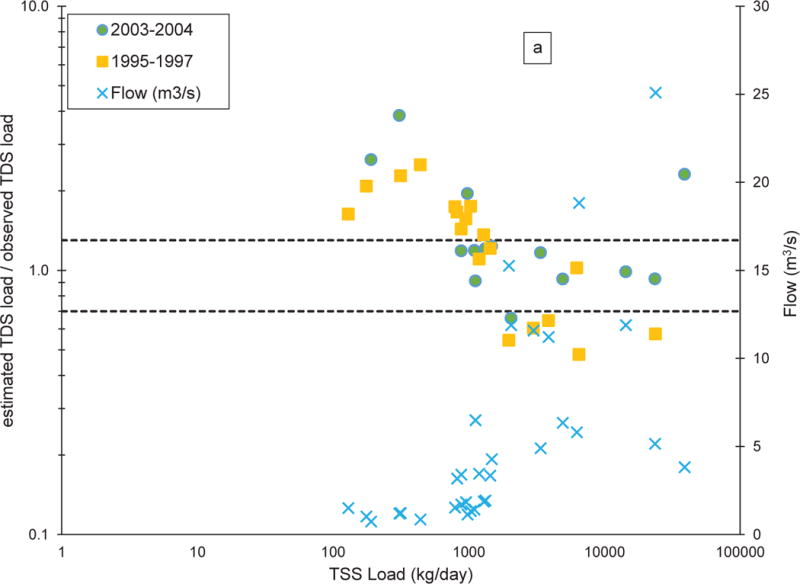
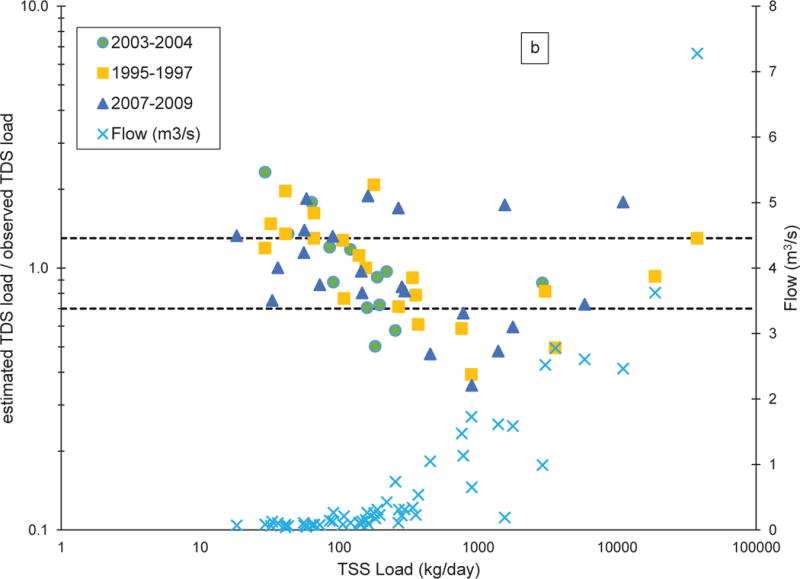
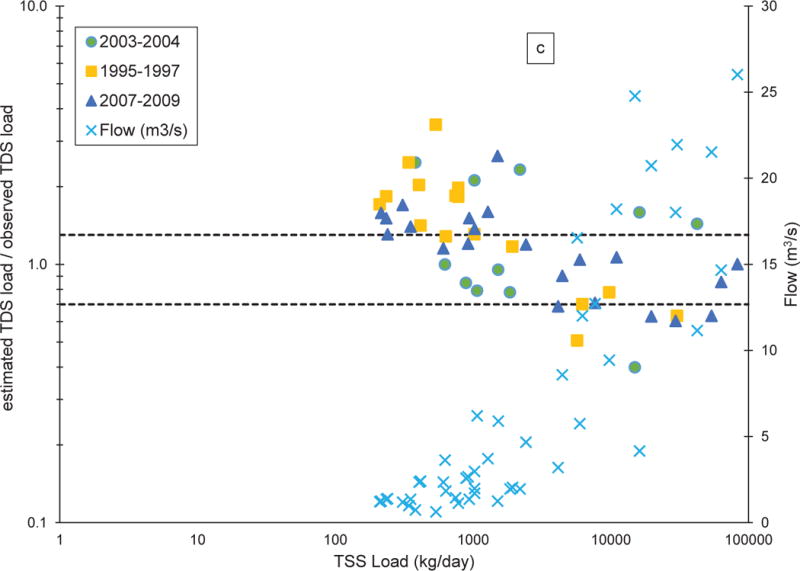
Comparisons between estimated and observed TDS loads for three different periods using unconstrained site-specific relationships for all flows (Scenario 3, equations S3-1, S3-3, and S3-5 for graphs a, b, and c, respectively) as a function of observed TSS loads. CC-40 (a), CC-50 (b), CC-60 (c). Green circles represent data from 2003-2004, yellow squares represent data from 1995-1997, blue triangles represent data from 2007-2009, and light blue X symbols represent streamflow. Dashed horizontal lines above and below the ratio value of 1 represent +/− 30% difference. No streamflow data were available for 2007-2009 for CC-40, so no data are plotted
Fig. 6.
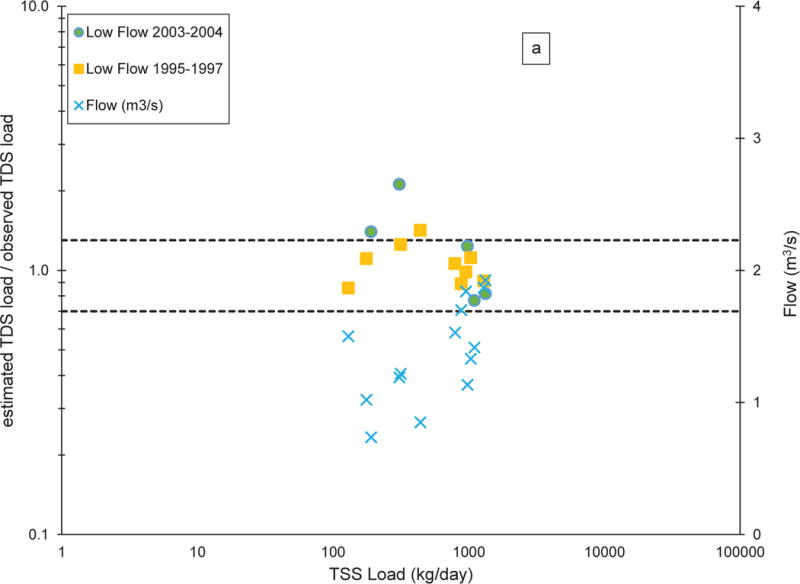
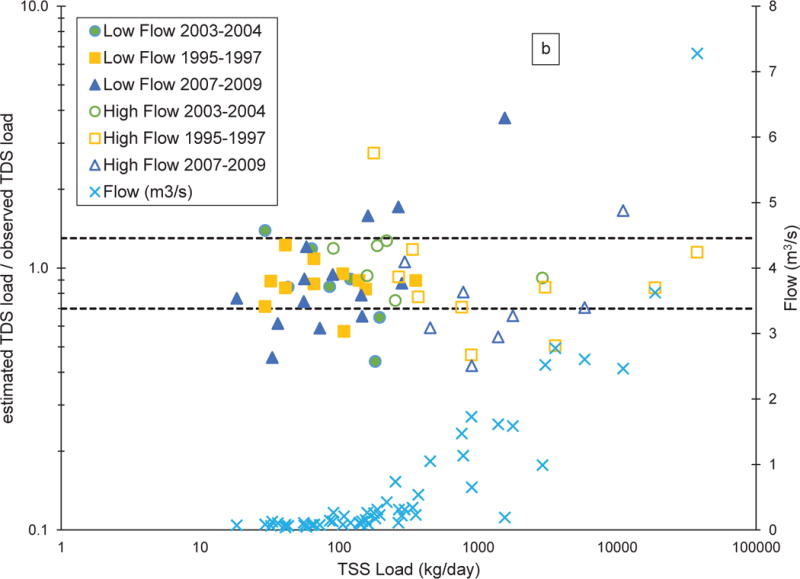
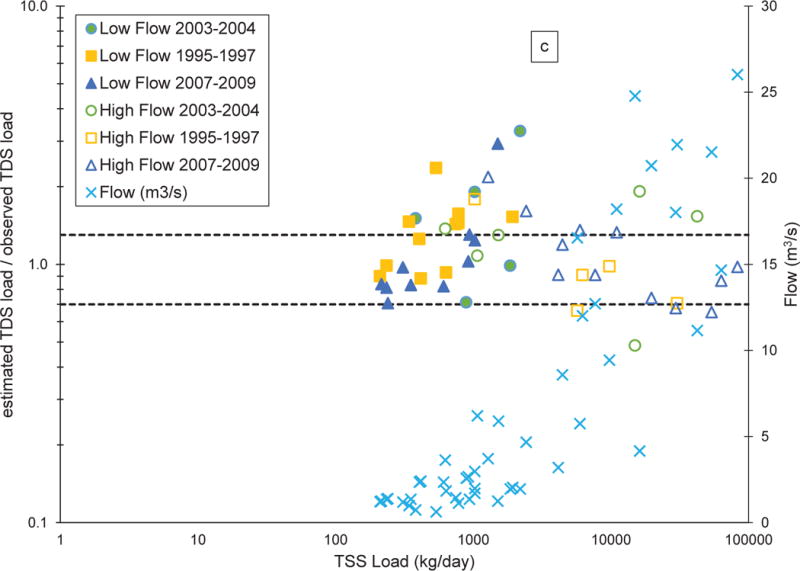
Comparisons between estimated and observed TDS loads for three different periods, using flow-regime and site-specific unconstrained empirical relationships (Scenario 4) as a function of measured TSS loads. CC-40 (a), CC-50 (b), CC-60 (c). Solid symbols represent low-flow conditions (equations S4-1, S4-3, and S4-5, for graphs a, b, and c, respectively) and open symbols represent high-flow conditions (equations S4-9 and S4-11 for graphs b and c, respectively). Green circles represent data from 2003-2004, yellow squares represent data from 1995-1997, blue triangles represent data from 2007-2009, and light blue X symbols represent streamflow. Dashed horizontal lines above and below the ratio value of 1 represent +/− 30% difference. No streamflow data were available for 2007-2009 for CC-40, so no data are plotted
Table 2.
Ranges of percent differences between UCCWA observations and estimated TDS loads using unconstrained linear relationships developed from CSM data
| Equation ID | Site | # Samples < ± 30% Difference | Range in % Difference | ||||
|---|---|---|---|---|---|---|---|
| 2003–2004 | 1995–1997 | 2007–2009 | 2003–2004 | 1995–1997 | 2007–2009 | ||
| S1-1 | CC-40 | 7 (n=14) | 10 (n=18) | n/a | −54 to 166 | −65 to 73 | n/a |
| CC-50 | 0 (n=13) | 2 (n=21) | 0 (n=22) | 198 to 1835 | 17 to 1527 | 68 to 1409 | |
| CC-60 | 0 (n=11) | 8 (n=16) | 15 (n=22) | −66 to 69 | −62 to 137 | −50 to 83 | |
| S2-1 | CC-40 | 9 (n=14) | 3 (n=18) | n/a | −34 to 294 | −53 to 156 | n/a |
| CC-60 | 5 (n=11) | 4 (n=16) | 9 (n=22) | −59 to 149 | −49 to 249 | −38 to 165 | |
| S3-1 | CC-40 | 9 (n=14) | 3 (n=18) | n/a | −34 to 286 | −52 to 151 | n/a |
| S3-3 | CC-50 | 8 (n=13) | 12 (n=21) | 9 (n=22) | −50 to 132 | −61 to 108 | −64 to 89 |
| S3-5 | CC-60 | 5 (n=11) | 4 (n=16) | 9 (n=22) | −60 to 148 | −49 to 247 | −40 to 163 |
| S4-1 | CC-40 | 3 (n=5)) | 8 (n=9) | n/a | −23 to 112 | −14 to 42 | n/a |
| S4-3 | CC-50 | 4 (n=7) | 10 (n=11) | 7 (n=14) | −56 to 39 | −43 to 22 | −54 to 274 |
| S4-5 | CC-60 | 2 (n=5) | 5 (n=11) | 8 (n=10) | −29 to 228 | −12 to 136 | −29 to 193 |
| S4-9 | CC-50 | 6 (n=6) | 7 (n=10) | 3 (n=8) | −25 to 27 | −53 to 174 | −58 to 66 |
| S4-11 | CC-60 | 2 (n=6) | 3 (n=5) | 6 (n=12) | −52 to 91 | −34 to 79 | −35 to 118 |
n/a = No comparisons are shown for CC-40 for 2007-2009 because these dates were outside the period of record for streamflow; thus, loads could not be calculated
Discussion
TDS-TSS Load Relationships
Values of TDS load were greater than TSS load during all sampling events at all sampling sites except at CC-60 on 09/09/03 (Fig. 2). The value of TSS load at CC-40 was also elevated to almost the same level as TDS on 09/09/03 relative to other sampling dates, but the cause of the increased sediment load in the mainstem of Clear Creek is not known. Consistent with our expectations, both TDS and TSS loads increased with increased flows at all of the studied sites. There are two reasons to expect increases in TDS loads at higher flows in a mining-influenced stream: 1) a source having hydrologic connectivity only during high flows (e.g. an adit that accumulates groundwater that is flushed out during spring runoff) and 2) increased transport of colloidal material during high flows that appears to be dissolved, with or without additional transport of truly dissolved ions. In a study of Colorado’s Animas River, a mining-influenced waterbody, Church et al. (1997) observed that there was a higher mass of both dissolved and colloidal material transported during high flow. Kimball et al (2010), in a 2002-2003 study of the Animas River, found that dissolved loads of some ions increased at high flow, while others decreased. In a non-mining influenced waterbody, the Nidda River in the German state of Hesse, Brinkmann (1983) found that TSS and TDS loads were each related to flow rate, with both increasing with high flows from winter and summer storm-related floods. Storm events were not evaluated separately from seasonally-controlled discharge for this study, so it is not known how such events influenced TDS or TSS loads independently. Also evident in Fig. 2 is that loads of TDS and TSS are both greater at CC-60 than at CC-40 on all sampling dates, which was expected due to the input from CC-50 and other tributary inputs between CC-50 and CC-60, which includes the Beaver Brook HUC12 subwatershed drainage area (Fig. 1).
Fig. 3 demonstrates that at the same or similar flows, the sample-specific load ratios were not constant and differed by more than an order of magnitude across all the monitoring locations and by an order of magnitude even within data from a single location; CC-40 is highlighted in Fig. 3 as an example. Additionally, the plot demonstrates no clear trend exists of a single load ratio that is constant for any of the sites over all streamflows. There is a slight trend of decreasing load ratios with increasing flows. Brinkmann (1983) also found that generally, TDS load was dominant under low-flow conditions (higher TDS/TSS load ratio) and TSS load was dominant under high-flow conditions (lower TDS/TSS load ratio).
Although coefficients of determination (R2) often were higher for constrained relationships vs unconstrained relationships (Table 1), Fig. 4a shows that a simple TDS/TSS load ratio model (b = 0) does not fit the data well as a whole (Scenario 1, Equation S1-2), as specific to the mainstem of Clear Creek (Scenario 2, Equation S2-2), or for individual monitoring locations, with CC-50 shown as an example for Scenario 3 (Equation S3-4). Constrained relationships are not plotted in Fig. 4a for the other two sites for Scenario 3 or for any of the sites for Scenario 4 (Figs. 4b and 4c), but parameters are provided in Table 1. The slope of the linear regression equation established for CC-40 under high-flow conditions (equation S4-7) is not statistically different from zero (p = 0.076, Table 1), indicating it is not suitable for predictive use. For all monitoring locations, a positive intercept indicates presence of an inherent TDS load (Table 1 and Fig. 4a-c), which is expected due to groundwater discharge and inherent continual dissolution of streambed rocks and bedded sediment.
A smaller residual sum of squares (RSS) indicates a regression function that more closely matches the measured TDS loads. Comparison of the RSS between constrained and unconstrained relationships within each of the scenarios indicates that the unconstrained regression relationships have a better fit to the data than do the corresponding constrained regression functions (Table 1). For each of the sampling sites, the RSS and the R2 were improved (RSS decreased and R2 increased) when relationships are considered under flow-specific conditions (Scenario 4) as compared to combined site streamflow (Scenario 3), with low streamflow conditions providing the best comparative fit to the data. The lowest RSS value was observed for the constrained regression of the low-flow conditions at CC-50. The better fit to the data is consistent with observations in North Fork Clear Creek of metal oxyhydroxide precipitates, predominantly iron, being formed in the water column downstream from mine drainage inputs of TDS, especially at lower flow conditions, with some metal ions adsorbing to the precipitates (Butler et al. 2009). The mean percentage of iron contributing to TSS concentration in the February 2003 – June 2004 samples was higher at CC-50 (19%) than at the other sites, with 3.7% for CC-40 and 2% for CC-60 (Butler et al. 2008), suggesting that a greater proportion of TSS and TDS at CC-50 was derived from a common source.
Accuracy and Reliability of Predictions
Although unconstrained relationships showed varying degrees of goodness of fit (Fig. 4a-c, Table 1), each was tested using the independent UCCWA data (except S4-7). Wide ranges in percentage differences between observed values of TDS load and estimated TDS load values are seen in Table 2, indicating a lack of reliability in prediction. The differences do not show a trend associated with the period of data examined for any of the monitoring locations. Scenario 1 estimated TDS load to within +/− 30% difference from observed values over all periods for 53% (17 of 32 observations) of the CC-40 samples and 47% (23 of 49 observations) of the CC-60 samples (Table 2, S1-1). CC-50 samples were represented poorly by the relationship drawn over all monitoring locations, with only 4% (2 of 56 observations) of samples across the three periods examined having estimates within +/− 30% of the observed TDS loads (Table 2, S1-1). The poorer comparison was expected for the CC-50 (North Fork Clear Creek) monitoring location because TDS and TSS loads at CC-50 were approximately one tenth the loads at the mainstem monitoring locations, primarily due to streamflow differences (Fig. 2); the intercept reflecting TDS load in North Fork Clear Creek is ≈ 12% of the intercept for the combined data relationship (Fig. 4a and Table 2).
Scenario 2 estimated TDS loads at CC-40 and CC-60 poorer than did Scenario 1, with TDS loads of 37% of the total samples examined falling within +/− 30% of observed values for CC-40 (12 of 32 observations) and CC-60 (18 of 49 observations) (Table 2, S2-1). Along with input from CC-50, CC-60 is influenced from an additional drainage area (Beaver Brook HUC12 subwatershed, Fig. 1) that does not influence CC-40. Therefore, combining these monitoring locations for a mainstem Clear Creek scenario resulted in a relationship that did not accurately and reliably represent either location.
Scenario 3 estimated TDS load similarly to Scenario 2 for CC-40 and CC-60, with only 37% of the samples over all dates at each monitoring locations having differences between estimated and observed TDS values falling within +/− 30% (Table 2, S3-1 and S3-3, respectively). The data falling within +/− 30% difference between estimated and observed TDS loads is shown in Fig. 5a c. For CC-50, Scenario 3 (Table 2, S3-3 and Fig. 5b) was accurate to within +/− 30% for 52% (29 of 56 observations) of the samples. Scenario 4 improved comparisons at all monitoring locations, as seen by comparing Figs. 5a-c and 6a-c. The high-flow scenarios (S4-9 and S4-11) estimated TDS load to within +/− 30% 67% of the time for CC-50 (16 of 23 observations) and 48% (11 of 23 observations) of the time for CC-60 (Table 2); CC-40 was not evaluated since the regression relationship (S4-7) had no predictive ability. Over all dates assessed and all scenarios, the site-specific low-flow scenarios (S4-1, S4-3, and S4-5) provided the highest percentages of comparisons falling within +/− 30% difference for all monitoring locations: CC-40, 79% (11 of 14 observations), CC-50, 66% (21 of 32 observations), and CC-60, 58% (15 of 26 observations) (Table 2).
Accurate measurement of TSS concentration is more difficult at higher flows due to the potential for larger (and typically heavier) particles from the bulk sample being missed in the subsample for filtration. While it is possible that the better relationships and comparisons observed in this study for samples collected only under low-flow conditions are due to TSS being more accurately captured at lower flows, no clear trend is evident in Fig. 6 between the difference ratios (estimated/observed) and corresponding TSS load or flow rate values. Although flow-specific conditions for each site, especially low-flow, improved estimates for site-specific TDS-TSS load relationships, differences in estimated and observed TDS loads greater than +/− 30% still occurred for 21%, 33%, and 42% of the CC-40, CC-50, and CC-60 samples at low flow, respectively, and 33% and 52% of the samples at high flow for CC-50 and CC-60, respectively. Therefore, results suggest that one or more factors in addition to flow influenced either or both TDS and TSS load at each monitoring location.
Potential Applicability
Although our results indicate an inconsistent relationship between TDS and TSS over time and space, they do not negate the possibility that decreases in TSS loading could lead to decreases in TDS loading, or vice versa. For stream systems with fewer inputs of TDS and TSS, or in streams where TDS and TSS sources are similar, a more closely-linked TDS/TSS load relationship may be more likely. Results from this study suggest that monitoring location CC-50 presents such a case. For systems in which TDS originates solely, or predominantly, from dissolution reactions of a specific source of TSS, it is anticipated that a BMP designed to decrease TSS concentration from that source would also reduce TDS concentrations. Likewise, the portion of TSS originating from precipitation reactions of a specific constituent of TDS, such as iron, could be expected to be eliminated, if the originally dissolved iron were removed via at-source control or chemical treatment. For a site such as CC-50, for example, one would expect that removal of the iron present in the TDS would result in removal of the iron precipitate portion of the TSS. Additionally, if the iron was removed by precipitation of iron oxyhydroxides, some further decrease in TDS would be expected due to some portion of the remaining dissolved ions being adsorbed by the iron precipitates. In addition, some removal of TDS might be expected from a chemical treatment BMP for TSS (e.g. coagulation/flocculation), with the amount of concurrent, non-specific removal of TDS depending on the composition of the TDS and the reactivity of specific ions with the particular chemical additive.
The present study did not examine TDS or TSS reduction following water treatment or control BMPs. However, in examining the reduction in TDS and TSS from a created soil-water slurry based on the type of physical sediment control device used, Troxel (2013) found that there was no correlation between TSS and TDS removed. Using two types of silt fences and three types of berms, the author observed that TSS removal ranged from 91 to 98%, but that after an initial decrease in TDS within the first ten minutes of monitoring, TDS remained constant (for one treatment) or varied over the 100 minutes of monitoring. Although the author didn’t find a correlation between TDS and TSS removed, some of the treatments tested did remove some amount of measured components of TDS concurrent with TSS removal. For example, the mulch berm was found to remove 95% of the TSS, 56% of the total nitrogen, 89% of the copper, 79.6% of the zinc, and 87.2% of the lead from the slurry (Troxel 2013). The lack of correlation between TDS and TSS removed suggests different removal mechanisms for specific components of each parameter. In examining treatment of stormwater with a swirl reactor, Boving and Neary (2006) found that about 65-85% of the TSS was removed, but that the system did not remove TDS. Ran et al. (2015) note that dams and soil conservation in the Yellow River Basin, China, have decreased TSS flux, but have had much less effect on the TDS flux. Although these studies aren’t examples of treatment or control in mining systems, they highlight that the variety of available BMP designs will add to the uncertainty of relying on TDS/TSS load relationships to evaluate water quality improvements.
Conclusions
This study has shown that a constrained linear relationship between TDS and TSS loads is not constant or proportional over time or space; therefore, a single ratio would not be a reliable predictor of TDS load based on TSS load (or vice versa) for individual points in time or space. Additionally, an unconstrained linear relationship between TDS and TSS loads developed from multiple locations within a watershed may not accurately reflect conditions at all sites within that watershed, especially if different sites were to have significantly different streamflows relative to other sites within the watershed used to develop the relationship. In smaller high-gradient streams having a common predominant source of TDS and TSS, such as seen with CC-50, unconstrained linear relationships between TDS and TSS loads may be more consistent over time than in larger streams with more opportunity for input of TSS or TDS from sources whose behavior might not be captured at monitored locations used to develop the relationships or where a close chemical relationship doesn’t exist between TDS and TSS in a given source. Site-specific, unconstrained linear relationships between TDS and TSS loads may be useful for predicting one from the other, if conditions (e.g. flow, TDS and TSS formation processes) for their use are similar to those for which the relationship was developed. However, the use of such relationships would depend on the magnitude of uncertainty in the predicted variable that can be tolerated. Application of these empirical linear TSS-TDS relationships to predict change in one parameter based on management or treatment of the other would add additional uncertainty related to how the treatment or management practice affected each of the parameters.
Supplementary Material
Acknowledgments
The authors thank Tim Steele (TDS Consulting, Denver, CO) for providing the Upper Clear Creek Watershed Association water quality monitoring data to allow testing of relationships, and Drs. Brian Dyson and William Shuster at U.S. EPA and the anonymous reviewers for their helpful review comments. This manuscript has been administratively reviewed and approved for publishing. Citations of product, company, or trade names do not constitute endorsement by the U.S. Environmental Protection Agency and are provided only for the purpose of better describing information in this manuscript.
References
- Bilotta GS, Brazier RE. Understanding the influence of suspended solids on water quality and aquatic biota. Water Res. 2008;41:2849–2861. doi: 10.1016/j.watres.2008.03.018. [DOI] [PubMed] [Google Scholar]
- Boving TB, Neary K. Testing the efficiency of a stormwater runoff treatment structure with anthropogenic tracers. Environ Eng Geosci. 2006;12:115–124. [Google Scholar]
- Brinkmann WLF. In: Webb BW, editor. Dissolved and suspended loads of the regulated River Nidda in the Rhine-Main area; Dissolved loads of rivers and surface water quantity/quality relationships; proceedings of a symposium; Hamburg (Germany, F.R.). 15-27 August; International Assoc of Hydrological Sciences; 1983. pp. 347–357. http://hydrologie.org/redbooks/a141/iahs_141_0347.pdf, accessed June 8, 2016. [Google Scholar]
- Butler BA, Ranville JF, Ross PE. Direct versus indirect determination of suspended sediment associated metals in a mining-influenced watershed. Appl Geochem. 2008;23:1218–1231. [Google Scholar]
- Butler BA, Ranville JF, Ross PE. Spatial variations in the fate and transport of metals in a mining-influenced stream, North Fork Clear Creek, Colorado. Sci Total Environ. 2009;407:6223–6234. doi: 10.1016/j.scitotenv.2009.08.040. [DOI] [PubMed] [Google Scholar]
- Byrne P, Wood PJ, Reid I. The impairment of river systems by metal mine contamination: a review including remediation options. Crit Rev Env Sci Tec. 2012;42:2017–2077. [Google Scholar]
- Church SE, Kimball BA, Fey DL, Ferderer DA, Yager TJ, Vaughn RB. (U.S. Geological Survey Open-File Report 97-0151).Source, transport, and partitioning of metals between water, colloids, and bed sediments of the Animas River, Colorado. 1997 https://pubs.usgs.gov/of/1997/ofr-97-0151/, accessed April 25, 2017.
- Einsele G. Sedimentary Basins: Evolution, Facies, and Sediment Budget. Springer; Germany: 1992. [Google Scholar]
- Ferderer DA. (U.S. Geological Survey Open-File Report 96-549).National overview of abandoned mine land sites utilizing the minerals availability system (MAS) and geographic information system (GIS) technology. 1996 https://pubs.usgs.gov/of/1996/0549/report.pdf, accessed May 1, 2017.
- Fritz SJ. A survey of charge-balance errors on published analyses of potable ground and surface waters. Ground Water. 1994;32:539–546. [Google Scholar]
- Gupta SK. Modern Hydrology and Sustainable Water Development. Wiley-Blackwell; UK: 2011. [Google Scholar]
- Hudson-Edwards KA. Sources, mineralogy, chemistry and fate of heavy metal-bearing particles in mining-affected river systems. Mineral Mag. 2003;67:205–217. [Google Scholar]
- Kimball BA, Runkel RL, Walton-Day K. An approach to quantify sources, seasonal change, and biogeochemical processes affecting metal loading in streams: facilitating decisions for remediation of mine drainage. Appl Geochem. 2010;25:728–740. [Google Scholar]
- Milliman JD. Fluvial sediment discharge to the sea and the importance of regional tectonics. In: Ruddiman WF, editor. Tectonic Uplift and Climate Change. Plenum Press; New York: 1997. pp. 239–258. [Google Scholar]
- Milliman JD, Farnsworth KL. A Global Synthesis. Cambridge University Press; New York City: 2011. River Discharge to the Coastal Ocean. [Google Scholar]
- Ran L, Lu XX, Sun H, Han J, Yu R. Chemical denudation in the Yellow River and its geomorphological implications. Geomorphology. 2015;231:83–93. [Google Scholar]
- Rice EW, Baird RB, Eaton AD, Clesceri LS, editors. Standard Methods for the Examination of Water and Wastewater. 22nd. American Public Health Assoc, American Water Works Assoc, Water Environment Federation; Washington, DC: 2012. (Method 2540). [Google Scholar]
- Sauer VB, Meyer RW. Determination of error in individual discharge measurements. USGS; Norcross, Georgia: 1992. (Open-file Report 92-144). http://pubs.usgs.gov/of/1992/ofr92-144/pdf/ofr92-144.pdf, Accessed June 8, 2016. [Google Scholar]
- Society of Environmental Toxicology and Chemistry. Technical issue paper: whole effluent toxicity testing: ion imbalance. SETAC; Pensacola: 2004. https://c.ymcdn.com/sites/www.setac.org/resource/resmgr/publications_and_resources/tipion.pdf, accessed April 24, 2017. [Google Scholar]
- Topping J. Errors of observation and their Treatment. 4th. Chapman and Hall; London: 1972. [Google Scholar]
- Troxel CF. MS Thesis. Georgia Institute of Technology; 2013. Life cycle analysis of sediment control devices. http://hdl.handle.net/1853/49105, accessed May 24, 2016. [Google Scholar]
- Upper Clear Creek Watershed Association. Clear Creek Watershed Plan Update. 2014 https://www.colorado.gov/pacific/sites/default/files/CCWatershedPlan_02-06-14_FINAL.pdf, accessed April 24, 2017.
- USGS (U.S. Geological Society) The National Map, 3DEP products and services: The National Map, 3D Elevation Program Web page. 2016a http://nationalmap.gov/3DEP/3dep_prodserv.html, accessed April 24, 2017.
- USGS. National Water Information System data available on the World Wide Web USGS Water Data for the Nation. 2016b http://waterdata.usgs.gov/nwis/sw, accessed June 8, 2016.
- Weber-Scannell PK, Duffy LK. Effects of total dissolved solids on aquatic organisms: a review of literature and recommendation for Salmonid species. Am J Environ Sci. 2007;3:1–6. [Google Scholar]
- Weiner ER. Applications of Environmental Aquatic Chemistry: A Practical Guide. 3rd. CRC Press; Florida: 2013. [Google Scholar]
Associated Data
This section collects any data citations, data availability statements, or supplementary materials included in this article.


