

Abstract
Purpose
In cancer patients, tumor gene mutations contribute to drug resistance and treatment failure. In patients with metastatic breast cancer (MBC), these mutations increase after multiline treatment, thereby decreasing treatment efficiency. The aim of this study was to evaluate gene mutation patterns in MBC patients to predict drug resistance and disease progression.
Method
A total of 68 MBC patients who had received multiline treatment were recruited. Circulating tumor DNA (ctDNA) mutations were evaluated and compared among hormone receptor (HR)/human epidermal growth factor receptor 2 (HER2) subgroups.
Results
The baseline gene mutation pattern (at the time of recruitment) varied among HR/HER2 subtypes. BRCA1 and MED12 were frequently mutated in triple negative breast cancer (TNBC) patients, PIK3CA and FAT1 mutations were frequent in HR+ patients, and PIK3CA and ERBB2 mutations were frequent in HER2+ patients. Gene mutation patterns also varied in patients who progressed within either 3 months or 3–6 months of chemotherapy treatment. For example, in HR+ patients who progressed within 3 months of treatment, the frequency of TERT mutations significantly increased. Other related mutations included FAT1 and NOTCH4. In HR+ patients who progressed within 3–6 months, PIK3CA, TP53, MLL3, ERBB2, NOTCH2, and ERS1 were the candidate mutations. This suggests that different mechanisms underlie disease progression at different times after treatment initiation. In the COX model, the ctDNA TP53 + PIK3CA gene mutation pattern successfully predicted progression within 6 months.
Conclusion
ctDNA gene mutation profiles differed among HR/HER2 subtypes of MBC patients. By identifying mutations associated with treatment resistance, we hope to improve therapy selection for MBC patients who received multiline treatment.
Keywords: Circulating tumor DNA (ctDNA), Drug resistance, Gene mutation pattern, HR/HER2 subtype, Metastatic breast cancer, Progression-free survival
Abbreviations: ctDNA, circulating tumor DNA; MBC, metastatic breast cancer; HR, hormone receptor; HER2, human epidermal growth factor receptor 2; TNBC, triple negative breast cancer; SEER, Surveillance Epidemiology and End Results; PFS, progression-free survival; ER, estrogen receptor; PR, progesterone receptor; IHC, immunohistochemistry; cfDNA, cell-free DNA; gDNA, genomic DNA; SNV, Single nucleotide variants; Indels, insertions and deletions; TMB, Tumor mutation burden; WES, whole exome sequencing; ROC, receiver operating characteristic; AUC, area under the curve; HR, hazard ratio; CI, confidence interval; GX, gemcitabine+capecitabine; AI, aromatase inhibitor
Highlights
-
•
Doctors felt difficult to design effective regimen for MBC patients after multi-line treatment.
-
•
ctDNA testing provide potential treatment targets and reflect treatment response of tumors.
-
•
ctDNA gene mutation pattern varies among four HR/HER2 subgroups.
-
•
The gene mutation patterns also varied between resistant patients and sensitive patients.
-
•
In COX model, ctDNA gene mutation pattern could successfully predict progression within 6 months.
In this study, we clarified the baseline ctDNA mutation pattern for metastatic breast cancer patients. We also selected out treatment-resistance related mutations by ctDNA testing. Here, we showed that PIK3CA were significantly related to HR+.
Moreover, in this study, we also showed a plenty of other rare mutations, including DDR2, CDK12, etc. For different HR/HER2 subtypes, MED12 was frequent in TNBC samples, FAT1 was frequent in HR+ samples, and DDR2 was frequent in HER2+ samples. These findings need further intensive investigations in larger samples.
1. Introduction
Breast cancer is the most prevalent cancer among females, with a relatively high survival rate. Indeed, the Surveillance Epidemiology and End Results (SEER) dataset (SEER 18, 2006–2012) in the United States indicates that the 5-year survival rate is 89.7%. This survival rate has actually improved in recent decades, in part due to the prevalence of population-based mammography screening and the systematic use of adjuvant therapies [1]. As a result, long-term tumor-bearing survival is now common among advanced breast cancer patients [2]. Importantly, many long-term surviving metastatic breast cancer (MBC) patients receive multi-line chemotherapy. Unfortunately, such treatment reduces the sensitivity of MBC tumor cells to most commonly used drugs. This complicates the process of selecting effective drugs for progressed MBC patients. One way to streamline this drug selection process is by identifying potential drug-sensitive gene mutations in circulating tumor DNA (ctDNA).
ctDNA can be derived from liquid biopsies (minimally-invasive blood from cancer patients). While traditional imaging tools or serum biomarkers (e.g., CEA and CA153) are not timely nor sensitive enough to reflect small changes in tumor mutations, monitoring ctDNA provides valuable and sensitive blood-based biomarkers in advanced cancers. Indeed, ctDNA levels correspond to the tumor burden [3]; thus, ctDNA screening can help monitor the tumor response to treatment [[4], [5], [6], [7]]. ctDNA mutations can also indicate tumor sensitivity to specific chemotherapy drugs [[8], [9], [10], [11], [12]]. For example, PIK3CA and BRCA1 are common mutations in MBC [13,14]. While PIK3CA mutations suggest sensitivity to the mTOR inhibitor Everolimus [15], BRCA1 mutations suggest sensitivity to the PARP inhibitor Olaparib [16]. Thus, screening for ctDNA mutations provides a minimally-invasive tool for doctors to identify effective drug-based therapies in MBC patients.
Conversely, monitoring ctDNA can also aid early detection of genetic events underlying drug resistance and inform potential combination therapy approaches [17]. For example, increased PIK3CA mutations following treatment initiation suggest tumor progression and poor progression-free survival (PFS) [18]. In estrogen receptor (ER)-positive patients, ESR1 mutations following endocrine therapy (except Fulvestrant) indicate treatment resistance [[19], [20], [21], [22], [23]], while in HER2+ patients, mutations in TP53 and PIK3CA are associated with anti-HER2 therapy resistance [24]. According to NCCN guidelines, breast cancer patients are recommended to be diagnosed and treated based on their hormone receptor (HR)/human epidermal growth factor receptor 2 (HER2) status. In general, triple negative (HR-/HER2-), HR-positive and HER2-positive are three main subtypes. However, previous studies did not fully and systematically characterize ctDNA gene mutation patterns in MBC patients related to HR/HER2 status and treatment. Such information is critical for both efficient surveillance of tumor gene mutations and accurate treatment. In this study, we recruited 68 MBC patients to systematically investigate their ctDNA mutation profiles relative to HR/HER2 status. Potential ctDNA markers for monitoring tumor progression, drug resistance, and treatment response were analyzed.
2. Methods
2.1. Patient Cohort and Clinical Data Collection
This study was approved by the Ethics Committee at the Affiliated Cancer Hospital of Xiangya School of Medicine at Central South University. A total of 68 metastatic breast cancer patients were enrolled in this study who were treated from January 2016 to November 2017 at the Department of Breast Oncology in the Affiliated Cancer Hospital of Xiangya School of Medicine. Informed consent was obtained from each patient prior to study onset. According to the American Joint Committee on Cancer staging system, patients diagnosed with stage III/IV primary breast malignant tumors (site: C50.0–C50.9; histology type: invasive ductal carcinomas or lobular carcinomas) were recruited. Other inclusion criteria included: 1) pathologically confirmed triple negative MBC patients, HER2+ positive recurrent or MBC patients, and ER+/progesterone receptor (PR)+recurrent or MBC patients; 2) according to RECIST 1.1 standards, patients had at least one measurable lesion; 3) aged between 18 and 70 years; 4) liver, renal, and blood tests showed a neutrophil count > 2.0 g/l, Hb > 9 g/l, platelet count > 100 g/l, AST and ALT >0.5 ULN, TBIL <1.5 ULN, and Cr < 1.0 ULN. The exclusion criteria included: 1) multiple primary cancers; 2) patients with immunodeficiency or organ transplantation history; 3) patients with heart disease or heart abnormalities such as cardiac infarction and severe cardiac arrhythmia (Fig. S1). Basic demographic and clinical information including age, pathology, laterality, stage, metastatic sites, HR/HER status, imaging records, and treatment history were collected [25].
2.2. Receptor Status Evaluation
ER and PR status were evaluated by immunohistochemistry (IHC) based on the American Society of Clinical Oncology guidelines [26,27]. The steps for IHC evaluation were as follows: 1) calculate the percent of ER/PR positively stained invasive tumor cells; 2) record the intensity of staining; 3) interpret that a minimum of 1% of invasive tumor cells staining positive for ER/PR in a specimen is HR+, while specimens exhibiting <1% of tumor cells staining for ER or PR of any intensity is HR-. For HER2 status, HER2+ was defined as a tumor area >10% with contiguous and homogeneous tumor cells indicated as HER2+ via gene amplification or IHC (HER2 copy number or HER2:CEP17 quantified by fluorescent in situ hybridization based on counting at least 20 cells within the area). The latest record of HR/HER2 status from recurrence biopsies was applied in this study.
2.3. Blood Sample Collection and DNA Extraction
Peripheral blood samples were collected 7 days before treatment, at 2–3 cycles of treatment when the first evaluation was performed, and at disease progression (image evaluation based on RECIST 1.1 standards). Peripheral blood samples were collected in Streck tubes (Streck, Omaha, NE, USA) and centrifuged within 72 h to separate the plasma from peripheral blood cells. Cell-free DNA (cfDNA) was extracted from plasma usinga QIAamp Circulating Nucleic Acid Kit (Qiagen, Hilden, Germany). Genomic DNA (gDNA) was extracted from peripheral blood cells using a QIAamp DNA Blood Mini Kit (Qiagen, Hilden, Germany). Both DNA extractions were performed according to the manufacturer's instructions. gDNA was sequenced as the normal control sample. Volumes of blood collected and of circulating-free DNA extracted (concentrations and total amounts) for all patients are listed in Table S1.
2.4. Target Capture and Next-Generation Sequencing
Both cfDNA and gDNA libraries were constructed with the KAPA DNA Library Preparation Kit (Kapa Biosystems, Wilmington, MA, USA) using the manufacturer's protocol. Capture probes were designed to cover coding sequences and hot exons of 1021 genes that are frequently mutated in solid tumors. A detailed description of the capture experiments has been reported previously [28]. Libraries were hybridized to custom-designed biotinylated oligonucleotide probes (Integrated DNA Technologies, Iowa, IA, USA). DNA sequencing was performed using the HiSeq 3000 Sequencing System (Illumina, San Diego, CA) with 2 × 101-bp paired-end reads. In Table S2, all genes included in our panel are listed. Clonal hematopoietic mutations were filtered as previously described [29], including those in DNMT3A, IDH1, and IDH2 and specific alterations within ATM, GNAS, and JAK2.
2.5. Sequencing Data Analysis
From raw data, terminal adaptor sequences and low-quality reads were removed. The BWA (version 0.7.12-r1039) tool aligned clean reads to the reference human genome (hg19), and Picard (version 1.98) marked PCR duplicates. Realignment and recalibration was performed using GATK (version 3.4–46-gbc02625). Single nucleotide variants (SNV) were called using MuTect (version 1.1.4) and NChot, a software developed in-house to review hotspot variants [28]. Small insertions and deletions (Indels) were called using GATK. Somatic copy number alterations were identified with CONTRA (v2.0.8). Significant copy number variation was expressed as the ratio of adjusted depth between ctDNA and control gDNA. The final candidate variants were all manually verified in the Integrative Genomics Viewer. Sequencing stats of all samples are shown in Table S1. This sequencing method was previously proven credible with simulated cfDNA [28], so we did not validate the mutations found in ctDNA by sequencing tumor biopsies.
2.6. Tumor Mutation Burden (TMB) Calculation
Previously published whole exome sequencing (WES) data demonstrated that mutation burden is a prognostic factor [30]. Usually, TMB is calculated from very large datasets (e.g. whole exome), but Chalmers et al. showed that gene panels can accurately assess TMB compared with WES [31]. In our analysis, we also found that the TMB of our pan-cancer panel significantly correlated with that of WES data from The Cancer Genome Atlas and paired sequencing data from Geneplus (data not shown).
TMB analysis interrogated SNVs and small indels with the variant allele frequency ≥ 3%. TMB-high patients were identified with ≥11 mutations/MB (upper quartile of all data). All others were identified as TMB-low patients.
2.7. Image Evaluation and Definition of Drug Resistance
Image evaluation was performed every 2–3 treatment cycles according to RECIST 1.1 standards. Intargeted therapy-based treatment trials of MBC patients, PFS closely correlates with overall survival [32,33]. In this study, PFS was applied to evaluate the drug treatment response. Drug resistance was defined as disease progression within three months of treatment (at the first evaluation, PFS < 3 months).
2.8. Statistical Analyses
Numerical variables were summarized as the mean (standard deviation) and median (interquartile range). Categorical variables were reported as counts (percentage). An analysis of variance was used to compare continuous variables with symmetrical distributions across subgroups. Chi-square tests or Fisher's exact tests (n < 5) were used to compare categorical variables among HR/HER2 subtypes. Cox regression analysis was used to evaluate the univariate and multivariate risk of candidate gene mutations in progression. Kaplan-Meier (KM) curves were used to plot survival distributions against progression, and the log-rank test was used to assess differences in PFS among subgroups. To identify putative ctDNA mutation profiles in HR/HER2 subtypes, a logistic regression model was performed. A receiver operating characteristic (ROC) curve was calculated to determine prediction efficiency. All tests of hypotheses were two-tailed and conducted at a significance level of 0.05. Statistical analyses were conducted using SAS 9.4.
3. Results
3.1. Demographic and Clinical Features of Patients
In this study, 68 MBC patients were included and the demographic and clinical features of these patients were analyzed. As shown in Table S3, the average diagnostic age was 44.1 yrs. All patients except one were female. The majority of patients had invasive carcinoma, and all patients were in stage III/IV. Of the 68 included patients, 23 were metastatic triple negative breast cancer (TNBC), 25 were ER/PR+ (HR+/HER2-), and 20 were HER2+ (6 HR-/HER2+ and 14 HR+/HER2+). There were no differences in histology, laterality, or surgical treatment between the three subtypes. Most patients (91.18%) received primary tumor surgery, and all received at least 2nd line chemotherapy. All HR+ and HR+/HER2+ patients had received endocrine therapy, while all HER2+ patients had received anti-HER2 treatment, except one who could not afford the drug. As described in the designed schematic (Fig. S1), recruited patients received ctDNA testing analysis.
3.2. Mutation Profiling of MBC Patients Using ctDNA Sequencing
To determine the tumor gene mutation profiles for each HR/HER2 subtype, patients' blood samples were collected and ctDNA was extracted for sequencing. We captured 1021 hot-mutated genes for next-generation sequencing, and mutations were detected by aligning to a reference human genome (hg19). Among the 68 patients, 62 (87%) were mutation-positive before treatment. Specifically, 22 (100%) TNBC, 18 (85.71%) HER2+, and 22(88%) ER/PR+ patients were ctDNA mutation-positive at baseline (Fig. 1). As shown in Fig. 1 and Table S4, the top four most commonly mutated somatic genes were TP53, PIK3CA, ERBB2, and CDK12, with mutation frequencies of 38.24% (26 pts), 33.82% (23 pts), 14.71% (10 pts), and 10.29% (7 pts), respectively. For missense mutations, the hotspot locus in TP53 was p.C238F/Y and in PIK3CA was p.H1047L/R (Fig. S2). In addition, 7 (31.82%) TNBC, 1(4%) HR+, and 1 (4.76%) HER2+ sample harbored BRCA1 mutations (Table S4). Among these 9 BRCA1 mutations, five were germline mutations and four were somatic (Table S5).
Fig. 1.

Circulating tumor DNA (ctDNA) gene mutation profiles (top) and patient demographic/clinical data (bottom).
Fig. S2.

Mutation hotspot for TP53 and PIK3CAcirculating tumor DNA (ctDNA) genes in recruited patients (A and C) and in previous publications (B and D).
3.3. ctDNA Gene Mutation Profiles Differ among TNBC, HER2+, and ER/PR+ Patients
Analyzing the ctDNA gene mutation profiles of each subtype revealed that these profiles differed among HR/HER subgroups. Among all HR/HER2 subtypes, TP53 mutations were frequent (Table S4). Specifically, TP53 mutations occurred in 10 (45.45%) TNBC patients, 9 (36.00%) HER2+ patients, and 7 (22.22%) HR+ patients. However, in the TNBC group, PIK3CA and ERBB2mutations were rare, while BRCA1 germline mutations were significantly more frequent than in the HER2+ or HR+ groups (p = 0.009). Alternatively, PIK3CA mutations were significantly more frequent in the HER2+ and HR+ patients than in TNBC (p = 0.020). Likewise, ERBB2 mutations were most frequent in the HER2+ group (p < 0.0001).
Furthermore, in TNBC patients, TP53, BRCA1, and MED12 were all frequently mutated, while in HR+ patients, TP53, PIK3CA, and FAT1 mutations were the most common (Fig. 1, Table S4). Finally, ERBB2, PIK3CA, and TP53 were the most frequently mutated genes in HER2+ patients. Upon dividing HER2+ patients into HER2+/HR+ and HER2+/HR- subgroups, we found that ERBB2 mutations were concentrated in HER2+/HR+ patients, specifically (Table S5C).
3.4. Tumor Mutation Burden (TMB) Did Not Significantly Differ among HR/HER2 Subgroups
We next evaluated how TMB varied among the different HR/HER2 subgroups. With our current sample size and algorithm, TMB did not significantly differ among the HR+, HER2+ and TNBC groups. However, the TNBC and HR+ groups had a moderately higher TMB than the HER2+ group (Fig. 2A). Further dividing the HER2+ group into HR-/HER2+ and HR+/HER2+ subgroups revealed that HR-/HER2+ patients had fewer ctDNA mutations and lower mutation frequencies compared to the other three patient groups (TNBC, ER/PR+, and HR+/HER2+) (Fig. 2B). However, more samples are needed to fully illustrate this difference.
Fig. 2.

Tumor mutation burden (TMB) for different metastatic breast cancer subtypes.
A. TMB comparison among the different HR/HER2 subtypes: ER/PR+, HER2+, and triple negative breast cancer (TNBC). B. Number of mutated circulating tumor DNA (ctDNA) genes and their maximum frequency in each patient among the four HR/HER2 subtypes.
3.5. Increased ctDNA Mutation Frequency in Patients with Drug Resistance
To further address the influence of tumor mutations on treatment response, mutation changes over time were investigated. Among the 68 patients, 41 received 2nd or 3rd ctDNA evaluation (Table S6). At the 2nd evaluation (at about 3 months of drug treatment), 5 TNBC, 6 HR+, and 2 HER2+ patients had increased ctDNA gene mutation frequencies. After 3 months of treatment, 5 HR+ and 1 HER2+ patient had increased ctDNA gene mutation frequencies. Another 22 patients exhibited decreased ctDNA gene mutation frequencies within 180 days and were characterized as drug sensitive (Table S6A).
We then compared the results of ctDNA gene mutation frequencies to IHC analysis of disease progression. In general, the results of these two outcomes correlated (kappa = 0.8010). According to Recist 1.1 standards, of the 41 patients that received 2nd or 3rd ctDNA evaluation, 15 patients had IHC-observable disease progression. However, four patients had increasing ctDNA mutation frequencies but did not show progression by image analysis, indicating that ctDNA testing can detect changes earlier than imaging (Table S6B). Fig. S3 shows the images for these four patients at the time of ctDNA testing. These metastatic tumors were detected by computed tomography (CT). In Table S6C, the mutated genes and variant allele frequencies for these four patients are specified.
Fig. S3.

Four patients showed increased mutation frequency by ctDNA analysis but did not did not exhibit progression via image analysis. These metastatic tumors were detected by computed tomography (CT). Pink arrows indicated the metastatic target lesions in CT images at the time of circulating tumor DNA (ctDNA) testing. A–D panels represents the image and ctDNA changes for patients #1–#4 listed in Table S6C, respectively.
3.6. ctDNA Mutations Related to Chemotherapy Resistance
We next evaluated the effect of ctDNA mutations on chemotherapy resistance. We used both image analysis and ctDNA testing to evaluate disease progression following treatment initiation. Of the 41 patients who received 2nd or 3rd ctDNA evaluation, all TNBC patients received chemotherapy, except one who received PD-1 antibody, while all HR+ patients received chemotherapy. To identify candidate gene mutations associated with chemo-resistance, we ranked the ctDNA mutations that increased in resistant patients with PFS < 3 months (Fig. 3A) and with PFS >3 months (Fig. 3B). In patients with PFS < 3 months, TERT and FAT1 mutation clones were frequently detected in HR+ patients (Fig. 3C). Similarly, in both the TNBC and HR+ subgroups, Notch4 mutations were commonly detected (Fig. 3C). Other chemo-resistance related mutations included SETD2, RARA, and MLL3. For chemo-resistance after 3 months (PFS > 3 months), PIK3CA, TP53, NOTCH2, MLL3, and SETD2 mutations were all frequently detected (Fig. 3D). Thus, these ctDNA mutations were likely related to chemo-resistance and disease progression.
Fig. 3.

Ranking circulating tumor DNA (ctDNA) gene mutations increased in triple negative breast cancer (TNBC), HR+, and HER2+ patients with progression.
A. ctDNA gene mutations increased in patients who had progression within 3 months of treatment. B. ctDNA gene mutations increased in patients who had progression within 3–6 months. C. Ranking of ctDNA mutations increased in patients who had progression within 3 months. D. Ranking of ctDNA gene mutations increased in patients who had progression within 3–6 months.
3.7. ctDNA Mutations Related to Anti-HER2 Treatment Resistance
We also evaluated the effect of ctDNA mutations on anti-HER2 treatment. All evaluated HER2+ patients received anti-HER2 treatment, except one with GX (gemcitabine+capetabine) chemotherapy. For HER2+ patients who received anti-HER2 treatment, two had anti-HER2 treatment resistance within 3 months (Fig. 3A). Within this time, PIK3R2 and NOTCH4 mutations were elevated (Fig. 3C). For patients who had anti-HER2 treatment resistance after 3 months of treatment, TP53, PIK3CA, and ERBB2 mutations increased (Fig. 3B and D).
3.8. Effects of ctDNA Mutations on PFS
Thus, of the most commonly mutated genes in MBC patients (TP53, PIK3CA, ERBB2, and BRCA1/2), some were related to treatment resistance. We next wanted to quantify the efficiency of these mutations in predicting disease progression. To do this, ROC curves were drawn, and sensitivity/specificity were calculated for different mutation patterns. The area under the curve (AUC) of theTP53 + PIK3CA mutation pattern, the TP53 + PIK3CA + ERBB2 pattern, and the top five mutation combination (TP53 + PIK3CA + ERBB2 + BRCA1 + CDK12) pattern were 0.7890, 0.8402 and 0.8502, respectively (Fig. 4). Of these, the TP53 + PIK3CA mutation pattern had the lowest AUC value, with optimal sensitivity and specificity among the three models (Table S7).
Fig. 4.
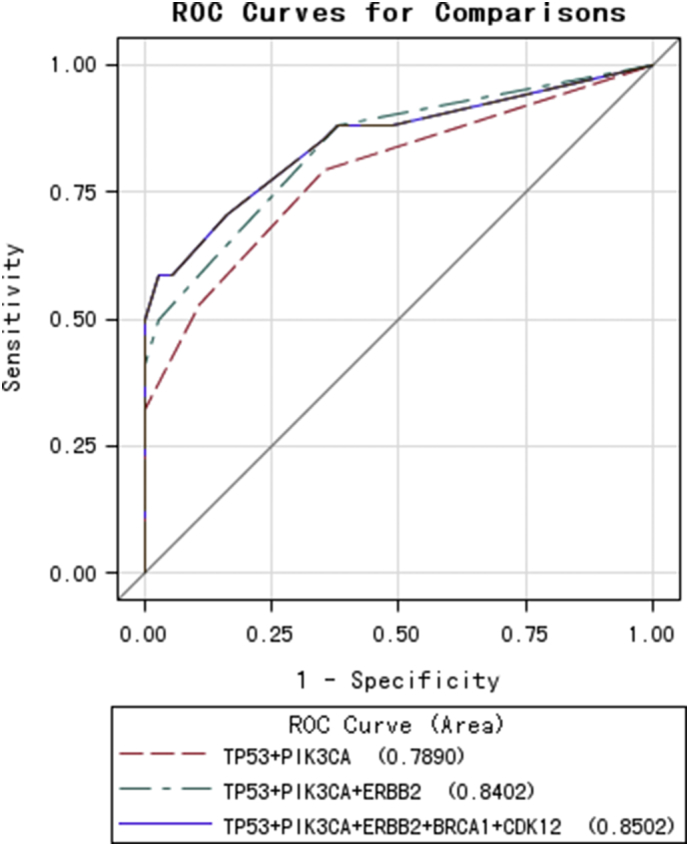
Receiver operating characteristics (ROC) curves for four joint models of TP53, PIK3CA, ERBB2, BRCA1, and CDK12 mutations in predicting progression-free survival.
To evaluate the effect of ctDNA mutations on PFS, lifetest and univariate Cox proportional hazards analyses were performed. Interestingly, survival analysis with KM curves revealed that baseline TP53 and PIK3CA mutations were risk factors for PFS (Fig. 5A&B, Log-rank p = 0.0059 for TP53 and p = 0.0278 for PIK3CA). When the TP53 and PIK3CA mutations were combined, theTP53-/PIK3CA- group (no TP53 nor PIK3CA mutations) showed marginally better PFS compared to the TP53+/PIK3CA+, TP53-/PIK3CA+, and TP+/PIK3CA- groups (TP53 or PIK3CA mutations; p = 0.0116, Fig. 5C). Thus, TP53 and PIK3CA ctDNA mutations likely limit survival and promote disease progression.
Fig. 5.

Kaplan-Meier curves for progression-free survival probabilities stratified by circulating tumor DNA (ctDNA) mutations, TP53 (A), PIK3CA (B),TP53/PIK3CA (C), ERBB2 (D),BCRA1 (E), and CDK12 (F).
Baseline ERBB2 mutations were also a risk factor for PFS (Fig. 5D, p = 0.0450). Univariate Cox regression analysis further confirmed the effect of TP53 (hazard ratio [HR] (95% confidence interval [CI]) = 2.576(1.283, 5.175), p = 0.008), PIK3CA (HR (95% CI) = 2.167 (1.073, 4.379), p = 0.03), and ERBB2 mutations (HR (95% CI) = 2.162 (1.000, 4.676), p = 0.05, Table S8) on PFS. Due to our relatively small sample size, baseline BRCA1 and CDK12 mutations did not significantly affect PFS (Fig. 5E–F). To eliminate potential confounding variables, a multivariate Cox regression analysis was performed. The results of this model suggested that TP53 and ERBB2 mutations were significant risk factors for disease progression (Table S8).
4. Discussion
In this study, we identified many ctDNA mutations in MBC patients that were associated with resistance to chemotherapy or anti-HER2 treatment. This is important because according to National Comprehensive Cancer Network guidelines, the main treatment strategies for inoperable metastatic or recurrent breast cancer are chemotherapy combined with endocrine and/or targeted therapy. Treatment strategies depend upon a patient's HR/HER2 status, which is delineated by biopsy results. Specifically, ER+ and/or PR+ patients are appropriate candidates for endocrine therapy, including nonsteroidal aromatase inhibitors (anastrozole and letrozole), steroidal aromatase inhibitors (exemestane), serum ER modulators (tamoxifen and toremifene), and ER down-regulators (fulvestrant). Aromatase inhibitors (AI) are superior to serum ER modulators [34]; however, many AI-treated patients relapse due to ESR1 mutations [35] and acquired CYP19A1 (encoding aromatase) amplification [36]. Alternatively, for HER2 + MBC patients, anti-HER2 target therapy is the first choice.
In this study, among the patients who received ctDNA evaluation at 3 months after treatment, all HR+ (HER2-) patients received chemotherapy alone, except one who received chemotherapy (Capetabine + Vinorelbine) + Letrozole. All HER2+ patients received chemotherapy plus anti-HER2 treatment, except one who received chemotherapy (GX) only. Only limited patients received endocrine therapy; therefore, in this study, we could not evaluate genes that conferred resistance to endocrine therapy. Instead, we evaluated genes associated chemotherapy resistance in HR+ (HER2-) patients, and anti-HER2 treatment resistance in HER2+ patients. Of the HR+ patients, those who had PFS < 3 months exhibited increased mutation frequencies in TERT, FAT1, RARA, and ERBB4, those who had progression with PFS > 3 months had increased mutations in PIK3CA, TP53, NOTCH2, and MLL3 (Fig. 3). This suggests a distinct pattern or mechanism for drug resistance between HR+ patients with PFS < 3 months and PFS > 3 months.
In this study, two HER2+ patients had anti-HER2 treatment resistance with PFS < 3 months. Following anti-HER2 treatment, ctDNA mutation frequencies increased for PIK3R2 and NOTCH4 (Fig. 3C). ForHER2 + patients who had anti-HER2 treatment resistance with PFS > 3 months, TP53, PIK3CA, and ERBB2 mutations increased (Fig. 3D). Previously, reactivation of HER2 (ERBB2) mutations have been related to acquired resistance to Lapatinib-containing HER2-targeted therapy [37]. DNMT3A mutations or activation is also associated with resistance to docetaxel in breast cancer [38].
In this study, all progressed TNBC patients had PFS <3 months. In these patients, TP53, TERT, PIK3CA, NOTCH1/4 were commonly mutated. Previously, TERT SNPs rs10069690 and rs2242652 have been associated with ER and BRCA1-mutated breast cancer without altering telomere length [39]. TERT-CLPTM1L locus mutations are also significantly associated with TNBC, particularly in younger women [40]. In this study, TERT was not a baseline ctDNA mutation candidate (Fig. 1). However, its increase was common in patients with chemo-resistance, especially for HR+ and TNBC patients. Thus, the mechanisms underlying the effects of TERT mutations on treatment resistance require further investigation.
Ultimately, we clarified the baseline ctDNA mutation patterns for MBC patients based on HR/HER2 status. We also identified treatment resistance related ctDNA mutations. However, our study was limited by a relatively small sample size. About 20 patients in each subgroup likely created noise in the baseline mutation frequency calculation. In addition, patients in the same subgroup received different treatment regimens. For example, some HER2+ patients were treated with Herceptin while others were treated with Herceptin + Lapatinib. Future studies should include a larger sample size to compare ctDNA mutation profiles within subgroups based on different treatment regimens. Future studies should also investigate the mechanisms underlying the effects of these ctDNA mutations on treatment resistance.
The following are the supplementary data related to this article.
Schematic of study flow. cfDNA, cell-free DNA; ctDNA, circulating tumor DNA; gDNA, genomic DNA; HER2, human epidermal growth factor receptor 2; HR, hormone receptor; MBC, metastatic breast cancer; TNBC, triple negative breast cancer.
Volumes of blood collected, cell-free DNA extracted (concentrations and total amounts), and sequencing statistics for all patients.
Genes included in the panel.
Demographics and clinical features of patients.
Note: #p-values were calculated using Student'st-tests for continuous variables and using Chi-square tests or Fisher's exact tests (n < 5) for categorical variables.
Baseline frequent circulating tumor DNA (ctDNA) gene mutations among HR/HER2 subtypes.
Note: *p-values were calculated by using Mentel-Haenszel Chi-square (n > 5) or Fisher's exact tests (n < 5) for categorical variables comparingacrossthe three subtypes.
Baseline circulating tumor DNA (ctDNA) gene mutations in all patients. Gene mutations identified in triple negative breast cancer (TNBC) (A), HR+ (B), HR-/HER2+ (C) and HR+/HER2+ (D) patients were listed. Frequent mutations were highlighted with colors.
Record for patients with tumor progression.
Note: # Rapid resistance indicated progression with progression-free survival (PFS) <3 months, and † late resistance indicated tumor progression after 3 months (PFS > 3 months).
A. Note *timeliness = kappa (%) + the percentage of patients withcirculating tumor DNA (ctDNA) increases but image showed no progression (ctDNA earlier than image) (%) = 100% B. Note: ctDNA gene mutations were specified for four patients (#1–#4) with increased mutation frequency while images did not exhibit progression.
Predictive efficiency of circulating tumor DNA (ctDNA) mutation model.
Note: Receiver operating characteristics (ROC) comparison among proposed joint models indicate that even TP53 + PIK3CA mutation pattern had lowest area under the curve(AUC); its sensitivity and specificity was optimal among the three models.
Circulating tumor DNA (ctDNA) gene mutations that are risk factors for progression.
Note: *Univariate and **multivariate Cox regression models were performed to evaluate the risk of individual ctDNA gene mutations for progression.
Author Contributions
Dr. Quchang Ouyang had full access to all data in the study and takes responsibility for the integrity and accuracy of the data analysis.
Study concept and design: Quchang Ouyang and Zheyu Hu.
Data acquisition, analysis, or interpretation: Zheyu Hu, Ning Xie, Xiaohong Yang, Liping Liu, Jing Li and Huawu Xiao.
Drafting of the manuscript: Quchang Ouyang, Zheyu Hu, and Lianpeng Chang.
Critical revision of the manuscript for important intellectual content: All authors.
Reference
- 1.Byers T., Wender R.C., Jemal A., Baskies A.M., Ward E.E., Brawley O.W. The American Cancer Society challenge goal to reduce US cancer mortality by 50% between 1990 and 2015: Results and reflections. CA Cancer J Clin. 2016 Sep.;66(5):359–369. doi: 10.3322/caac.21348. [DOI] [PubMed] [Google Scholar]
- 2.Eikesdal H.P., Knappskog S., Aas T., Lonning P.E. TP53 status predicts long-term survival in locally advanced breast cancer after primary chemotherapy. Acta Oncol. 2014 Oct.;53(10):1347–1355. doi: 10.3109/0284186X.2014.922215. [DOI] [PMC free article] [PubMed] [Google Scholar]
- 3.Yi X., Ma J., Guan Y., Chen R., Yang L., Xia X. The feasibility of using mutation detection in ctDNA to assess tumor dynamics. Int J Cancer. 2017 Jun. 15;140(12):2642–2647. doi: 10.1002/ijc.30620. [DOI] [PMC free article] [PubMed] [Google Scholar]
- 4.Cheng H., Liu C., Jiang J., Luo G., Lu Y., Jin K. Analysis of ctDNA to predict prognosis and monitor treatment responses in metastatic pancreatic cancer patients. Int J Cancer. 2017 May 15;140(10):2344–2350. doi: 10.1002/ijc.30650. [DOI] [PubMed] [Google Scholar]
- 5.Guibert N., Mazieres J., Delaunay M., Casanova A., Farella M., Keller L. Monitoring of KRAS-mutated ctDNA to discriminate pseudo-progression from true progression during anti-PD-1 treatment of lung adenocarcinoma. Oncotarget. 2017 Jun. 06;8(23):38056–38060. doi: 10.18632/oncotarget.16935. [DOI] [PMC free article] [PubMed] [Google Scholar]
- 6.Tie J., Kinde I., Wang Y., Wong H.L., Roebert J., Christie M. Circulating tumor DNA as an early marker of therapeutic response in patients with metastatic colorectal cancer. Ann Oncol. 2015 Aug.;26(8):1715–1722. doi: 10.1093/annonc/mdv177. [DOI] [PMC free article] [PubMed] [Google Scholar]
- 7.Khan K., Rata M., Cunningham D., Koh D.M., Tunariu N., Hahne J.C. Functional imaging and circulating biomarkers of response to regorafenib in treatment-refractory metastatic colorectal cancer patients in a prospective phase II study. Gut. 2017 doi: 10.1136/gutjnl-2017-314178. [Epub ahead of print] [DOI] [PMC free article] [PubMed] [Google Scholar]
- 8.Calapre L., Warburton L., Millward M., Ziman M., Gray E.S. Circulating tumour DNA (ctDNA) as a liquid biopsy for melanoma. Cancer Lett. 2017 Sep. 28;404:62–69. doi: 10.1016/j.canlet.2017.06.030. [DOI] [PubMed] [Google Scholar]
- 9.Kidess-Sigal E., Liu H.E., Triboulet M.M., Che J., Ramani V.C., Visser B.C. Enumeration and targeted analysis of KRAS, BRAF and PIK3CA mutations in CTCs captured by a label-free platform: Comparison to ctDNA and tissue in metastatic colorectal cancer. Oncotarget. 2016 Dec. 20;7(51):85349–85364. doi: 10.18632/oncotarget.13350. [DOI] [PMC free article] [PubMed] [Google Scholar]
- 10.Rosell R., cancer Karachaliou N. Lung. Using ctDNA to track EGFR and KRAS mutations in advanced-stage disease. Nat Rev Clin Oncol. 2016 Jul.;13(7):401–402. doi: 10.1038/nrclinonc.2016.83. [DOI] [PubMed] [Google Scholar]
- 11.Reck M., Hagiwara K., Han B., Tjulandin S., Grohe C., Yokoi T. ctDNA determination of EGFR mutation status in European and Japanese patients with advanced NSCLC: The ASSESS study. J Thorac Oncol. 2016 Oct.;11(10):1682–1689. doi: 10.1016/j.jtho.2016.05.036. [DOI] [PubMed] [Google Scholar]
- 12.Wang V., Bivona T., Ali S.M., Schrock A.B., Miller V.A. CD74-ROS1 fusion in NSCLC detected by hybrid capture-based tissue genomic profiling and ctDNA assays. J Thorac Oncol. 2017 Feb.;12(2) doi: 10.1016/j.jtho.2016.11.2217. [DOI] [PubMed] [Google Scholar]
- 13.Madic J., Kiialainen A., Bidard F.C., Birzele F., Ramey G., Leroy Q. Circulating tumor DNA and circulating tumor cells in metastatic triple negative breast cancer patients. Int J Cancer. 2015 May 01;136(9):2158–2165. doi: 10.1002/ijc.29265. [DOI] [PubMed] [Google Scholar]
- 14.Higgins M.J., Jelovac D., Barnathan E., Blair B., Slater S., Powers P. Detection of tumor PIK3CA status in metastatic breast cancer using peripheral blood. Clin Cancer Res. 2012 Jun. 15;18(12):3462–3469. doi: 10.1158/1078-0432.CCR-11-2696. [DOI] [PMC free article] [PubMed] [Google Scholar]
- 15.Andre F., Hurvitz S., Fasolo A., Tseng L.M., Jerusalem G., Wilks S. Molecular alterations and Everolimus efficacy in human epidermal growth factor receptor 2-overexpressing metastatic breast cancers: Combined exploratory biomarker analysis from BOLERO-1 and BOLERO-3. J Clin Oncol. 2016 Jun. 20;34(18):2115–2124. doi: 10.1200/JCO.2015.63.9161. [DOI] [PubMed] [Google Scholar]
- 16.Robson M., Im S.A., Senkus E., Xu B., Domchek S.M., Masuda N. Olaparib for metastatic breast Cancer in patients with a germline BRCA mutation. N Engl J Med. 2017 Aug. 10;377(6):523–533. doi: 10.1056/NEJMoa1706450. [DOI] [PubMed] [Google Scholar]
- 17.cancer Romero D. Breast. Tracking ctDNA to evaluate relapse risk. Nat Rev Clin Oncol. 2015 Nov.;12(11):624. doi: 10.1038/nrclinonc.2015.159. [DOI] [PubMed] [Google Scholar]
- 18.Oshiro C., Kagara N., Naoi Y., Shimoda M., Shimomura A., Maruyama N. PIK3CA mutations in serum DNA are predictive of recurrence in primary breast cancer patients. Breast Cancer Res Treat. 2015 Apr.;150(2):299–307. doi: 10.1007/s10549-015-3322-6. [DOI] [PubMed] [Google Scholar]
- 19.Arnedos M., Vicier C., Loi S., Lefebvre C., Michiels S., Bonnefoi H. Precision medicine for metastatic breast cancer—limitations and solutions. Nat Rev Clin Oncol. 2015 Dec.;12(12):693–704. doi: 10.1038/nrclinonc.2015.123. [DOI] [PubMed] [Google Scholar]
- 20.Spoerke J.M., Gendreau S., Walter K., Qiu J., Wilson T.R., Savage H. Heterogeneity and clinical significance of ESR1 mutations in ER-positive metastatic breast cancer patients receiving fulvestrant. Nat Commun. 2016 May 13;7 doi: 10.1038/ncomms11579. [DOI] [PMC free article] [PubMed] [Google Scholar]
- 21.Fribbens C., Garcia Murillas I., Beaney M., Hrebien S., O'Leary B., Kilburn L. Tracking evolution of aromatase inhibitor resistance with circulating tumour DNA analysis in metastatic breast cancer. Ann Oncol. 2018 Jan. 1;29(1):145–153. doi: 10.1093/annonc/mdx483. [DOI] [PMC free article] [PubMed] [Google Scholar]
- 22.Schiavon G., Hrebien S., Garcia-Murillas I., Cutts R.J., Pearson A., Tarazona N. Analysis of ESR1 mutation in circulating tumor DNA demonstrates evolution during therapy for metastatic breast cancer. Sci Transl Med. 2015 Nov. 11;7(313) doi: 10.1126/scitranslmed.aac7551. [DOI] [PMC free article] [PubMed] [Google Scholar]
- 23.Fribbens C., Garcia Murillas I., Beaney M., Hrebien S., O'Leary B., Kilburn L. Tracking evolution of aromatase inhibitor resistance with circulating tumour DNA analysis in metastatic breast cancer. Ann Oncol. 2018;29(1):145–153. doi: 10.1093/annonc/mdx483. [DOI] [PMC free article] [PubMed] [Google Scholar]
- 24.Ma F., Zhu W., Guan Y., Yang L., Xia X., Chen S. ctDNA dynamics: A novel indicator to track resistance in metastatic breast cancer treated with anti-HER2 therapy. Oncotarget. 2016 Oct. 04;7(40):66020–66031. doi: 10.18632/oncotarget.11791. [DOI] [PMC free article] [PubMed] [Google Scholar]
- 25.McMullin R.P., Wittner B.S., Yang C., Denton-Schneider B.R., Hicks D., Singavarapu R. A BRCA1 deficient-like signature is enriched in breast cancer brain metastases and predicts DNA damage-induced poly (ADP-ribose) polymerase inhibitor sensitivity. Breast Cancer Res. 2014 Mar. 14;16(2):R25. doi: 10.1186/bcr3625. [DOI] [PMC free article] [PubMed] [Google Scholar]
- 26.Hammond M.E., Hayes D.F., Dowsett M., Allred D.C., Hagerty K.L., Badve S. American society of clinical oncology/college of American pathologists guideline recommendations for immunohistochemical testing of estrogen and progesterone receptors in breast cancer. J Clin Oncol. 2010 Jun. 1;28(16):2784–2795. doi: 10.1200/JCO.2009.25.6529. [DOI] [PMC free article] [PubMed] [Google Scholar]
- 27.Wolff A.C., Hammond M.E., Hicks D.G., Dowsett M., McShane L.M., Allison K.H. Recommendations for human epidermal growth factor receptor 2 testing in breast cancer: American society of clinical oncology/college of American pathologists clinical practice guideline update. J Clin Oncol. 2013 Nov. 1;31(31):3997–4013. doi: 10.1200/JCO.2013.50.9984. [DOI] [PubMed] [Google Scholar]
- 28.Yang X., Chu Y., Zhang R., Han Y., Zhang L., Fu Y. Technical validation of a next-generation sequencing assay for detecting clinically relevant levels of breast Cancer-related single-nucleotide variants and copy number variants using simulated cell-free DNA. J Mol Diagn. 2017 Jul.;19(4):525–536. doi: 10.1016/j.jmoldx.2017.04.007. [DOI] [PubMed] [Google Scholar]
- 29.Phallen J., Sausen M., Adleff V., Leal A., Hruban C., White J. Direct detection of early-stage cancers using circulating tumor DNA. Sci Transl Med. 2017 Aug. 16;9(403) doi: 10.1126/scitranslmed.aan2415. [DOI] [PMC free article] [PubMed] [Google Scholar]
- 30.Rizvi N.A., Hellmann M.D., Snyder A., Kvistborg P., Makarov V., Havel J.J. Cancer immunology. Mutational landscape determines sensitivity to PD-1 blockade in non-small cell lung cancer. Science. 2015 Apr. 3;348(6230):124–128. doi: 10.1126/science.aaa1348. [DOI] [PMC free article] [PubMed] [Google Scholar]
- 31.Chalmers Z.R., Connelly C.F., Fabrizio D., Gay L., Ali S.M., Ennis R. Analysis of 100,000 human cancer genomes reveals the landscape of tumor mutational burden. Genome Med. 2017 Apr. 19;9(1):34. doi: 10.1186/s13073-017-0424-2. [DOI] [PMC free article] [PubMed] [Google Scholar]
- 32.Saad E.D., Katz A. Progression-free survival and time to progression as primary end points in advanced breast cancer: Often used, sometimes loosely defined. Ann Oncol. 2009 Mar.;20(3):460–464. doi: 10.1093/annonc/mdn670. [DOI] [PubMed] [Google Scholar]
- 33.Li L., Pan Z. Progression-free survival and time to progression as real surrogate end points for overall survival in advanced breast Cancer: A meta-analysis of 37 trials. Clin Breast Cancer. 2018;18(1):63–70. doi: 10.1016/j.clbc.2017.07.015. [DOI] [PubMed] [Google Scholar]
- 34.Bonneterre J., Thurlimann B., Robertson J.F., Krzakowski M., Mauriac L., Koralewski P. Anastrozole versus tamoxifen as first-line therapy for advanced breast cancer in 668 postmenopausal women: Results of the tamoxifen or arimidex randomized group efficacy and tolerability study. J Clin Oncol. 2000 Nov. 15;18(22):3748–3757. doi: 10.1200/JCO.2000.18.22.3748. [DOI] [PubMed] [Google Scholar]
- 35.Robinson D.R., Wu Y.M., Vats P., Su F., Lonigro R.J., Cao X. Activating ESR1 mutations in hormone-resistant metastatic breast cancer. Nat Genet. 2013 Dec.;45(12):1446–1451. doi: 10.1038/ng.2823. [DOI] [PMC free article] [PubMed] [Google Scholar]
- 36.Magnani L., Frige G., Gadaleta R.M., Corleone G., Fabris S., Kempe M.H. Acquired CYP19A1 amplification is an early specific mechanism of aromatase inhibitor resistance in ERalpha metastatic breast cancer. Nat Genet. 2017 Mar.;49(3):444–450. doi: 10.1038/ng.3773. [DOI] [PMC free article] [PubMed] [Google Scholar]
- 37.Xu X., De Angelis C., Burke K.A., Nardone A., Hu H., Qin L. HER2 reactivation through acquisition of the HER2 L755S mutation as a mechanism of acquired resistance to HER2-targeted therapy in HER2(+) breast cancer. Clin Cancer Res. 2017 Sep. 1;23(17):5123–5134. doi: 10.1158/1078-0432.CCR-16-2191. [DOI] [PMC free article] [PubMed] [Google Scholar]
- 38.Kastl L., Brown I., Schofield A.C. Altered DNA methylation is associated with docetaxel resistance in human breast cancer cells. Int J Oncol. 2010 May;36(5):1235–1241. doi: 10.3892/ijo_00000607. [DOI] [PubMed] [Google Scholar]
- 39.Bojesen S.E., Pooley K.A., Johnatty S.E., Beesley J., Michailidou K., Tyrer J.P. Multiple independent variants at the TERT locus are associated with telomere length and risks of breast and ovarian cancer. Nat Genet. 2013 Apr.;45(4):371–384. doi: 10.1038/ng.2566. (84e1-2) [DOI] [PMC free article] [PubMed] [Google Scholar]
- 40.Haiman C.A., Chen G.K., Vachon C.M., Canzian F., Dunning A., Millikan R.C. A common variant at the TERT-CLPTM1L locus is associated with estrogen receptor-negative breast cancer. Nat Genet. 2011 Oct. 30;43(12):1210–1214. doi: 10.1038/ng.985. [DOI] [PMC free article] [PubMed] [Google Scholar]
Associated Data
This section collects any data citations, data availability statements, or supplementary materials included in this article.
Supplementary Materials
Schematic of study flow. cfDNA, cell-free DNA; ctDNA, circulating tumor DNA; gDNA, genomic DNA; HER2, human epidermal growth factor receptor 2; HR, hormone receptor; MBC, metastatic breast cancer; TNBC, triple negative breast cancer.
Volumes of blood collected, cell-free DNA extracted (concentrations and total amounts), and sequencing statistics for all patients.
Genes included in the panel.
Demographics and clinical features of patients.
Note: #p-values were calculated using Student'st-tests for continuous variables and using Chi-square tests or Fisher's exact tests (n < 5) for categorical variables.
Baseline frequent circulating tumor DNA (ctDNA) gene mutations among HR/HER2 subtypes.
Note: *p-values were calculated by using Mentel-Haenszel Chi-square (n > 5) or Fisher's exact tests (n < 5) for categorical variables comparingacrossthe three subtypes.
Baseline circulating tumor DNA (ctDNA) gene mutations in all patients. Gene mutations identified in triple negative breast cancer (TNBC) (A), HR+ (B), HR-/HER2+ (C) and HR+/HER2+ (D) patients were listed. Frequent mutations were highlighted with colors.
Record for patients with tumor progression.
Note: # Rapid resistance indicated progression with progression-free survival (PFS) <3 months, and † late resistance indicated tumor progression after 3 months (PFS > 3 months).
A. Note *timeliness = kappa (%) + the percentage of patients withcirculating tumor DNA (ctDNA) increases but image showed no progression (ctDNA earlier than image) (%) = 100% B. Note: ctDNA gene mutations were specified for four patients (#1–#4) with increased mutation frequency while images did not exhibit progression.
Predictive efficiency of circulating tumor DNA (ctDNA) mutation model.
Note: Receiver operating characteristics (ROC) comparison among proposed joint models indicate that even TP53 + PIK3CA mutation pattern had lowest area under the curve(AUC); its sensitivity and specificity was optimal among the three models.
Circulating tumor DNA (ctDNA) gene mutations that are risk factors for progression.
Note: *Univariate and **multivariate Cox regression models were performed to evaluate the risk of individual ctDNA gene mutations for progression.