

Abstract
Purpose
To characterize a recently developed model, the retinal degenerate immunodeficient S334ter line-3 rat (SD-Foxn1 Tg(S334ter)3Lav) (RD nude rat), and to test whether transplanted rat fetal retinal sheets can elicit lost responses to light.
Methods
National Institutes of Health nude rats (SD-Foxn1 Tg) with normal retina were compared to RD nude rats with and without transplant for morphology and visual function. Retinal sheets from transgenic rats expressing human placental alkaline phosphatase (hPAP) were transplanted into the subretinal space of RD nude rats between postnatal day (P) 26 and P38. Transplant morphology was examined in vivo using optical coherence tomography (OCT). Visual function was assessed by optokinetic (OKN) testing, electroretinogram (ERG), and superior colliculus (SC) electrophysiology. Cryostat sections were analyzed for various retinal/synaptic markers and for the expression of donor hPAP.
Results
Optical coherence tomography scans showed the placement and laminar development of retinal sheet transplants in the subretinal space. Optokinetic testing demonstrated a deficit in visual acuity in RD nude rats that was improved after retinal sheet transplantation. No ERG responses were detected in the RD nude rats with or without transplantation. Superior colliculus responses were absent in age-matched control and sham surgery RD nude rats; however, robust light-evoked responses were observed in a specific location in the SC of transplanted RD nude rats. Responsive regions corresponded to the area of transplant placement in the eye. The quality of visual responses correlated with transplant organization and placement.
Conclusions
The data suggest that retinal sheet transplants integrate into the host retina of RD nude rats and recover significant visual function.
Keywords: retinal degeneration, stem cells, electrophysiology-nonclinical, optokinetic, retinal transplantation
Age-related macular degeneration (AMD) is a progressive form of vision loss that accounts for 45% of incurable vision-related illnesses in Western societies.1,2 Age-related macular degeneration and other retinal degenerative diseases are caused by a loss of photoreceptors and damage to the retinal pigment epithelium (RPE). Several treatment strategies in development such as gene therapy3–5 and micronutrient supplements6–9 are effective during early disease stages. Recently, stem cell therapies have demonstrated promise for treatment of certain forms of human degenerative eye diseases.10–12 Cells were either transplanted as RPE sheets or dissociated retinal progenitor cells (RPCs) that release trophic factors to support photoreceptor survival.13–15 In animal models, photoreceptor precursors have been injected into the subretinal space, and a small percentage of the injected cells integrated into the host photoreceptor layer.16–20
At later stages of retinal degeneration, photoreceptors and RPE are severely damaged. This irreversible damage is not responsive to any protective effects of various treatment strategies. One potential treatment for later stages of disease is to transplant RPCs as an intact sheet into the subretinal space.21,22 These sheets of cells develop like a normal retina, in contrast to single-cell suspensions.23–27 Additionally, due to the increased stability, the retinal sheets can replace the damaged photoreceptors and RPE and other retinal cells while also releasing trophic factors.28 Previously, transplanted fetal retinal progenitor sheets have successfully improved responses to visual stimuli in the higher visual areas in retinal degenerate rodents22,28–32 and led to improved visual acuity in humans.33 Such transplants have been well tolerated in the host retina and have shown signs of functionality and anatomic integration.22,28
Transplants of fetal retinal tissue from a different species (xenografts) require immunosuppression for survival.34 However, immunosuppression is labor intensive, but most importantly, may cause additional pain and discomfort to the animals and can have negative effects on the health of the recipient, especially with long-term use; for example, the most commonly used immunosuppressant, cyclosporine A, can have nephrotoxic effects.35,36 Therefore, we have developed a double mutant rat with a Foxn1−/− and S334ter−/− line-3 rhodopsin mutation21 rendering the rat both immunodeficient and retinal degenerate. This new model (RD nude rat) eliminates the need for immunosuppression when transplanting xenografts and will also eliminate a slow chronic immune rejection of allografts (as used for this study).
The present study functionally characterizes this RD nude rat model with transplants of fetal rat retinal allografts. We measured visual acuity using optokinetic (OKN) testing together with ERG and extracellular recordings of light responses from the superficial layers of the superior colliculus (SC). After retinal sheet transplantation of human alkaline phosphatase–labeled (R26-hPAP) rat retina,22,37 assessment of visual function was performed. Our hypothesis is that transplantation of rat fetal retinal sheets will improve electrophysiological and OKN light responses in this RD nude rat.
Methods
Animals
For all experimental procedures, animals were treated in accordance with the National Institutes of Health guidelines for the care and use of laboratory animals and the ARVO Statement for the Use of Animals in Ophthalmic and Vision Research, and under a protocol approved by the Institutional Animal Care and Use Committee of the University of California-Irvine. All animals were group housed (two or three rats per cage) unless veterinary care necessitated individual housing, in cage racks with individually filtered air. All rats were maintained on a 12-hour light/dark cycle (lights on from 6:30 AM to 6:30 PM) at an ambient temperature of 21.5 ± 0.8°C and a relative humidity of 50%.
National Institutes of Health nude rats (NTac:NIH-Foxn1rnu) were bred in-house from founder breeders purchased from Taconic (Taconic Bioscience, Inc., Hudson, NY, USA). As previously reported, donor retinal transplant tissue was obtained from rats positive for human placental alkaline phosphatase (hPAP).22,37 This rat strain was used in order to trace transplanted cells and processes in the recipient RD retina. SD-Foxn1 Tg(S334ter)3Lav (RD nude rat) transplant recipients were generated by crossing SD-Tg(S334ter)3Lav rat and NTac:NIH-Whn rats.21 Therefore, recipient rats have a mutant rhodopsin gene and a T-cell deficiency resulting in immunocompromised and retinal degenerate rats. Long-Evans (LE) rats of both sexes were purchased from Charles River Laboratories (www.criver.com).
Donor Tissue Isolation and Transplantation Procedures
Donor retinal tissue was isolated and treated as previously described.32,38,39 Retinas were dissected from E19 hPAP embryos and stored overnight at 4°C in 50 to 100 μL HibernateE medium with B-27 supplements (Life Technologies, now Thermo Fisher Scientific, Waltham, MA, USA) and brain-derived neurotrophic factor (BDNF)/glial cell-line derived neurotrophic factor (GDNF)-loaded poly lactic-co-glycolic acid (PLGA) microspheres.32,40 Retinal sheets were cut into rectangular pieces (1–1.5 × 0.6 mm) for transplantation.
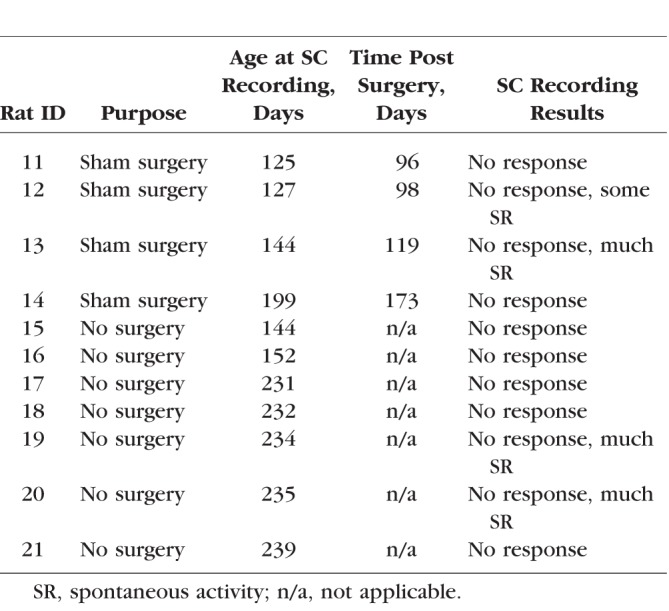
Retinal sheet transplantation was performed as previously described.32,38,41 Briefly, recipient rats (postnatal day [P] 26–38) were anesthetized with ketamine/xylazine (40–55 mg/kg ket, 6–7.5 mg/kg xyl) and pupils dilated with atropine eye drops (1%) (Akorn Pharmaceuticals, Lake Forest, IL, USA), and a small incision (∼1 mm) was made posterior to the pars plana, parallel to the limbus, followed by a local mechanical retinal detachment. To prevent eyelid swelling in RD nude rats, they received a subcutaneous injection of ketoprofen (4 mg/kg) (Zoetis, Inc., Kalamazoo, MI, USA) and dexamethasone eye drops (Bausch & Lomb, Inc., Tampa, FL, USA) prior to anesthesia. The eye was frequently treated with tetracaine (Bausch & Lomb, Inc.) and dexamethasone eye drops. Donor retinal transplant tissue was delivered to the subretinal space of the left eye using a custom implantation instrument.41 The incision was closed with 10-0 sutures. Sham surgery consisted of placing the instrument into the subretinal space and injecting medium containing BDNF/GDNF microspheres. For recovery, rats were given a subcutaneous injection of Ringer's saline solution and the analgesic Buprenex (0.03 mg/kg) (Reckitt Benckiser Pharmaceuticals, Inc., Richmond, VA, USA) for pain management and placed in a Thermocare (Paso Robles, CA, USA) incubator to recover. An overview of transplants, sham surgeries, and nonsurgery controls is shown in Tables 1 and 2.
Table 1.
Overview of Experimental Animals

Table 2.
Sham Surgeries and Nonsurgery RD Controls for SC Recording
SD-OCT Imaging
Rats were anesthetized with ketamine/xylazine and isoflurane (0.5–1.5%) mixed with oxygen through a gas anesthesia mask (Stoelting, Wood Dale, IL, USA). A 1% atropine sulfate ophthalmic solution was applied to the eye to dilate the pupil. Spectral-domain optical coherence tomography (SD-OCT) images of the retina were obtained using a Bioptigen Envisu R2200 Spectral Domain Ophthalmic Imaging System (Bioptigen, Research Triangle Park, NC, USA). Eyes were kept moist between scans with Systane eye drops (Alcon Laboratories, Inc., Fort Worth, TX, USA). With an imaging depth of 1.6 mm, rectangular scans of a 2.6 × 2.6-mm area of the fundus were taken with at least one of four scan parameters (units are no. B-scans / no. A-scans / B-scan averaging value): 488 × 488 × 5, 700 × 70 × 25, 800 × 50 × 30, and 800 × 20 × 80. The second value is the number of A-scans performed along the fundus axial plane. Each A-scan was then probed further a defined number of times to generate a cross-sectional reconstruction of the retinal plane called the B-scan. The first value reflects the number of B-scans per A-scan. To reduce background speckle and improve resolution of low-contrast and hard-to-see layers, B-scans at one spatial location are averaged together. The third number is the B-scan averaging value and the higher the number, the better the resolution. Whenever possible, the optic disc was centered and used as a point of reference. Transplanted rats were imaged every 1 to 2 months from 1 week after surgery up to 6 months of age (5 months post surgery), with the last scan as close to the terminal experiment (SC recording) time as possible. Control LE, NIH nude, and RD nude rats were imaged at approximately similar ages.
Quantification of Retinal Layer Thickness
The size and location of the transplant were determined by using the optic disc as a reference point. Retinal layer thickness was quantified in 800 × 20 × 80, 800 × 50 × 30, 700 × 70 × 25, or 488 × 488 × 5 retinal scans using InVivoVue Diver Release 2.0 (Bioptigen). In the Diver software, a 5 × 5 grid of 25 points was overlaid onto a fundus image of the retina to be analyzed. At each of these points, the averaged B-scan is displayed and the thicknesses of the following layers were manually measured: nerve fiber, inner plexiform, inner nuclear, outer plexiform, outer nuclear, interdigitation zone, RPE. Layers were defined according to the International Nomenclature for Optical Coherence Tomography Panel.42 The following groups of layers were also measured at each point: total retinal thickness (TR) (defined as all retinal layers, from nerve fiber layer including RPE) and outer retina (OR) (outer plexiform layer, outer nuclear layer, inner and outer segments without RPE). These additional groups were needed because the outer retinal layers were indistinguishable in RD rats and could not be measured individually. The average of each layer thickness was determined for each retinal scan after taking thickness measurements at each of the 25 points. Data were organized by age and strain. Mean thickness was calculated using a custom Python 3.4 program (Python Software Foundation, in the public domain http.www.python.org, Beaverton, OR, USA), and standard deviations for each group were then determined using GraphPad Prism 6.0 software (La Jolla, CA, USA).
Optokinetic Response Testing
Visual acuity of RD nude rats (transplanted, sham surgery, and nonsurgery) and non-RD control rats (NIH nude and LE) was measured by recording optomotor responses43,44 to a virtual cylinder with alternating black and white vertical stripes (OptoMotry; Cerebral Mechanics, Inc., Lethbridge, AB, Canada). Tests were performed two or three times at the age of 7 to 12 weeks, 13 to 16 weeks, and 17 to 20 weeks (see detailed description below). Several animals received fewer tests, either because they had to be treated for infections or because they were recorded in the SC (terminal procedure) at an earlier time point. In most animals, the final OKN test was conducted within 1 month prior to the SC recording. Rats were dark adapted for a minimum of 30 minutes prior to testing. At the beginning of each test, rats were habituated for 2 minutes with a gray visual display. Then optomotor (head-tracking) responses were recorded at six different spatial frequencies (black and white stripes) for 1 minute per frequency moving in each direction (clockwise and counterclockwise). Testing occurred from the lowest frequency to the highest (0.05–0.45 cyc/deg) with 2 minutes of habituation to the gray screen between each frequency tested. All tests were videotaped and evaluated offline by two independent reviewers masked to the experimental condition. If there was a discrepancy between the two observers, videos were reanalyzed by a third observer, and data were discussed before giving a final score. For all statistical analyses, significance level was calculated in GraphPad using mean ± SEM. A P value < 0.05 was considered significant.
Electroretinography
Electroretinography was performed within 1 month prior to the SC recording (age at testing ranged between 2.5 and 6 months) using the HMsERG system (Ocuscience, Las Vegas, NV, USA) as previously described.45,46 Briefly, rats were dark adapted for a minimum of 2 hours prior to testing. The rats were then anesthetized with ketamine/xylazine and 0.5% to 2% isoflurane. Pupils were dilated using tropicamide 1% (Bausch & Lomb, Inc.) eye drops. Contact lens electrodes were placed on the cornea of both eyes, with reference and ground electrodes placed subcutaneously. An optically clear ophthalmic gel was used to maintain hydration and conductivity between the cornea and recording electrodes. Scotopic testing was conducted with flash stimuli intensities ranging from 1 to 25,000 millicandela (mcd) followed by photopic testing (light adaptation of 10 minutes prior to the photopic test, which records flash stimuli responses of 10–25,000 mcd).
Superior Colliculus Electrophysiology
Visual responses from the SC were recorded as previously described.30,32,47 Responses from transplanted RD nude rats were recorded between 3.6 and 8.3 months of age (see Table 1) and compared with responses from age-matched nontransplanted RD nude, NIH nude, and LE rats. Briefly, after overnight dark adaption, rats were anesthetized with an injection of ketamine/xylazine, 0.5% to 2% isoflurane, and tetracaine applied to the eyes. The pupils were dilated using tropicamide 1% (Bausch & Lomb, Inc.) eye drops. A craniotomy was performed and the surface of the SC exposed by removing the overlying cortex. A tungsten microelectrode (0.5 MΩ impedance; MicroProbe, Inc., Gaithersburg, MD, USA) was used to record multiunit electrical responses from 25 to 70 locations on the SC surface approximately 200 to 400 μm apart. Light stimuli (20- to 40-ms duration) were delivered approximately 10 times at 10-second intervals at an intensity of 0.58 to −6.13 log cd/m2. When responses were found, the light stimuli were reduced until there was no response. Electrophysiological responses to light stimuli (stimulus level 0.58 log cd/m2) were quantified over the area of the SC recorded by spike counts and mapped over that area recorded. All spikes occurring 30 to 210 ms after the onset of the photic stimulus were counted. The sum was averaged across 10 stimulus presentations. Analyses of the responses were performed using a custom MATLAB program (Mathworks, Natick, MA, USA).
Histology and Immunofluorescence
After SC recording (2.3–7.5 months after surgery, see Table 1), rats were perfusion-fixed with cold 4% paraformaldehyde in 0.1 M Na-phosphate buffer. The eye cups were dissected along the dorsoventral axis, infiltrated overnight in 30% sucrose before embedding in Tissue-Tek (Sakura, Torrance, CA, USA) OCT (optimum cutting temperature) compound and freezing using isopentane on dry ice. Serial 10-μm cryostat sections were cut and stored at −20°C. Every fifth slide was analyzed for donor hPAP expression using 5-bromo-4-chloro-3-indolyl-phosphate (BCIP)/nitro blue tetrazolium (NBT) substrate (B1911; Sigma-Aldrich Corp., St. Louis, MO, USA). Sections of control nontransplant eyes were stained using hematoxylin and eosin (H&E).
For immunofluorescence analysis, cryostat sections were incubated in HistoVT One (1:10 dilution, 30 minutes at 70°C; Nacalai, Inc., San Diego, CA, USA) for antigen retrieval, washed with PBS (phosphate-buffered saline: 0.1 M NaCl, 0.05 M Na-phosphate buffer, pH 7.2), and blocked for at least 30 minutes in 10% donkey serum. Primary antibodies were rabbit anti-hPAP (SP15, 1:50; Epitomics, Burlingame, CA, USA); mouse anti-PKCα (protein kinase C α) (1:100; Stressgen [now Enzo Life Sciences, Plymouth Meeting, PA, USA]); mouse anti-rhodopsin48 (rho1D4, 1:100; gift of Robert S. Molday, University of British Columbia); mouse anti-recoverin49 (1:500; gift of James F. McGinnis, University of Oklahoma); mouse anti-Bassoon (1:600; Stressgen); mouse anti-calbindin (1:500; Sigma-Aldrich Corp.); mouse anti-PSD95 (1:500; Stressgen); mouse anti-HPC150 (1:500; gift of Colin J. Barnstable, now Penn State College of Medicine); mouse anti-calcium-calmodulin kinase II (CamKII, 1:100; Chemicon, Temecula, CA, USA [now EMD Millipore]); rabbit anti-Iba1 (1:100; Biocare Medical, Concord, CA, USA); rabbit anti-CRALBP (cellular retinaldehyde binding protein)51 (1:1000; gift of John C. Saari, University of Washington); and rabbit anti-GFAP (glial fibrillary acidic protein) (1:50; Chemicon). Primaries were left on sections overnight at 4°C. After several PBS washes, slides were incubated for at least 30 minutes at room temperature in fluorescent secondary antibodies (dilution of 1:200–1:400), Alexa Fluor 488 donkey anti-rabbit IgG (H+L) and rhodamine X donkey anti-mouse IgG (H+L) (Jackson Immuno Research, Westgrove, PA, USA). Sections were then washed with PBS, coverslipped using Vectashield mounting media (Vector Labs, Burlingame, CA, USA) with 5 μg/mL 4′,6-diamidino-2-phenylindole (DAPI), and imaged using an Olympus BXH10 (Cypress, CA, USA), Nikon FXA microscope (Nikon Instruments, Melville, NY, USA), or a Zeiss LSM700 confocal microscope (Carl Zeiss Microscopy GmbH, Oberkochen, Germany), taking stacks of 5- to 8-μm thickness at ×20, ×40, and ×63 (selected images). Zen 2012 software (https://www.zeiss.com/microscopy/us/downloads/zen.html; in the public domain) was used to extract confocal images. Three-dimensional (3D) images were extracted separately for each channel and combined in Adobe Photoshop CS6 software (San Jose, CA, USA). In addition, Volocity (x64) software (Perkin-Elmer, www.cellularimaging.com; in the public domain) was used to obtain higher-magnification 3D opacity-rendered images that could be rotated for better viewing of 3D structures such as cell bodies and cellular processes. These images were also used to determine if labels were colocalized in certain locations.
Statistical Analysis
For all statistical analyses, the significance level was calculated in GraphPad Prism software using t-tests (paired and unpaired), 1-way ANOVA for multiple comparisons, and Tukey post hoc analysis. Level of significance was set at P < 0.05.
Results
OCT of Control Eyes
At 1 month (the approximate age of transplantation), RD nude rat retinal layers (Supplementary Figs. S1C, S1D) were significantly thinner compared to those of NIH nude rats with regard to the nerve fiber layer (NFL, P < 0.05), inner plexiform layer (IPL, P < 0.0001), inner nuclear layer (INL, P < 0.0001), outer retina (OR, P < 0.0001), and RPE (P < 0.0001) (Supplementary Fig. S1). At the age of 5 to 7 months, retinal layer thickness was quantified using OCT images and compared between LE, NIH nude, and RD nude rats (Fig. 1A). Retinal thicknesses and lamination were similar in normal LE and NIH nude rats, whereas RD rats exhibited comparatively thinner IPL (P < 0.003), OR (P < 0.0001), and RPE layers (P < 0.04). The LE rat retina (Fig. 1B) and NIH nude (NIH) rat retina (Fig. 1D) appeared normal with distinct visible layers. However, RD nude rats (Fig. 1F) had severe deficits in retinal layers, most strikingly with an almost complete absence of outer retinal layers. Hematoxylin and eosin staining (Figs. 1C, 1E, 1G) confirm the OCT results.
Figure 1.

SD-OCT and histology of LE, NIH, nude, and RD nude rats. (A) Quantification of retinal layer thickness using OCT scans: LE rats (n = 6) and NIH nude rats (n = 6) were compared to RD nude rats (n = 2) at the age of 5 to 7 months. Asterisks correspond to P < 0.05; color indicates significant difference for corresponding layer color. (B, D, F) Sample images of cross-sectional retina OCT scans in (B) LE rat (age 6.8 months), (D) NIH nude rat (age 6.8 months), and (F) RD nude rat (age 4 months). Vertical bar: 50 μm; horizontal bar: 300 μm. (C, E, G) Hematoxylin and eosin staining of the retina for (C) LE rat (age 7 months), (E) NIH rat (4 months), and (G) RD rat (6.6 months). Scale bars: 50 μm. RPE, retinal pigment epithelium; OS, outer segments; IS, inner segments; OLM, outer limiting membrane; ONL, outer nuclear layer; OPL, outer plexiform layer; INL, inner nuclear layer; IPL, inner plexiform layer; GCL, ganglion cell layer; NFL, nerve fiber layer; OR, outer retina (OPL, ONL, OLM, IS, OS); IR, inner retina (NFL, GCL, IPL, INL); TR, total retina (from nerve fiber layer to RPE).
Immunohistochemistry of Control Eyes
Histologic analysis demonstrated that 1- and 4-month old NIH nude rat retina appears morphologically normal with clear retinal layers, including rod bipolar cells indicated by PKCα staining (Figs. 2A, 2D), a thick photoreceptor layer, and cone bipolar cells as expressing recoverin (Figs. 2B, 2E) and outer segments labeled for rhodopsin (Figs. 2C, 2F). In contrast, the RD nude rats without retinal sheet transplants and sham surgery rats showed substantial loss of outer nuclear layer thickness indicating massive photoreceptor loss over time. At 1 month, an outer plexiform layer is still recognizable (Fig. 2G). The photoreceptor layer is only one cell layer thick (Fig. 2H), and few cells still express rhodopsin (Fig. 2I). At 6.6 months, rod bipolar cells show abnormal morphology with remodeling and no clear outer plexiform layer (Fig. 2J). There are only scattered cones (Fig. 2K), and there are no remaining rods as indicated by the loss of rhodopsin immunoreactivity (Fig. 2L).
Figure 2.

Immunohistochemistry on nonsurgery controls for PKCα, a marker of rod bipolar cells (A, D, G, J); recoverin, a marker for cone bipolar cells and photoreceptors (B, E, H, K); and rhodopsin (C, F, I, L). (A–C) 1-month-old NIH nude rat retina (section somewhat obliquely cut so layers appear much thicker than with the 4-month-old NIH retina); (D–F) 4-month-old NIH nude rat retina; (G–I) 1-month-old RD nude rat retina: (G) outer plexiform layer still clearly recognizable with PKC staining; (H) the outer nuclear layer is reduced to one cell layer; (I) few cells in the ONL are immunoreactive for rhodopsin; (J–L) 6.6-month-old RD nude rat retina: few photoreceptors left. 3D images of confocal ×40 stacks. Scale bars: 20 μm. GCL, ganglion cell layer; IPL, inner plexiform layer; INL, inner nuclear layer; OPL, outer plexiform layer; ONL, outer nuclear layer.
OCT of Transplanted Eyes
In vivo imaging of the transplanted tissue was performed at different time points (examples in Figs. 3A–J). Representative images (Fig. 3) contrast an ideal result with a suboptimal transplant. A laminated transplant is represented in Figures 3A, 3C, 3E, 3G, 3I, and 3K (no. 5 in Table 1) with distinct organized layers. At 6 days after transplantation (Fig. 3C), the inner and outer retinal layers have not yet separated, whereas clear lamination can be seen for 19 to 90 days after transplantation (Figs. 3E, 3G, 3I). Note the large areas of lamination (confirmed by histology in Fig. 3K) that are consistent with those seen in a normal retina. In contrast, the second transplant (in Figs. 3B, 3D, 3F, 3H, 3J; no. 1 in Table 1) represents a highly rosetted and structurally disorganized transplant that was partially placed upside down. Note the absence of any distinct layers in the transplant and the circular rosette structures throughout as confirmed by histology in Figure 3L.
Figure 3.

Transplant examples visualized by SD-OCT. (A, B) OCT fundus images and (C–J) OCT cross-sectional B-scans from transplanted RD rats no. 5 and 1 (see Table 1) at 6 (C, D), 19 (E, F), 62 (F, H), and 90 (G, I) days after surgery. Rosettes are indicated by yellow arrows (D, F, H, J) and seen as hyperreflective orbs. (I, J) Stretched B-scans of (G, H) to better distinguish different retinal layers. (K, L) Transplant-specific histochemistry for human placental alkaline phosphatase (hPAP) using BCIP (purple). hPAP is expressed in the cytoplasm (not the nuclei) of donor cells. Two transplant examples are shown. Transplant no. 5 (A, C, E, G, I, K) has a large area of lamination (parallel retinal layers with photoreceptor outer segments, indicated by yellow diamonds (K) and strong rhodopsin expression (M) in the donor outer retina). Transplant no. 1 (B, D, F, H, J, L) is more disorganized with photoreceptors in rosettes (rosette lumens indicated by yellow asterisks in [L]). The rhodopsin-positive outer segments face inward (N). This transplant (L) was partially placed upside down in the subretinal space. (A, B) Scale bars: 300 μm; (C–H) vertical bar: 100 μm; horizontal bar: 200 μm; (I, J) vertical bar: 50 μm; horizontal bar: 200 μm; (K, L): Scale bars: 100 μm; (M, N) Scale bars: 20 μm.
Optokinetic Testing
Good head-tracking behavior in response to OKN stimulation was observed in the control non-RD groups (LE rats and NIH nude rats, age group 17–20 weeks, Fig. 4A). As evidenced by the visual acuity responses, no significant difference was seen between LE rats and NIH nude rats. In RD no-surgery nude rats, age group 17 to 20 weeks, severe visual functional deficits were observed as demonstrated by significant loss of OKN visual acuity (RD versus LE, P < 0.0001, and RD versus NIH rats, P < 0.0001; Fig. 4A). Significant loss of OKN visual acuity was also observed in RD sham surgery rats (age group 7–12 weeks: sham RD nude versus NIH nude rats, P < 0.005; age group 17–20 weeks: sham [n = 10] versus NIH nude [n = 7], P < 0.0001; Fig. 4B).
Figure 4.

Results of optokinetic (OKN) testing. (A) The visual acuity responses of normal LE rats (n = 6) and NIH nude rats (n = 7, 17–20 weeks old) were more or less similar whereas nontransplant RD nude rats (n = 6, 17–20 weeks old) failed to show considerable OKN behavior. (B) Comparisons between the nonsurgery eyes and surgery eyes of RD nude rats (sham surgery rats and retinal sheet transplanted rats) were made at 7 to 12 (transplant: n = 9, sham: n = 7, NIH nude: n = 5), 13 to 16 (transplant: n = 5, sham: n = 6), and 17 to 20 (transplant: n = 5, sham: n = 10, NIH nude: n = 7) weeks of age. Transplanted eyes showed improved visual acuity compared to the nontransplanted eyes (P = 0.0056, age 7–12 weeks; P = 0.0367, age 13–16 weeks) and when compared to the sham surgery group (P = 0.0148, age 17–20 weeks). Statistical significance was calculated using mean ± SEM.
Retinal degenerate nude rats that received retinal sheet transplants showed improvement in visual responsiveness (Fig. 4B) as evidenced by the higher visual acuity compared to the sham surgery group (transplant group versus sham group, P < 0.05, age group 17–20 weeks; unpaired t-test), and based on the comparison between the transplanted eyes and the nontransplanted eyes (P < 0.01, age group 7–12 weeks; P < 0.05, age group 13–16 weeks; P < 0.05, age group 17–20 weeks; paired t-tests). There was no significant difference between the nontransplanted eyes in transplant RD rats and sham surgery RD rats (nontransplanted eyes versus sham, P = 0.75, age 7–12 weeks; nontransplanted RD eyes versus sham RD, P = 0.49, age 13–16 weeks; nontransplanted RD eyes versus sham RD, P = 0.23, age 17–20 weeks). Supplementary Figure S2A shows a comparison between transplant organization and OKN responses at the third test at 17 to 20 weeks. Laminated transplants and one rosetted transplant had better OKN responses than transplants with weak or no SC responses.
Electroretinography
Scotopic and photopic ERG was recorded from LE, NIH nude, and RD nude rats at the age of 2.5 to 6 months (Fig. 5). Electroretinogram responses in RD nude rats were considerably weak and not very apparent. Long-Evans rats (n = 7) and NIH nude rats (n = 6) showed significantly higher scotopic (P < 0.0001, Fig. 5A) and photopic (P < 0.05, Fig. 5B) B-wave responses compared to the RD nude rats (n = 17). No apparent ERG responses could be recorded from sham surgery RD nude rats (n = 5) and retinal sheet transplanted RD nude rats (n = 5).
Figure 5.

ERG recordings from Long-Evans (LE) (n = 7), NIH nude (n = 6), and RD nude rats (no surgery, n = 6; sham, n = 5; transplant, n = 6) at the age of 2.5 to 6 months. Results are presented as mean + SEM. (A) Scotopic response B-wave amplitude: robust response from LE and NIH nude rats but no response from RD nude rats (P < 0.0001). (B) Photopic B-wave: robust responses in LE and NIH nude rats but no response in RD rats (P < 0.05).
Electrophysiological Recording of Visual Responses in the SC
Figure 6 shows SC mapping data from rats tested at a light intensity of 0.58 log cd/m2. At this stimulus level, non-RD control groups (LE rats and NIH nude rats) showed robust light-evoked activity in the SC, whereas RD nude rats (nontransplanted and sham surgery) showed no light-evoked responses in the SC. Figure 6A shows sample traces from LE, NIH nude, and RD rats. Responses were recorded from all over the SC in LE rats (Fig. 6B) and NIH nude rats (Fig. 6C) but were absent in the SC of nontransplanted RD nude rats (Fig. 6D) and in the RD sham surgery group (Fig. 6E).
Figure 6.

Superior colliculus responses in control and sham surgery rats. LE and NIH nude rats had robust responses to light but no-surgery and sham surgery RD nude rats did not. (A) Sample traces of SC recorded visually evoked responses. Arrow indicates the light stimulus. (B–D) Spike count totals over the entirety of region recorded in SC for representative example of (B) LE, (C) NIH, (D) RD no-surgery, and (E) RD sham surgery rat. Color coding of spike counts is indicated on the right.
Data from the transplanted rats were grouped into laminated (L), rosetted (R), and disorganized (D), based on the morphologic organization of the transplants (Fig. 7A; criteria in Fig. 3). Retinal degenerate rats with retinal sheet transplants (8/9) showed visual activity in a small SC area (see heat maps in Fig. 7A; Table 1) with a peak approximately corresponding to the placement of the transplant in the retina. The peak area showing maximal responses attenuated as the recording sites moved away from the peak (Figs. 7B, 7C). The above SC response pattern was consistent among most of the RD nude rats that received retinal sheet transplants (Fig. 7A), although the degree of visual response varied between individual rats (Fig. 7C; Table 1). The organized response maps in Figure 7A and the strong responses shown in Figure 7B were obtained from rats in which the transplant was well organized and laminated (Fig. 7; rat ID nos. 3, 5, 7, and 8). By contrast, comparatively weak responses shown in Figures 7A and 7C were obtained from rats in which the transplant was not well laminated and contained rosettes, or when the transplant was placed upside down (based on histologic verification, rat ID nos. 10, 9, 2, and 1). Rat 4 with a disorganized transplant had no responses.
Figure 7.

SC recordings from RD nude rats with retinal sheet transplants. (A) Spike count totals (heat maps) over the entirety of the region recorded in SC for all transplanted rats (the numbers inside the circles are the same rat ID numbers as in Table 1). L: laminated transplant. R: rosettes transplant. D: disorganized transplant. Responses were observed only in certain areas in the SC and were centered on a peak. Sample traces from areas (marked with X) with robust, intermediate, and no response for (B) transplant no. 5 with strong responses and (C) transplant no. 1 with weak responses. Arrows and black bars indicate the light stimulus.
As shown in Figure 7A and Table 1, the percentage of responsive areas is significantly (P < 0.05) larger in laminated transplants (33.8 ± 6.4%, n = 4) compared to rosetted transplants (6.3 ± 3.8%, n = 3) and disorganized transplants (1.9 ± 1.9%, n = 2), respectively. The spike count is significantly higher (P < 0.05) in laminated transplants (72.3 ± 13.5, n = 4) compared to rosetted transplants (31.0 ± 8.2, n = 3) and disorganized transplants (9.0 ± 9.0, n = 2), respectively. This relation between transplant organization and SC responses is also shown in Supplementary Figure S2B. Supplementary Figure S2C compares responses of transplanted rats in OKN testing with the results of SC recording and shows some correlation, although the N was too low for statistical analysis. The best response threshold of RD nude rats with laminated transplants was −2.22 log cd/m2, whereas it was consistently higher at 0.58 log cd/m2 in RD nude rats with rosetted and disorganized transplants (see Table 1).
Immunohistochemistry of Transplant Eyes
Based on OCT imaging, in RD nude rats that received a retinal sheet transplant, the transplanted tissue was located in the subretinal space between the host retina and RPE. Transplant organization varied between lamination and rosettes (Table 1). Data from the same transplanted rats (as shown in Table 1, rat ID nos. 5, 6, and 1) are used as examples throughout the paper. Transplants were stained for hPAP (donor), in combination with recoverin, rhodopsin, and red–green opsin (Fig. 8). Transplant 5 indicates a clear laminated structure with recoverin, rhodopsin-, and cone opsin–positive photoreceptors with no photoreceptor-positive labeling in the host (Figs. 8A, 8C, 8E). Laminated transplants had recoverin-positive cone bipolar cells (Fig. 8A) and PKCα-positive rod bipolar cells (Figs. 9A, 9D). Transplant no. 1 also expressed the same markers, but the transplant had been placed upside down. The cells were organized into rosetted structures (spherical arrangement of photoreceptors around a lumen, surrounded by other retinal layers) (Figs. 3L, 3N, 9G–I).
Figure 8.

hPAP (donor, green), recoverin (red), rhodopsin (red), and red–green opsin staining in well-laminated transplants. Nuclei in (A, C, E, F) are labeled in blue. Arrowheads point to transplant processes in the host IPL. (A, C, E) are 3D images of confocal stacks; Scale bars: 20 μm. (B, D, F) are zoomed in and rotated 3D opacity images rendered in Volocity. (A, B) recoverin (photoreceptor and cone bipolar cells); (A) shows laminated structure of transplant with cone bipolar cells evident in the INL of transplant and host. (C, D) Rhodopsin (red: rods). (E, F) red–green opsin (red: red–green cones); the dashed line in (E) represents the transplant border. H, host; T, transplant; GCL, ganglion cell layer; IPL, inner plexiform layer; INL, inner nuclear layer; ONL, outer nuclear layer; OS, outer segments.
Figure 9.

hPAP (donor, green) and PKCα (red) staining in transplants. Protein kinase C α (PKC) (red: rod bipolar cells) labeling of transplanted eyes, donor tissue labeling with green (hPAP) and nuclei with blue (A–H; DAPI). (A–C) Well-laminated transplant no. 5 and (D–F) laminated transplant no. 6. (G–I) Upside-down transplant no. 1. (A, D, G) Overview images (all three channels). Boxes indicate areas of enlargements in (B, C, E, F, H, I). (B, E, H) hPAP staining (green) in combination with DAPI (blue); (E, F) PKCα (red) in combination with donor cell label (green). PKC labeling was found within the host as well as the transplant. Laminated transplants with many donor processes extending into the host retina (A–E) (white arrowheads) and wrapping around PKC-positive host bipolar cells (C, F) (yellow asterisks). (G–I) Transplant no. 1, partially upside-down and rosetted structure with no processes extending into host retina; but there were PKCα-positive cells within the transplant (purple arrowheads in [I]). Scale bars: 20 μm. H, host; T, transplant; GCL, ganglion cell layer; IPL, inner plexiform layer; INL, inner nuclear layer; ONL, outer nuclear layer.
Interestingly, laminated transplants (ID nos. 5 and 6) had processes extending into the IPL of the host retina (arrowheads in Figs. 8A, 8C, 9A, 9B, 9D, 9E; see also Figs. 10D–F) demonstrating signs of potential synaptic integration between the transplant and the host (yellow asterisks, Figs. 9C, 9F).
Figure 10.

Staining for Bassoon (red: ribbon synapses) (A–F) and HPC-1 (red: syntaxin, membranes of amacrine cell bodies and plexiform layers) (G–L). Donor cells are labeled green (hPAP) and nuclei in blue (DAPI). (A) Bassoon labeling of the IPL and OPL in a 4-month-old normal NIH nude retina. (B) The remaining IPL ribbon synapses labeled with Bassoon in a 6.6-month-old RD retina with sham surgery (no. 14). No OPL recognizable. (C–E) Ribbon synapses present in the host and donor IPL in laminated transplant no. 5. (D) Enlargement at the host–transplant interface with donor processes (green) infiltrating host. Areas of magnification in (E) and (F) are indicated. (E) Transplant processes (green) evident in the host INL and IPL. (F) 3D opacity image of donor processes (green) extending into the host retina IPL with colocalization of red and green indicating synaptic contact between the two (arrowheads). (G, H, J, K) Laminated transplant no. 5 with HPC-1 staining evident in the host and transplant IPL, and (H, J) amacrine cells in transplant INL (arrowheads). (K) Enlarged 3D opacity image at the host–transplant interface with colocalization of red and green staining indicating transplant processes making synaptic contact with host. (I, L) Strong HPC-1 labeling of host IPL and very little in donor within rosetted (white asterisks) transplant no. 1 IPL, but amacrine cells are present. (L) Enlargement of a small area with few transplant processes extending into host. Scale bars: 20 μm.
In a rosetted transplant (ID no. 1), only a small area showed donor processes extending into host retina (Figs. 9I, 10I, 10L).
As the retina degenerates in an RD rat, the OPL along with the ONL degenerates, and Bassoon staining indicative of active ribbon synapses is found only in the IPL (Fig. 10B) rather than in both the OPL and IPL (Fig. 10A). Bassoon-positive staining in transplant no. 5 (Figs. 10C–F) revealed that ribbon synapses were present not only in the donor IPL but in the OPL as well, comparable to a normal retina (Fig. 10A). Examination of the 3D opacity image revealed possible ribbon synaptic contact between donor processes and host IPL (Fig. 10F). Transplants developed other mature retinal cell types as well. Amacrine cells were labeled by syntaxin/HPC-1 in laminated transplant 5 (arrowheads in Figs. 10H, 10J) and rosetted transplant 1 (Figs. 10I, 10L).
Staining positive for PSD95 in the OPL within the donor area of transplant no. 5 indicated the presence of photoreceptor terminals (Figs. 11A, 11B). Calbindin-positive staining within the INL of transplant 5 revealed the presence of horizontal cells (Figs. 11C, 11D). Calmodulin kinase II staining showed labeled ganglion and amacrine cells in the host retina, and amacrine cells in transplant no. 5 (arrowheads in Figs. 11E, 11F).
Figure 11.

PSD-95, calbindin, and CaMKII (calcium–calmodulin-dependent protein kinase II) staining (red) in combination with donor label (green). Laminated transplant no. 5 with donor cells labeled green (hPAP) and nuclei labeled blue (DAPI). (B, D, F) were obtained using 3D opacity imaging by enlarging the areas indicated in corresponding boxes within (A, C, E). (A) Immunofluorescence staining with postsynaptic density protein (PSD-95, red: OPL synapses) indicates positive staining only within the transplant OPL. There was no remaining host OPL. (B) With 3D opacity imaging, colocalization of hPAP and PSD-95 was observed. (C, D) Calbindin (red: horizontal and some amacrine cells) labeling in the transplant as well as the host INL indicating development of horizontal and amacrine cells within the transplant. (E, F) CaMKII (red: synaptic layers [GCL, IPL bands, INL, ganglion. and amacrine cells]) antibody labeled IPL bands and ganglion cells within the host IPL and GCL. (E) Labeling of ganglion cells in the host GCL, and displaced ganglion cells or amacrine cells (ACs) within the host INL were observed. CaMKII also labeled what are most likely ACs in the donor INL (arrowheads). (F) Enlargement of area with displaced GCs/ACs in host INL and ACs within the donor INL. Scale bars: 20 μm.
Within the laminated transplants, Müller cells developed radial orientation (Figs. 12C, 12D, 12F), whereas they were more disorganized in rosetted transplants (data not shown). Analysis of GFAP (Figs. 12A–D) showed that Müller cells, which are normally not immunoreactive for GFAP (Fig. 12A), expressed GFAP in the RD control (Fig. 12B) and in both the recipient and transplant (Figs. 12C, 12D). Expression of CRALBP (Figs. 12E, 12F) also confirmed the presence of Müller cells within and around transplant no. 5. Some areas of the transplant–host interface in transplant no. 5 contained an apparent glial barrier (Figs. 12C, 12D, 12F), which was, however, not continuous.
Figure 12.

GFAP, CRALBP, and Iba1 expression in NIH nude rats, sham RD, and surgery RD rats. In images of transplant 5 (C, D, F, I, J), a dashed line indicates the approximate border between transplant and host. (A) NIH nude retina (7.5 months): GFAP expression is restricted to nerve fiber layer astrocytes. (B) Sham RD rat (6.6 months) and (C, D) transplant 5 (rat age 6.9 months) show similar GFAP expression levels in activated Müller cells, but (D) is a zoom of a region in (C) that demonstrates there is only a partial glial barrier at the transplant–host interface. The host and transplant retina contains radial processes of Müller glial cells that also wrap around blood vessels. (E) CRALBP localization in NIH nude rat (3.9 months): stain of RPE and radial processes and cell bodies of Müller cells. (F) Transplant 5: strong CRALBP staining of host and transplant radial Müller glia and host RPE. Partial limiting membrane between transplant and host recognizable in (F). (G–J) Microglia marker Iba1; (G) NIH nude retina (7.5 months): The resident microglia are localized in the inner retina (IPL, INL, OPL) and are few in number. They appear more amoeboid and are likely in surveillance mode. A sham RD rat (age 6.9 months) (H) and transplant 5 (I, J) show increased Iba+ expression and branching morphology indicative of microglial activation and recruitment. (J) is an enlargement of the boxed area in image (I) demonstrating process extension and activation. 3D images of confocal stacks. Scale bars: 20 μm.
Figure 12G shows Iba1-immunoreactive microglial cells found in the inner layers of a normal retina (Fig. 12G). Activated microglia cells are recruited to the site of photoreceptor degeneration (Fig. 12H). They extend their processes into the transplant site and within the transplant itself (Figs. 12I, 12J), but their density in the transplant did not appear to be higher than in normal NIH nude retina.
Discussion
In-depth analysis of the visual function in our newly developed S334ter line-3 immunocompromised rats (RD nude rats) establishes it as a useful model for transplantation studies in the eye. Our study demonstrated that this strain manifested loss of outer nuclear layer thickness and photoreceptors as early as P30, consistent with previous observations in S334ter line-3 rats.52,53 Visual functional deficits in these rats were indicated by loss of ERG, OKN, and SC responses. These results are consistent with previously published studies indicating deficits in visual function in nonimmunocompromised S334ter line-3 rats.32,40,54–56 Based on these functional data, the addition of the FoxN1 mutation (loss of T cells) did not alter the retinal phenotype of the retinal degenerate S334ter line-3 rats. The NIH nude controls had similar OKN, ERG, and SC responses as seen in LE controls, in addition to having similar lamination and retinal thickness as determined by OCT and histology.
In the present investigation we used our newly developed immunodeficient RD rat model for allograft (rat tissue) transplantation experiments. For future experiments, since this RD rat model does not reject human cells, a better understanding of the effects of xenograft transplantation is possible. Although the eye is to a large extent regarded as an immunoprivileged organ, there is strong evidence for an immune response to a xenograft (which was not used in the present study).34,57–60
Allografted rat retinal sheets were stable when transplanted in RD nude rats. Previously, retinal sheets have been shown to improve light responses in nonimmunocompromised S334ter line-3 non-nude RD rats.22,28,29,32,40 Based on the current study, transplantation of retinal sheets into RD nude rats improves visual function based on OKN and SC electrophysiology.
Optokinetic head-tracking responses in RD rats showed higher visual acuity in the transplanted eyes (retinal sheet transplant present) versus the nontransplanted eyes at multiple time points. The improvement in OKN head-tracking and light-evoked SC responses demonstrated that retinal sheet transplants were able to improve the visual function in the transplanted area of the eye. Previous studies demonstrated that these responsive areas in the brain are synaptically connected to the transplanted tissue in the eye.22,28,61
The current investigation demonstrates that the quality of the transplant in terms of organization and placement corresponds to the quality of the SC response (independent from the age of the RD recipient). The transplants that had more lamination (as shown in OCT images and later confirmed by histology) had more robust SC responses. Conversely, the disorganized transplants had weak or no responses (see Table 1; Supplementary Fig. S2B). A comparable correlation between degree of visual restoration in the SC and transplant morphology has been previously reported32; RD rats with laminated transplants showed larger SC areas with recovered responses and responded to lower light levels than RD rats with rosetted transplants.
The organization of transplants varied between near-complete lamination to rosette formation (arrangement of photoreceptor layers around a lumen outer with outer segments in the center, surrounded by other retinal layers) and completely disorganized transplants (mixing of retinal layers with no outer segments recognizable). One reason for the formation of rosettes is the difficulty in properly placing the retinal sheet in the subretinal space of rats because of the relatively small eye and the large lens.62 Any damage to host RPE can lead to rosette formation. Additionally, choroid damage would lead to severe disorganization of the transplant.12 However, our data suggest that even rosetted transplants showed specific responses in an area of the SC. It has been shown previously that transplants with rosette formation will still result in visual responses in the SC but confined to a smaller area.32 This was further confirmed in our current investigation. Rosetted transplants often showed less connectivity with the host retina. Thus, it is possible that the positive effect of these transplants on visual function could partially be due to a trophic effect on host cones, although fetal sheet transplants were shown not to rescue host cones in a previous study.40
Immunohistochemistry for recoverin, rhodopsin, and red–green opsin demonstrated that in areas where transplant photoreceptors were in contact with host RPE, strong rhodopsin staining was observed in the outer segment area, comparable to normal retina (Fig. 8).28,39,63 As seen in Figures 9A through 9F, PKCα immunohistochemistry showed areas of potential transplant–host connectivity between bipolar cells of transplant and host, an observation reported previously.22,61 There were no such signs of neuronal integration in areas where the transplant was placed upside down (Figs. 9G–I), suggesting that the correct polarity of the transplants is important for the establishment of neuronal connections between the transplant and the host retina.64
Our previous studies demonstrated that transplant processes extended into the host retina.22,32 Extension of transplant processes into the host retina with potential synaptic integration was further confirmed by Bassoon and syntaxin (HPC-1) staining (Figs. 10C–E, 10H–K). Transplants were able to develop several mature retinal cell types, including rods/cones, bipolar, amacrine, and horizontal cells. In the case of the laminated transplants, these developed in the correct retinal layers, indicating that the complexity of retinal lamination can be achieved only with sheet transplantation.
We also analyzed the NIH nude retina for simple injury markers and found scattered Iba+ microglia localized in the inner retina, GFAP+ astrocytes in the NFL, and CRALBP+ trans-retinal Müller cells and CRALBP+ support RPE (Figs. 11A, 11G, 11E). The microenvironment seems to be noninflammatory, providing further evidence that the absence of T cells is not altering the native environment. The RD host retina develops GFAP immunoreactivity of Müller cells and microglial activation with photoreceptor degeneration53,65–67 (Fig. 12B) and retinal injury.68,69 Therefore, it was not surprising to see GFAP immunoreactivity and Iba1+ microglia within the sham surgery RD retina (Fig. 12H) and the transplanted retina (Figs. 12C, 12D, 12I, 12J). In spite of this background inflammation, the transplants themselves showed no sign of rejection or failure to thrive.
Based on the present investigation, retinal sheet transplantation failed to make any improvement in the ERG waveform. A potential explanation for this is that ERG signals originating from the comparatively small transplant (approximately 1 mm2) are not strong enough to generate a detectable ERG across the cornea since most of the surrounding retina is devoid of any visual activity. An ERG is the cumulative response of the entire retina: Therefore, the signal output from the transplant may not be sufficient to generate a faithful ERG wave form.
In summary, this study demonstrates preservation of the retinal sheet transplant in the subretinal space of a newly developed immunodeficient RD rat model [SD-Foxn1 Tg(S334ter)3Lav] and significant improvement of visual activity as evidenced by behavioral and electrophysiological assessments. The study also confirms the safety and feasibility of using retinal sheet transplantation approaches for the treatment of human photoreceptor degeneration diseases.
Supplementary Material
Acknowledgments
The authors thank Bibo Khatib for his help with the initial setup of the OCT; Shreya Akkenapalli and Daniel Galang for their help with the MATLAB coding; Nadia Rashid, Joleen T. Qiu, Olivia La Mour, Dakota Hollister, and Setareh Zareh for their help with optokinetic testing; Navjot Kaur, Jacson Wan, Parth Patel, and Mony Sary for cutting and staining cryostat sections; and Brian Cummings, PhD, (UC Irvine, Department of Physical Medicine and Rehabilitation) for his encouragement and support.
Supported by California Institute for Regenerative Medicine Grant TR4-06648 (MJS); made possible in part through access to the Optical Biology Core facility of the Developmental Biology Center, a Shared Resource supported by the Cancer Center Support Grant (CA-62203) and Center for Complex Biological Systems Support Grant (GM-076516) at the University of California-Irvine. MJS and RBA have proprietary interests in the transplantation instrument and method.
Disclosure: M.J. Seiler, P; R.E. Lin, None; B.T. McLelland, None; A. Mathur, None; B. Lin, None; J. Sigman, None; A.T. De Guzman, None; L.M. Kitzes, None; R.B. Aramant, Ocular Transplantation LLC (E, S), P; B.B. Thomas, None
References
- 1. . Lim LS, Mitchell P, Seddon JM, Holz FG, Wong TY. . Age-related macular degeneration. Lancet. 2012; 379: 1728– 1738. [DOI] [PubMed] [Google Scholar]
- 2. . Friedman DS, O'Colmain BJ, Muñoz B,et al. ; The Eye Diseases Prevalence Research Group. . Prevalence of age-related macular degeneration in the United States. Arch Ophthalmol. 2004; 122: 564– 572. [DOI] [PubMed] [Google Scholar]
- 3. . Chung DC, Lee V, Maguire AM. . Recent advances in ocular gene therapy. Curr Opin Ophthalmol. 2009; 20: 377– 381. [DOI] [PubMed] [Google Scholar]
- 4. . Guzman-Aranguez A, Loma P, Pintor J. . Small-interfering RNAs (siRNAs) as a promising tool for ocular therapy. Br J Pharmacol. 2013; 170: 730– 747. [DOI] [PMC free article] [PubMed] [Google Scholar]
- 5. . Liu MM, Tuo J, Chan C-C. . Gene therapy for ocular diseases. Br J Ophthalmol. 2011; 95: 604– 612. [DOI] [PMC free article] [PubMed] [Google Scholar]
- 6. . Chong ET, Kreis AJ, Wong TY, Simpson JA, Guymer RH. . Dietary ω-3 fatty acid and fish intake in the primary prevention of age-related macular degeneration: a systematic review and meta-analysis. Arch Ophthalmol. 2008; 126: 826– 833. [DOI] [PubMed] [Google Scholar]
- 7. . Ma L, Dou H-L, Wu Y-Q,et al. Lutein and zeaxanthin intake and the risk of age-related macular degeneration: a systematic review and meta-analysis. Br J Nutr. 2012; 107: 350– 359. [DOI] [PubMed] [Google Scholar]
- 8. . Marse-Perlman JA, Fisher AI, Klein R,et al. Lutein and zeaxanthin in the diet and serum and their relation to age-related maculopathy in the third national health and nutrition examination survey. Am J Epidemiol. 2001; 153: 424– 432. [DOI] [PubMed] [Google Scholar]
- 9. . Seddon JM, Cote J, Rosner B. . Progression of age-related macular degeneration: association with dietary fat, transunsaturated fat, nuts, and fish intake. Arch Ophthalmol. 2003; 121: 1728– 1737. [DOI] [PMC free article] [PubMed] [Google Scholar]
- 10. . Nazari H, Zhang L, Zhu D,et al. Stem cell based therapies for age-related macular degeneration: the promises and the challenges. Prog Retin Eye Res. 2015; 48: 1– 39. [DOI] [PubMed] [Google Scholar]
- 11. . Qu Z, Guan Y, Cui L,et al. Transplantation of rat embryonic stem cell-derived retinal progenitor cells preserves the retinal structure and function in rat retinal degeneration. Stem Cell Res Ther. 2015; 6: 219. [DOI] [PMC free article] [PubMed] [Google Scholar]
- 12. . Seiler MJ, Aramant RB. . Cell replacement and visual restoration by retinal sheet transplants. Prog Retin Eye Res. 2012; 31: 661– 687. [DOI] [PMC free article] [PubMed] [Google Scholar]
- 13. . Carido M, Zhu Y, Postel K,et al. Characterization of a mouse model with complete RPE loss and its use for RPE cell transplantation. Invest Ophthalmol Vis Sci. 2014; 55: 5431– 5444. [DOI] [PubMed] [Google Scholar]
- 14. . Diniz B, Thomas P, Thomas B,et al. Subretinal implantation of retinal pigment epithelial cells derived from human embryonic stem cells: improved survival when implanted as a monolayer. Invest Ophthalmol Vis Sci. 2013; 54: 5087– 5096. [DOI] [PMC free article] [PubMed] [Google Scholar]
- 15. . Li F, Zeng Y, Xu H, Yin ZQ. . Subretinal transplantation of retinal pigment epithelium overexpressing fibulin-5 inhibits laser-induced choroidal neovascularization in rats. Exp Eye Res. 2015; 136: 78– 85. [DOI] [PubMed] [Google Scholar]
- 16. . Eberle D, Kurth T, Santos-Ferreira T, Wilson J, Corbeil D, Ader M. . Outer segment formation of transplanted photoreceptor precursor cells. PLoS One. 2012; 7: e46305. [DOI] [PMC free article] [PubMed] [Google Scholar]
- 17. . Eberle D, Santos-Ferreira T, Grahl S, Ader M. . Subretinal transplantation of MACS purified photoreceptor precursor cells into the adult mouse retina. J Vis Exp. 2014; 84: e50932. [DOI] [PMC free article] [PubMed] [Google Scholar]
- 18. . Pearson RA, Barber AC, Rizzi M,et al. Restoration of vision after transplantation of photoreceptors. Nature. 2012; 485: 99– 103. [DOI] [PMC free article] [PubMed] [Google Scholar]
- 19. . Singh MS, Issa PC, Butler R,et al. Reversal of end-stage retinal degeneration and restoration of visual function by photoreceptor transplantation. Proc Natl Acad Sci U S A. 2013; 110: 1101– 1106. [DOI] [PMC free article] [PubMed] [Google Scholar]
- 20. . Yanai A, Laver CRJ, Gregory-Evans CY, Liu RR, Gregory-Evans K. . Enhanced functional integration of human photoreceptor precursors into human and rodent retina in an ex vivo retinal explant model system. Tissue Eng Part A. 2015; 21: 1763– 1771. [DOI] [PMC free article] [PubMed] [Google Scholar]
- 21. . Seiler MJ, Aramant RB, Jones MK, Ferguson DL, Bryda EC, Keirstead HS. . A new immunodeficient pigmented retinal degenerate rat strain to study transplantation of human cells without immunosuppression. Graefes Arch Clin Exp Ophthalmol. 2014; 252: 1079– 1092. [DOI] [PMC free article] [PubMed] [Google Scholar]
- 22. . Seiler MJ, Aramant RB, Thomas BB, Peng Q, Sadda SR, Keirstead HS. . Visual restoration and transplant connectivity in degenerate rats implanted with retinal progenitor sheets. Eur J Neurosci. 2010; 31: 508– 520. [DOI] [PMC free article] [PubMed] [Google Scholar]
- 23. . del Cerro M, Ison JR, Bowen GP, Lazar E, del Cerro C. . Intraretinal grafting restores visual function in light-blinded rats. NeuroReport. 1991; 2: 529– 532. [DOI] [PubMed] [Google Scholar]
- 24. . Gouras P, Du J, Gelanze M, Kwun R, Kjeldbye H, Lopez R. . Transplantation of photoreceptors labeled with tritiated thymidine into RCS rats. Invest Ophthalmol Vis Sci. 1991; 32: 1704– 1707. [PubMed] [Google Scholar]
- 25. . Gouras P, Du J, Gelanze M,et al. Survival and synapse formation of transplanted rat rods. J Neural Transplant Plast. 1991; 2: 91– 100. [DOI] [PMC free article] [PubMed] [Google Scholar]
- 26. . Klassen HJ, Ng TF, Kurimoto Y,et al. Multipotent retinal progenitors express developmental markers, differentiate into retinal neurons, and preserve light-mediated behavior. Invest Ophthalmol Vis Sci. 2004; 45: 4167– 4173. [DOI] [PubMed] [Google Scholar]
- 27. . Qiu GT, Seiler MJ, Mui C,et al. Photoreceptor differentiation and integration of retinal progenitor cells transplanted into transgenic rats. Exp Eye Res. 2005; 80: 515– 525. [DOI] [PubMed] [Google Scholar]
- 28. . Seiler MJ, Thomas BB, Chen Z, Wu R, Sadda SR, Aramant RB. . Retinal transplants restore visual responses: trans-synaptic tracing from visually responsive sites labels transplant neurons. Eur J Neurosci. 2008; 28: 208– 220. [DOI] [PubMed] [Google Scholar]
- 29. . Sagdullaev BT, Aramant RB, Seiler MJ, Woch G, McCall MA. . Retinal transplantation-induced recovery of retinotectal visual function in a rodent model of retinitis pigmentosa. Invest Ophthalmol Vis Sci. 2003; 44: 1686– 1695. [DOI] [PubMed] [Google Scholar]
- 30. . Thomas BB, Seiler MJ, Sadda SR, Aramant RB. . Superior colliculus responses to light – preserved by transplantation in a slow degeneration rat model. Exp Eye Res. 2004; 79: 29– 39. [DOI] [PubMed] [Google Scholar]
- 31. . Woch G, Aramant RB, Seiler MJ, Sagdullaev BT, McCall MA. . Retinal transplants restore visually evoked responses in rats with photoreceptor degeneration. Invest Ophthalmol Vis Sci. 2001; 42: 1669– 1676. [PubMed] [Google Scholar]
- 32. . Yang PB, Seiler MJ, Aramant RB,et al. Trophic factors GDNF and BDNF improve function of retinal sheet transplants. Exp Eye Res. 2010; 91: 727– 738. [DOI] [PMC free article] [PubMed] [Google Scholar]
- 33. . Radtke ND, Aramant RB, Petry HM, Green PT, Pidwell DJ, Seiler MJ. . Vision improvement in retinal degeneration patients by implantation of retina together with retinal pigment epithelium. Am J Ophthalmol. 2008; 146: 172– 182. [DOI] [PubMed] [Google Scholar]
- 34. . DiLoreto JD, del Cerro C, del Cerro M. . Cyclosporine treatment promotes survival of human fetal neural retina transplanted to the subretinal space of the light-damaged Fischer 344 rat. Exp Neurol. 1996; 140: 37– 42. [DOI] [PubMed] [Google Scholar]
- 35. . Thliveris JA, Yatscoff RW, Lukowski MP, Copeland KR. . Cyclosporine nephrotoxicity--experimental models. Clin Biochem. 1991; 24: 93– 95. [DOI] [PubMed] [Google Scholar]
- 36. . Cibulskyte D, Kaalund H, Pedersen M,et al. Chronic cyclosporine nephrotoxicity: a pig model. Transplant Proc. 2005; 37: 3298– 3301. [DOI] [PubMed] [Google Scholar]
- 37. . Kisseberth WC, Brettingen NT, Lohse JK, Sandgren EP. . Ubiquitous expression of marker transgenes in mice and rats. Dev Biol. 1999; 214: 128– 138. [DOI] [PubMed] [Google Scholar]
- 38. . Aramant RB, Seiler MJ. . Transplanted sheets of human retina and retinal pigment epithelium develop normally in nude rats. Exp Eye Res. 2002; 75: 115– 125. [DOI] [PubMed] [Google Scholar]
- 39. . Seiler MJ, Aramant RB. . Intact sheets of fetal retina transplanted to restore damaged rat retinas. Invest Ophthalmol Vis Sci. 1998; 39: 2121– 2131. [PubMed] [Google Scholar]
- 40. . Seiler MJ, Thomas BB, Chen Z,et al. BDNF-treated retinal progenitor sheets transplanted to degenerate rats: improved restoration of visual function. Exp Eye Res. 2008; 86: 92– 104. [DOI] [PMC free article] [PubMed] [Google Scholar]
- 41. . Aramant RB, Seiler MJ. . Retinal transplantation--advantages of intact fetal sheets. Prog Retin Eye Res. 2002; 21: 57– 73. [DOI] [PubMed] [Google Scholar]
- 42. . Staurenghi G, Sadda S, Chakravarthy U, Spaide RF; International Nomenclature for Optical Coherence Tomography (IN*OCT) Panel. . Proposed lexicon for anatomic landmarks in normal posterior segment spectral-domain optical coherence tomography: the IN*OCT consensus. Ophthalmology. 2014; 121: 1572– 1578. [DOI] [PubMed] [Google Scholar]
- 43. . Douglas RM, Alam NM, Silver BD, McGill TJ, Tschetter WW, Prusky GT. . Independent visual threshold measurements in the two eyes of freely moving rats and mice using a virtual-reality optokinetic system. Vis Neurosci. 2005; 22: 677– 684. [DOI] [PubMed] [Google Scholar]
- 44. . Prusky GT, Alam NM, Beekman S, Douglas RM. . Rapid quantification of adult and developing mouse spatial vision using a virtual optomotor system. Invest Ophthalmol Vis Sci. 2004; 45: 4611– 4616. [DOI] [PubMed] [Google Scholar]
- 45. . DeMar JC, Hill MI, Gharavi RB,et al. Evaluation of Novel Polyunsaturated Fatty Acid Derived Lipid Mediators of Inflammation to Ameliorate the Deleterious Effects of Blast Overpressure on Eye and Brain Visual Processing Centers in Rats. Takoma, WA: Geneva Foundation; 2013. [Google Scholar]
- 46. . Schmid H, Renner M, Dick HB, Joachim SC. . Loss of inner retinal neurons after retinal ischemia in rats. Invest Ophthalmol Vis Sci. 2014; 55: 2777– 2787. [DOI] [PubMed] [Google Scholar]
- 47. . Siminoff R, Schwassmann HO, Kruger L. . An electrophysiological study of the visual projection to the superior colliculus of the rat. J Comp Neurol. 1966; 127: 435– 444. [DOI] [PubMed] [Google Scholar]
- 48. . Molday RS, MacKenzie D. . Monoclonal antibodies to rhodopsin: characterization, cross-reactivity, and application as structural probes. Biochemistry. 1983; 22: 653– 660. [DOI] [PubMed] [Google Scholar]
- 49. . McGinnis JF, Stepanik PL, Jariangprasert S, Lerious V. . Functional significance of recoverin localization in multiple retina cell types. J Neurosci Res. 1997; 50: 487– 495. [DOI] [PubMed] [Google Scholar]
- 50. . Barnstable CJ, Hofstein R, Akagawa K. . A marker of early amacrine cell development in rat retina. Brain Res. 1985; 352: 286– 290. [DOI] [PubMed] [Google Scholar]
- 51. . Saari JC, Bunt-Milam AH, Bredberg DL, Garwin GG. . Properties and immunocytochemical localization of three retinoid-binding proteins from bovine retina. Vision Res. 1984; 24: 1595– 1603. [DOI] [PubMed] [Google Scholar]
- 52. . Martinez-Navarrete G, Seiler MJ, Aramant RB, Fernandez-Sanchez L, Pinilla I, Cuenca N. . Retinal degeneration in two lines of transgenic S334ter rats. Exp Eye Res. 2011; 92: 227– 237. [DOI] [PMC free article] [PubMed] [Google Scholar]
- 53. . Ray A, Sun GJ, Chan L, Grzywacz NM, Weiland J, Lee EJ. . Morphological alterations in retinal neurons in the S334ter-line3 transgenic rat. Cell Tissue Res. 2010; 339: 481– 491. [DOI] [PubMed] [Google Scholar]
- 54. . An G-J, Asayama N, Humayun MS,et al. Ganglion cell responses to retinal light stimulation in the absence of photoreceptor outer segments from retinal degenerate rodents. Curr Eye Res. 2002; 24: 26– 32. [DOI] [PubMed] [Google Scholar]
- 55. . Thomas BB, Seiler MJ, Aramant RB,et al. Visual functional effects of constant blue light in a retinal degenerate rat model. Photochem Photobiol. 2007; 83: 759– 765. [DOI] [PubMed] [Google Scholar]
- 56. . Thomas BB, Shi D, Khine K, Kim LA, Sadda SR. . Modulatory influence of stimulus parameters on optokinetic head-tracking response. Neurosci Lett. 2010; 479: 92– 96. [DOI] [PMC free article] [PubMed] [Google Scholar]
- 57. . Berglin L, Gouras P, Sheng Y,et al. Tolerance of human fetal retinal pigment epithelium xenografts in monkey retina. Graefes Arch Clin Exp Ophthalmol. 1997; 235: 103– 110. [DOI] [PubMed] [Google Scholar]
- 58. . Warfvinge K, Kiilgaard JF, Klassen H,et al. Retinal progenitor cell xenografts to the pig retina: immunological reactions. Cell Transplant. 2006; 15: 603– 612. [DOI] [PubMed] [Google Scholar]
- 59. . Bull ND, Limb GA, Martin KR. . Human Muller stem cell (MIO-M1) transplantation in a rat model of glaucoma: survival, differentiation, and integration. Invest Ophthalmol Vis Sci. 2008; 49: 3449– 3456. [DOI] [PubMed] [Google Scholar]
- 60. . Ilmarinen T, Hiidenmaa H, Koobi P,et al. Ultrathin polyimide membrane as cell carrier for subretinal transplantation of human embryonic stem cell derived retinal pigment epithelium. PLoS One. 2015; 10: e0143669. [DOI] [PMC free article] [PubMed] [Google Scholar]
- 61. . Seiler MJ, Sagdullaev BT, Woch G, Thomas BB, Aramant RB. . Transsynaptic virus tracing from host brain to subretinal transplants. Eur J Neurosci. 2005; 21: 161– 172. [DOI] [PubMed] [Google Scholar]
- 62. . Aramant RB, Seiler MJ. . Progress in retinal sheet transplantation. Prog Retin Eye Res. 2004; 23: 475– 494. [DOI] [PubMed] [Google Scholar]
- 63. . Seiler MJ, Aramant RB. . Transplantation of neuroblastic progenitor cells as a sheet preserves and restores retinal function. Semin Ophthalmol. 2005; 20: 31– 42. [DOI] [PubMed] [Google Scholar]
- 64. . Hwa JJ, Clandinin TR. . Apical-basal polarity proteins are required cell-type specifically to direct photoreceptor morphogenesis. Curr Biol. 2012; 22: 2319– 2324. [DOI] [PMC free article] [PubMed] [Google Scholar]
- 65. . DiLoreto DA Jr, Martzen MR, del Cerro C, Coleman PD, del Cerro M. . Müller cell changes precede photoreceptor cell degeneration in the age-related retinal degeneration of the Fischer 344 rat. Brain Res. 1995; 698: 1– 14. [DOI] [PubMed] [Google Scholar]
- 66. . Fan W, Lin N, Sheedlo HJ, Turner JE. . Müller and RPE cell response to photoreceptor cell degeneration in aging Fischer rats. Exp Eye Res. 1996; 63: 9– 18. [DOI] [PubMed] [Google Scholar]
- 67. . Roesch K, Stadler MB, Cepko CL. . Gene expression changes within Müller glial cells in retinitis pigmentosa. Mol Vis. 2012; 18: 1197– 1214. [PMC free article] [PubMed] [Google Scholar]
- 68. . Seiler M, Turner JE. . The activities of host and graft glial cells following retinal transplantation into the lesioned adult rat eye: developmental expression of glial markers. Brain Res. 1988; 471: 111– 122. [DOI] [PubMed] [Google Scholar]
- 69. . Lewis GP, Fisher SK. . Up-regulation of glial fibrillary acidic protein in response to retinal injury: its potential role in glial remodeling and a comparison to vimentin expression. Int Rev Cytol. 2003; 230: 263– 290. [DOI] [PubMed] [Google Scholar]
Associated Data
This section collects any data citations, data availability statements, or supplementary materials included in this article.