

Abstract
Objectives
Limited studies have assessed the relationship between longitudinal changes in adiposity and changes in multiple adipokines over time. We examined changes in BMI, total body and trunk fat associated with changes in 16 circulating adipokines in Mexican Americans at risk for type 2 diabetes.
Methods
Participants included 1,213 individuals with cross-sectional data and a subset of 368 individuals with follow-up measures (mean 4.6±1.5 years from baseline). Joint multivariate associations between 3 adiposity measures and 16 adipokines were assessed by canonical correlation analysis.
Results
Longitudinal increases in adiposity were most strongly associated with increasing leptin, CRP and IL-1Ra, and decreasing adiponectin and SFRP5 over time. Participants with BMI ≥ 30 kg/m2 at baseline had greater increases in leptin, CRP, IL-1Ra, and IL-6, and greater decreases in adiponectin and SFRP5, associated with increasing adiposity over follow-up than those with BMI <30 kg/m2. Associations between adiposity and adipokines were most accounted for by leptin; adjustment for leptin greatly reduced the magnitude of all associations between adiposity and remaining adipokines.
Conclusions
Increasing adiposity contributes to a worsening imbalance of pro- and anti-inflammatory adipokines over time, in which leptin may have an important role as a key mediator of metabolic disease risk in Mexican Americans.
Keywords: adipokines, adiposity, obesity, longitudinal, leptin
Introduction
Adipose tissue has long been recognized as an endocrine organ capable of synthesizing and secreting a variety of hormones, collectively referred to as adipokines (1). Adipokines have autocrine and paracrine effects on adipocytes and the surrounding stromal-vascular fraction, in which they modulate adipogenesis, immune cell migration into adipose tissue, and adipocyte metabolism and function (2). In circulation, adipokines also have an endocrine role, regulating biological processes in various target organs and tissues, such as the brain, liver, muscle, vasculature, heart and pancreatic β-cells (2).
Obesity is associated with increased adipose tissue mass and size (3). In response to positive energy balance, pre-adipocytes differentiate into mature adipocytes, promoting hyperplastic expansion of adipose tissue, and mature adipocytes increase in size, becoming hypertrophic (4). Over time, weight gain due to high-fat diet and sedentary lifestyle results in adipose tissue expansion accompanied by inflammation, fibrosis and altered adipokine profile that ultimately lead to obesity-mediated metabolic dysfunction (5).
It is thought that altered secretion of adipokines in obesity is characterized by upregulation of pro-inflammatory and downregulation of anti-inflammatory adipokines. However, much of the evidence for these relationships is derived from analysis of only one or a small number of adipokines, using cross-sectional designs (6, 7). Although longitudinal data from relatively short-term intervention trials are available (8, 9, 10, 11, 12, 13, 14, 15), assessment of long-term changes in adipokines related to changes in adiposity over time is more limited (16, 17, 18), and nearly all longitudinal designs focused on only one or two specific adipokines (8, 9, 10, 11, 12, 13, 14, 15, 18). Moreover, while some cohort studies have examined the association between baseline adipokine levels and risk for type 2 diabetes mellitus (T2DM) or cardiovascular disease (CVD) (19, 20, 21, 22), longitudinal analysis of adipokine changes, particularly in racial/ethnic populations at risk for obesity-associated metabolic disease, are lacking.
The present study examined the effects of longitudinal changes in multiple measures of adiposity on changes in 16 adipokines over time, using multivariate analytical techniques that leverage their underlying correlations, in a large Mexican-American cohort enriched with individuals at high risk for T2DM. As intervention trial data is primarily based on weight or body composition changes among individuals with obesity, we further assessed whether the observed associations between long-term changes in adiposity and adipokine profile varied by baseline obesity status.
Methods
Subject recruitment
Participants of this study were from BetaGene, a family-based study of obesity, insulin resistance, and β-cell dysfunction in Mexican Americans. Details regarding recruitment for the initial cohort have been previously described (23). Briefly, probands qualified for participation if they 1) were of Mexican ancestry (both parents and at least 3/4 of grandparents Mexican or of Mexican descent, 2) had a confirmed diagnosis of gestational diabetes mellitus (GDM) or normal glucose levels (no GDM) during a pregnancy within the 5 years of study enrollment, and 3) had no evidence of β-cell autoimmunity by glutamic acid decarboxylase-65 testing. GDM and non-GDM probands were identified from the patient populations of Los Angeles County/University of Southern California Medical Center, Kaiser Permanente Southern California, and obstetrical/gynecological clinics at local southern California hospitals, and were frequency matched on age, BMI, and parity. Family members of probands were also invited to participate. Protocols for BetaGene were approved by the Institutional Review Boards of each institution, and all participants provided written informed consent prior to study enrollment.
Phenotyping for BetaGene was performed on two separate visits to the General Clinical Research Center, and has also been previously described (23). Participants with fasting glucose less than 126 mg/dL (< 7 mmol/l) obtained at the first visit were invited for a second visit, which included a dual-energy x-ray absorptiometry (DXA) scan for body composition. All GDM probands, their siblings and first cousins, and non-GDM probands (n=1,247; 72% female; mean±SD age, 34.7 ± 8.2 years) underwent the full phenotyping protocol.
A follow-up study was subsequently designed to recall 400 participants for assessment of longitudinal changes in anthropometric and metabolic traits (24). Participants with a fasting glucose level >7.0 mmol/L were ineligible for follow-up testing. A total of 390 indnividuals (74% female; mean±SD age 39.5±8.4 years; mean±SD follow-up time, 4.6±1.5 years) completed follow-up phenotyping. Due to follow-up study eligibility criteria, those who returned for follow-up had slightly lower median fasting and 2-hour glucose levels than those who did not participate (p=0.09 and p=0.04, respectively); no other significant differences between these two groups were observed. We report results from 1,213 cross-sectional and 368 recall study participants for whom complete adipokine data were available.
Assays
Sixteen adipokines were measured in fasting plasma samples. Adiponectin, IL-1β, IL-6, leptin, lipocalin, MCP-1, resistin and TNF-α were assayed using two Millipore multiplex kits with magnetic bead panels (Millipore, Billerica, MA). Assay sensitivity for adiponectin, lipocalin and resistin is 11, 1.7, and 2.2 pg/mL, respectively. Intra- and inter-assay variation are <10% and <15% respectively, and accuracy ranged 87-91% for all adipokines in the panel. Sensitivities for leptin, IL-1β, IL-6, MCP-1 and TNF-α are 4.7, 0.5, 0.4, 1.1 and 0.1 pg/mL, respectively. Intra- and inter-assay variations are <15% and accuracy is >90% for all adipokines in the panel. ELISA was used to measure CRP (Millipore, Billerica, MA), apelin, dipeptidyl peptidase-4 (DPP-IV), IL-18, visfatin (Ray Biotech, Norcross, GA), IL-1Ra (AssayBiotech, Sunnyvale, CA), secreted frizzled protein 4 (SFRP4) and secreted frizzled protein 5 (SFRP5) (USCN Life Science, Wuhan, China). Assay sensitivity for CRP, apelin, DPP-IV, IL-18, visfatin, IL-1Ra, SFRP4 and SFRP5 is: 0.004 ng/mL, 29.1 pg/mL, 14.8 pg/mL, 0.5 pg/mL, 0.78 ng/mL, 23 pg/mL, 26.6 pg/mL and 0.60 ng/mL. Intra- and inter-assay variations are <10% and <15%, respectively, for all adipokines. Accuracy was >95% for most adipokines; accuracy for SFRP4 and SFRP5 ranged 85-95%.
Data analysis
Cohort characteristics are described by median and corresponding 25th and 75th percentiles. Measures of adiposity and adipokines were log-transformed to approximate univariate normality for cross-sectional analyses. The rates of change in adiposity variables and adipokines were computed as the difference between the log of the follow-up value and the log of the baseline value divided by total follow-up time, and were approximately normally distributed. Linear mixed-effects kinship models (LMKM)(25), which appropriately account for relatedness due to family structure, were used to estimate cross-sectional univariate associations between each adiposity phenotype and adipokine, adjusted for age and sex. Similarly, LMKM were used to assess longitudinal association between the rate of change in each adiposity phenotype and rate of change in each adipokine, adjusted for age, sex and baseline body fat, for the subset of participants in the follow-up cohort. To evaluate the strength of univariate association across all adipokines presented in Table 2, data were standardized by dividing each individual value by the cohort standard deviation prior to the LMKM analyses, yielding regression coefficients that are scale independent and directly comparable. To determine whether univariate associations between rates of change in body fat percentage and adipokines significantly varied by baseline obesity status (BMI ≥30 kg/m2 vs. <30 kg/m2), we included a multiplicative interaction term for the product between rate of change in body fat percent and baseline obesity in the LMKMs.
Table 2.
Covariate-adjusted Correlationsa among Cross-sectional (right, upper) and Longitudinal Rate of Change in (left, lower) Adipokine Measures.
| Adiponectin | Apelin | CRP | DPP- IV |
IL-18 | IL-1β | IL-1Ra | IL-6 | Leptin | Lipocalin | MCP-1 | Resistin | SFRP4 | SFRP5 | TNF-α | Visfatin | |
|---|---|---|---|---|---|---|---|---|---|---|---|---|---|---|---|---|
| Adiponectin | −0.023 | −0.181 | −0.082 | −0.031 | 0.013 | −0.196 | −0.114 | −0.228 | 0.111 | −0.047 | 0.019 | −0.193 | 0.785 | −0.025 | −0.110 | |
| Apelin | 0.026 | 0.076 | −0.094 | 0.073 | 0.007 | 0.084 | 0.061 | 0.116 | 0.006 | 0.053 | −0.126 | 0.011 | −0.103 | 0.043 | −0.124 | |
| CRP | −0.103 | 0.130 | −0.077 | 0.115 | −0.028 | 0.251 | 0.325 | 0.392 | 0.207 | 0.075 | 0.140 | 0.251 | −0.167 | 0.161 | −0.040 | |
| DPP-IV | −0.411 | −0.026 | −0.048 | −0.036 | −0.019 | −0.085 | −0.043 | −0.043 | −0.170 | 0.007 | −0.045 | −0.079 | −0.029 | 0.019 | 0.116 | |
| IL-18 | −0.076 | 0.082 | 0.033 | 0.083 | −0.032 | 0.128 | 0.023 | 0.159 | 0.100 | 0.041 | 0.041 | 0.038 | −0.084 | 0.147 | −0.082 | |
| IL-1β | −0.009 | −0.089 | 0.022 | −0.008 | 0.070 | 0.197 | 0.423 | −0.019 | 0.042 | 0.068 | 0.075 | 0.038 | −0.012 | 0.310 | 0.012 | |
| IL-1Ra | 0.062 | 0.242 | 0.270 | −0.236 | 0.136 | 0.149 | 0.323 | 0.297 | 0.206 | 0.135 | 0.125 | 0.207 | −0.207 | 0.270 | −0.091 | |
| IL-6 | −0.184 | −0.052 | 0.286 | 0.072 | 0.127 | 0.484 | 0.141 | 0.224 | 0.130 | 0.167 | 0.083 | 0.154 | −0.146 | 0.441 | 0.003 | |
| Leptin | −0.035 | 0.146 | 0.187 | −0.133 | 0.078 | 0.059 | 0.247 | 0.118 | 0.091 | 0.228 | 0.089 | 0.217 | −0.235 | 0.181 | −0.061 | |
| Lipocalin | 0.416 | 0.309 | 0.163 | −0.368 | 0.083 | 0.022 | 0.316 | −0.079 | 0.214 | −0.003 | 0.530 | 0.142 | −0.011 | 0.143 | −0.176 | |
| MCP-1 | 0.066 | 0.002 | 0.006 | −0.042 | 0.258 | 0.050 | 0.125 | 0.002 | 0.263 | 0.066 | −0.020 | 0.070 | −0.041 | 0.267 | 0.036 | |
| Resistin | 0.303 | 0.114 | 0.181 | −0.181 | −0.043 | 0.005 | 0.113 | −0.033 | 0.080 | 0.581 | −0.020 | 0.128 | −0.047 | 0.125 | 0.020 | |
| SFRP4 | −0.165 | −0.149 | 0.069 | −0.038 | −0.127 | 0.042 | 0.035 | 0.066 | −0.072 | −0.115 | 0.007 | −0.023 | −0.204 | 0.081 | 0.067 | |
| SFRP5 | 0.563 | −0.164 | −0.167 | −0.166 | −0.115 | 0.008 | −0.153 | −0.157 | −0.178 | −0.017 | 0.058 | −0.030 | −0.056 | −0.062 | 0.016 | |
| TNF-α | 0.053 | 0.037 | 0.226 | −0.048 | 0.253 | 0.335 | 0.167 | 0.327 | 0.079 | 0.159 | 0.276 | 0.163 | 0.084 | 0.028 | 0.038 | |
| Visfatin | −0.315 | −0.298 | −0.095 | 0.422 | 0.025 | −0.072 | −0.294 | 0.070 | −0.157 | −0.494 | 0.022 | −0.169 | −0.002 | −0.034 | −0.024 |
Values shown are Pearson correlations (p-value); bold are significant at p<0.05. Cross-sectional correlations (n=1,203) are adjusted for age and sex; longitudinal correlations (n=366) are adjusted for age, sex and baseline body fat percentage.
To assess the joint multivariate association between 3 adiposity measures and 16 adipokines, we performed canonical correlation analysis (CCA). CCA is a multivariate analysis of cross-correlations among two set of continuous variables, where each set contains multiple variables that are themselves highly correlated. CCA identifies linear combinations of each set that maximize the correlations between them; a loading coefficient is estimated for each variable that represents its contribution to its specific set(26, 27). To properly account for family structure, we performed CCA on the kinship-adjusted covariance of age-and sex-adjusted cross-sectional phenotypes, and on age-, sex- and baseline body fat-adjusted rates of change for longitudinal phenotypes. CCA was also repeated for the longitudinal cohort, stratified by baseline obesity status. Given the large contribution of leptin to the adipokines component that was observed in all models, we also examined the residual multivariate association between adiposity traits and remaining adipokines by additionally adjusting phenotypes for baseline leptin (cross-sectional analyses) or rate of change in leptin (longitudinal analyses), and re-estimating the CCA models. All analyses were performed using R v.3.3.0 (28).
Results
Among the participants of the baseline BetaGene cohort (n=1,213; 357 probands, 565 siblings, 291 first cousins), 72% were female, and median (IQR) age was 34.4 (10.3) years (Table 1). Most (78%) were overweight or obese; median (IQR) BMI was 28.7 (7.3) kg/m2 and body fat percentage was 35.8 (11.9). Median level of CRP was indicative of moderate cardiovascular disease risk, and 26% exceeded the threshold for high risk (29, 30), both of which are consistent with CRP levels in the US adult population (30). Baseline demographics and anthropometrics for participants of the follow-up study (n=368; 107 probands, 181 siblings, 80 first cousins) were generally similar to those of the initial cohort.
Table 1.
Cohort Characteristicsa
| Baseline Cohort n=1,213 |
Follow-up Subgroup n=368 |
||
|---|---|---|---|
|
| |||
| Baseline | Change per year | ||
|
|
|||
| Female (%) | 874 (72.1) | 272 (73.5) | |
| Age, years | 34.4 (29.2, 39.5) | 34.7 (29.3, 40.4) | |
| Anthropometrics | |||
| BMI [kg/m2] | 28.7 (25.4, 32.7) | 28.7 (25.2, 32.8) | 0.2 (−0.1, 0.4) b |
| Normal weight (%) | 261 (21.5) | 84 (22.7) | |
| Overweight (%) | 459 (37.8) | 136 (36.8) | |
| Obese (%) | 493 (40.6) | 150 (40.5) | |
| Body Fat Percentage | 35.8 (28.6, 40.5) | 36.2 (28.5, 40.3) | 0.1 (−0.2, 0.5)b |
| Trunk Fat [kg] | 12.9 (9.7, 17.1) | 12.7 (9.8, 17.0) | 0.2 (−0.1, 0.5)b |
| Adipokines | |||
| Adiponectin [μg/mL] | 10.4 (7.2, 16.8) | 9.2 (6.2, 14.5) | 0.0 (−0.5, 0.4) |
| Apelin [ng/mL] | 1.1 (0.7, 1.7) | 0.9 (0.5, 1.4) | −0.1 (−0.1, 0.0)b |
| CRP [ng/mL] | 1.4 (0.6, 3.2) | 1.3 (0.6, 3.4) | 0.0 (−0.1, 0.2)b |
| DPP-IV [pg/mL] | 264.9 (210.3, 339.9) | 294.6 (222.5, 374.6) | −4.0 (−15.6, 5.5)b |
| IL-18 [pg/mL] | 177.4 (67.7, 301.2) | 126.6 (15.7, 301.2) | 0.0 (−27.2, 9.9)b |
| IL-1β [pg/mL] | 0.6 (0.5, 0.9) | 0.7 (0.6, 1.0) | 0.0 (0.0, 0.0) |
| IL-1Ra [pg/mL] | 11.5 (6.9, 18.5) | 12.7 (7.7, 19.2) | −0.2 (−1.1, 0.7)b |
| IL-6 [pg/mL] | 2.9 (1.7, 5.1) | 3.0 (1.8, 5.3) | 0.1 (−0.2, 0.4)b |
| Leptin [ng/mL] | 14.1 (6.6, 24.9) | 14.0 (6.7, 26.0) | 0.1 (−0.7, 0.9) |
| Lipocalin [ng/mL] | 63.2 (52.4, 76.6) | 62.1 (50.7, 76.7) | −2.5 (−5.7, 0.2)b |
| MCP-1 [pg/mL] | 107.6 (84.6, 132.7) | 110.7 (89.9, 138.6) | 3.0 (−2.3, 8.3)b |
| Resistin [ng/mL] | 18.0 (14.3, 23.6) | 19.4 (15.0, 27.4) | −0.2 (−0.8, 0.5)b |
| SFRP4 [ng/mL] | 76.1 (54.2, 107.7) | 90.5 (61.9, 126.1) | 2.3 (−0.9, 6.1)b |
| SFRP5 [ng/mL] | 14.6 (9.3, 22.5) | 13.9 (8.4, 20.9) | 0.4 (−0.2, 1.3)b |
| TNF-α [pg/mL] | 2.9 (2.1, 4.0) | 3.3 (2.5, 4.5) | 0.0 (−0.2, 0.1) |
| Visfatin [ng/mL] | 13.8 (10.6, 17.9) | 15.7 (12.1, 22.5) | 0.1 (−1.0, 1.7) |
values shown are median (25th, 75th percentile), unless otherwise noted
Significant at p<0.05 by Wilcoxon signed rank Test
The covariate-adjusted correlations among 16 adipokines are provided in Table 2. Among cross-sectional measures, leptin was moderately correlated with CRP (ρ=0.39), IL-1Ra (ρ=0.30), MCP-1 (ρ=0.23), adiponectin (ρ=−0.23) and IL-6 (ρ=0.22), while adiponectin was strongly correlated with SFRP5 (ρ=0.79) and weakly correlated with all other adipokines except leptin. Longitudinal rate of change in leptin was modestly correlated with rates of change in MCP-1 (ρ=0.26), IL-1Ra (ρ=0.25), but shared only weak or no correlation with most other adipokine changes over time. The rate of change in adiponectin was most strongly correlated with the rate of change in SFRP5 (ρ=0.56), and was not correlated with rate of change in leptin (ρ=−0.04). Pairwise adipokine correlations were similar when stratified by baseline obesity status, although correlations between cross-sectional leptin and CRP, IL-1Ra, IL-6 and TNF-α were slightly stronger among participants with obesity compared to without obesity (Table S1 and Table S2: right, upper section). Correlations between longitudinal changes in leptin and CRP, IL-1Ra, IL-6, TNF-α, adiponectin and SFRP5 were also appreciably stronger for individuals with obesity than without obesity (Table S1 and Table S2: left, lower section).
In univariate analyses of cross-sectional phenotypes, we observed higher BMI significantly associated with lower adiponectin (β=−0.33) and SFRP5 (β=−0.30), and higher apelin (β=0.13), CRP (β=0.48), IL-18 (β=0.14), IL-1Ra (β=0.40), IL-6 (β=0.30), leptin (β=0.61), lipocalin (β=0.10), MCP-1 (β=0.15), resistin (β=0.10), SFRP4 (β=0.30), and TNF-α (β=0.13) (Table 3). No associations between BMI and DPP-IV, IL-1β or visfatin were observed. Results were similar for DXA-measured total body fat percentage and trunk fat. Of the 13 adipokines significantly associated with baseline adiposity, we observed longitudinally increasing BMI significantly associated with rates of change in 7 adipokines: decreasing adiponectin (β=−0.36) and SFRP5 (β=−0.37), and increasing CRP (β=0.29), IL-1Ra (β=0.18), IL-6 (β=0.14), leptin (β=0.62), and SFRP4 (β=0.10). Increasing body fat percentage and trunk fat were similarly associated with these changes in adipokines over time, although longitudinal increases in both total body and trunk fat were also significantly or marginally associated with increasing apelin (β=0.13 and β=0.15, respectively), lipocalin (β=0.14 and β=0.11, respectively), and visfatin (β=−0.12 and β=−0.09, respectively).
Table 3.
Standardized Regression Coefficients (p-values) from Univariate Models assessing Cross-sectionala and Longitudinalb Associations between Adiposity Traits and Adipokines
| Adiponectin | Apelin | CRP | DPP-IV | IL-18 | IL-1β | IL-1Ra | IL-6 | Leptin | Lipocalin | MCP-1 | Resistin | SFRP4 | SFRP5 | TNF-α | Visfatin | |
|---|---|---|---|---|---|---|---|---|---|---|---|---|---|---|---|---|
| BMI | ||||||||||||||||
| Cross-sectional | −0.327 (<0.001) |
0.126 (0.005) |
0.483 (<0.001) |
0.001 (0.98) |
0.139 (<0.001) |
−0.018 (0.55) |
0.401 (<0.001) |
0.299 (<0.001) |
0.605 (<0.001) |
0.102 (<0.001) |
0.146 (<0.001) |
0.098 (0.001) |
0.302 (<0.001) |
−0.296 (<0.001) |
0.129 (<0.001) |
−0.025 (0.40) |
| Longitudinal | −0.360 (<0.001) |
0.035 (0.51) |
0.292 (<0.001) |
0.036 (0.49) |
0.086 (0.11) |
−0.004 (0.94) |
0.184 (<0.001) |
0.144 (0.006) |
0.615 (<0.001) |
0.001 (0.99) |
0.058 (0.28) |
0.036 (0.50) |
0.104 (0.048) |
−0.372 (<0.001) |
0.058 (0.28) |
0.015 (0.77) |
| Body Fat Percentage | ||||||||||||||||
| Cross-sectional | −0.301 (<0.001) |
0.171 (<0.001) |
0.565 (<0.001) |
−0.063 (0.15) |
0.167 (<0.001) |
−0.005 (0.92) |
0.472 (<0.001) |
0.356 (<0.001) |
0.888 (<0.001) |
0.133 (0.002) |
0.168 (<0.001) |
0.149 (0.001) |
0.333 (<0.001) |
−0.282 (<0.001) |
0.181 (<0.001) |
−0.071 (0.10) |
| Longitudinal | −0.259 (<0.001) |
0.127 (0.023) |
0.281 (<0.001) |
−0.038 (0.50) |
0.012 (0.84) |
−0.042 (0.45) |
0.318 (<0.001) |
0.111 (0.046) |
0.569 (<0.001) |
0.141 (0.012) |
0.093 (0.10) |
0.109 (0.052) |
0.110 (0.046) |
−0.287 (<0.001) |
−0.002 (0.98) |
−0.121 (0.025) |
| Trunk Fat | ||||||||||||||||
| Cross-sectional | −0.348 (<0.001) |
0.144 (<0.001) |
0.472 (<0.001) |
−0.029 (0.36) |
0.136 (<0.001) |
−0.014 (0.64) |
0.419 (<0.001) |
0.289 (<0.001) |
0.649 (<0.001) |
0.118 (0.001) |
0.134 (<0.001) |
0.115 (<0.001) |
0.278 (<0.001) |
−0.308 (<0.001) |
0.143 (<0.001) |
−0.053 (0.09) |
| Longitudinal | −0.312 (<0.001) |
0.152 (0.007) |
0.312 (<0.001) |
−0.015 (0.79) |
0.019 (0.74) |
−0.022 (0.70) |
0.313 (<0.001) |
0.124 (0.027) |
0.652 (<0.001) |
0.108 (0.058) |
0.103 (0.07) |
0.074 (0.19) |
0.116 (0.038) |
−0.375 (<0.001) |
0.005 (0.94) |
−0.092 (0.09) |
Significant associations (p<0.05) are denoted in bold font
Adjusted for age and sex
Adjusted for age, sex and baseline body fat percentage.
Multivariate analysis with CCA revealed that the observed cross-sectional univariate associations were well captured by the top canonical variate, which explained 82.6% of the shared variation between the 3 adiposity variables and 16 adipokines (canonical correlation = 0.81, p<0.0001; Figure 1a). The top adiposity component was well represented by BMI, total body fat and trunk fat (canonical loadings ρ=0.92 to 0.98), while the adipokine component was most represented by leptin (ρ=0.94), CRP (ρ=0.51), IL-1Ra (ρ=0.43), adiponectin (ρ=−0.43), SFRP4 (ρ=0.34), IL-6 (ρ=0.31), and SFRP5 (ρ=−0.28). The joint multivariate association between adiposity and adipokines was most accounted for by leptin, followed by CRP, IL-1Ra, and adiponectin. Greater adiposity was most associated with higher leptin, CRP, and IL-1Ra, and lower adiponectin.
Figure 1.
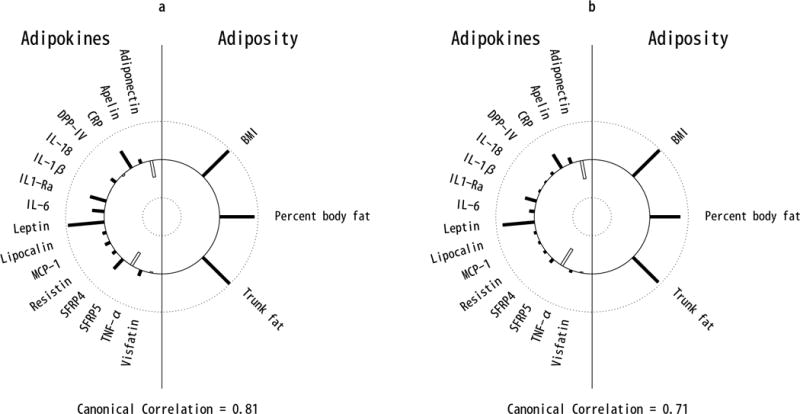
Helioplot of the top canonical correlations demonstrating the joint multivariate association between adipokines (left) and adiposity (right), for cross-sectional (a) and longitudinal (b) cohorts. The plot represents the canonical loadings, which are analogus to the linear correlation coefficients between adipokines (left) and the first canonical variate, and adiposity and the first canonical variate (right). The length of each bar represents the strength of these correlations ranging from 1 (outer circle) to −1 (inner circle). Filled bars represent positive and open bars represent negative correlations. Plot (a) indicates that cross-sectional BMI, percent body fat and trunk fat are all strongly positively correlated with the first canonical variate, and that CRP, IL-1Ra, IL-6, leptin and SFRP4 are strongly positively correlated while adiponectin and SFRP5 are strongly negatively correlated with the first canonical variate. Plot (b) indicates that longitudinal changes in BMI, percent body fat and trunk fat are all strongly positively correlated with the first canonical variate, and that CRP, IL-1Ra, and leptin are strongly positively correlated while adiponectin and SFRP5 are strongly negatively correlated with the first canonical variate.
Similarly, the top canonical variate of the longitudinal analysis explained 78.7% of the shared variation between rates of change in adiposity and adipokines (canonical correlation = 0.71, p<0.0001; Figure 1b). The top adiposity component was well-captured by rates of change in the 3 adiposity measures (ρ=0.81 to 0.97), and the adipokine component was most represented by rates of change in leptin (ρ=0.79), adiponectin (ρ=−0.50), SFRP5 (ρ=−0.44), CRP (ρ=0.43), and IL-1Ra (ρ=0.32). Multivariate association between changes in adiposity and adipokines over time was most accounted for by changes in leptin, followed by adiponectin, CRP, SFRP5 and IL-1Ra. Longitudinal increases in adiposity were associated with increases in in leptin, CRP, and IL-1Ra, and decreases in adiponectin and SFRP5 over time. Analysis of leptin-adjusted adipokines and adiposity measures confirmed the strong contribution of leptin to the multivariate association between adipokines and adiposity. After adjusting for leptin, the canonical correlation from CCA analysis in the cross-sectional and longitudinal cohorts fell from 0.81 and 0.71 to 0.49 and 0.53, respectively.
As shown in Table 1, ~40% of follow-up study participants had obesity at baseline. During follow-up, 62% increased body fat (77%, 63% and 53% of those who were normal weight, overweight, and obese at baseline, respectively). Over time, the median (IQR) rate of change in body fat percentage for normal weight, overweight and participant with obesity was 0.34 (0.03, 0.66), 0.13 (−0.20, 0.47) and 0.07 (−0.42, 0.43) per year, respectively (p<0.001). Trend for weight gain, overall and within each baseline weight status group, was similar to that for increasing body fat over time. Given the large proportion of participants who had obesity at the beginning of the study and the variation in changes in weight and body fat observed by baseline BMI, we examined the univariate and multivariate association between longitudinal changes in adipokines and adiposity, stratified by baseline obesity status.
Univariate association between rate of change in body fat percentage and rate of change in CRP, IL-6, adiponectin and SFRP5, significantly varied by baseline obesity status (all interaction p<0.035; Figure 2). Interaction between rate of change in body fat percentage and obesity status were marginally associated with rate of change in leptin and IL-1Ra (interaction p=0.10 and 0.12, respectively; Figure 2). Increases in leptin, CRP, IL-1Ra, and IL-6 and decreases in adiponectin and SFRP5 associated with increasing body fat percentage over time were greater for participants with obesity than without obesity at baseline. The univariate longitudinal associations between each adiposity measure and each adipokine are presented in Table S3 (participants with obesity) and Table 4 (participants without obesity). Results of the multivariate CCA analysis also indicate that the joint associations between changes in all adiposity measures and adipokines were substantially different for individuals who had obesity (Figure 3a) compared to those who did not have obesity at baseline (Figure 3b). In both groups, the top adiposity component was well characterized by rates of change in the 3 adiposity measures (obesity: ρ=0.90 to 1.0; no-obesity: ρ=0.81 to 0.95), although slightly less so among no-obesity due to the greater variation in body composition changes in that group over time (median (IQR) rate of change in body fat percentage for no-obesity: 0.19 (−0.12, 0.55) per year). The first adipokine component among individuals with obesity was most represented by rates of change in 7 adipokines: increasing leptin (ρ=0.88), CRP (ρ=0.70), IL-1Ra (ρ=0.57), IL-6 (ρ=0.34) and apelin (ρ=0.30), and decreasing adiponectin (ρ=−0.61) and SFRP5 (ρ=−0.37). However, the top adipokine component among subjects without obesity was represented mainly by rates of change in only 3 adipokines: increasing leptin (ρ=0.76) and decreasing SFRP5 (ρ=−0.44) and adiponectin (ρ=−0.31), with weak contributions by all other adipokines (all ρ<0.12). As observed among all participants in the cross-sectional and longitudinal samples, change in leptin most strongly contributed to the multivariate association between rates of change in adipokines and adiposity; after adjustment for leptin, canonical correlation from CCA in obesity and non-obesity groups fell from 0.87 and 0.62 to 0.64 and 0.46, respectively.
Figure 2.
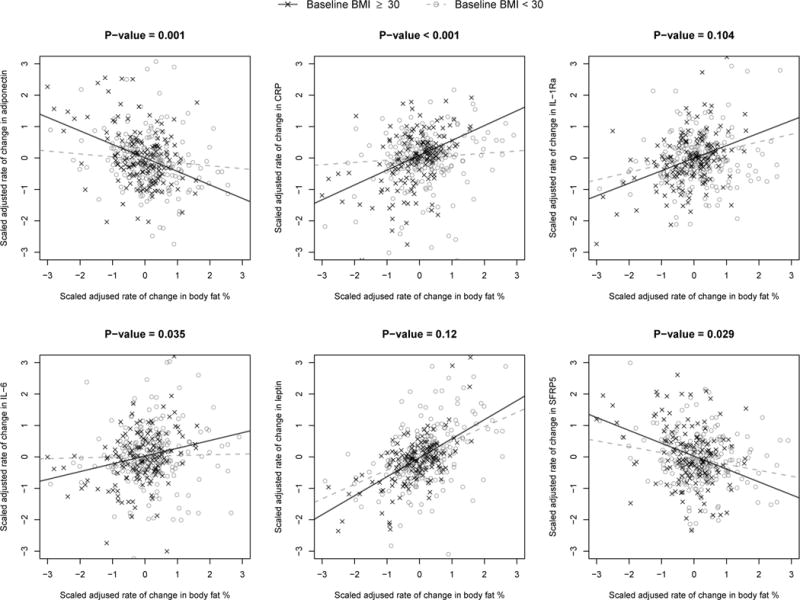
Rate of change in adipokines (y-axis) associated with rate of change in body fat percentage (x-axis), adjusted for age, sex, and kinship. Solid regression line indicates participants who were obese at baseline (BMI ≥30 kg/m2). Dashed regression line indicate non-obese participants (BMI <30 kg/m2). P-value shown represents the interaction p-value testing for a difference in slope between obese and non-obese participants.
Figure 3.
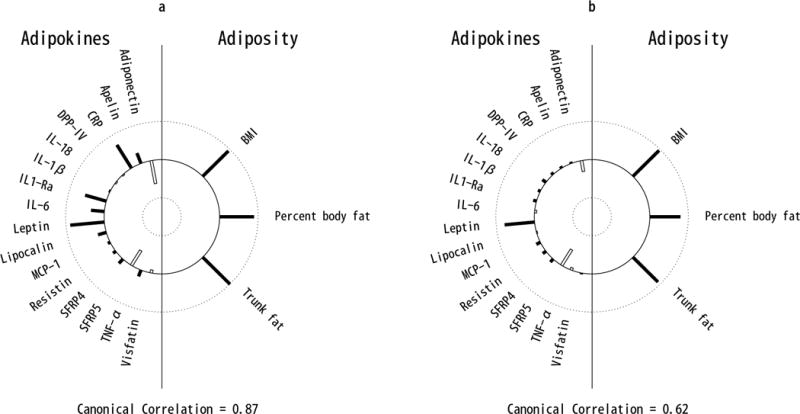
Helioplot of the top canonical correlations demonstrating the joint multivariate association between rates of change in adipokines (left) and rates of change in adiposity (right), stratified by baseline obesity status: obese (a) and non-obese (b). The plot represents the canonical loadings, which are analogus to the linear correlation coefficients between adipokines (left) and the first canonical variate, and adiposity and the first canonical variate (right). The length of each bar represents the strength of these correlations ranging from 1 (outer circle) to −1 (inner circle). Filled bars represent positive and open bars represent negative correlations. Plot (a) indicates that cross- sectional BMI, percent body fat and trunk fat are all strongly positively correlated with the first canonical variate, and that CRP, IL-1Ra, IL-6, and leptin are strongly positively correlated while adiponectin and SFRP5 are strongly negatively correlated with the first canonical variate. Plot (b) indicates that longitudinal changes in BMI, percent body fat and trunk fat are all strongly positively correlated with the first canonical variate, and that leptin is strongly positively correlated while adiponectin and SFRP5 are strongly negatively correlated with the first canonical variate.
Discussion
In this large Mexican-American cohort of primarily overweight and obese individuals at risk for T2DM, multivariate analyses of longitudinal changes in 3 adiposity measures and 16 circulating adipokines revealed that increases in adiposity were most strongly associated with increasing leptin, followed by decreasing adiponectin and SFRP5, and increasing CRP and IL- 1Ra over time. Leptin, CRP, IL-1Ra and adiponectin were also most strongly associated with adiposity measures in the cross-sectional multivariate analysis. We also observed that increasing adiposity in individuals with existing obesity was more strongly associated with a multitude of increasing pro- and decreasing anti-inflammatory adipokines than in those without obesity, supporting the notion that adipokine imbalance continues to worsen with growing obesity over time. Furthermore, multivariate cross-sectional and longitudinal associations between adipokines and adiposity were greatly attenuated after adjustment for leptin, indicating an important role for leptin in the modulation of adipokines and their changes over time in response to increasing obesity.
Since its discovery more than 20 years ago (31), leptin has been shown to be an important regulator of food intake and energy expenditure. Early hypotheses suggested that leptin deficiency was associated with obesity, although subsequent studies demonstrated that the majority of individuals with obesity had markedly increased plasma leptin concentrations, reflecting adipose tissue expansion (32, 33). It was later demonstrated that excess circulating leptin results in resistance to its action (33, 34), and upregulation of the pro-inflammatory cytokines CRP, TNF-α, and IL-6 (35, 36), which in turn downregulate expression of anti- inflammatory adiponectin (37). Indeed, our results support the hypothesis that obesity fosters a pro-inflammatory state, characterized by increased leptin, CRP and IL-6 and decreased adiponectin. Interestingly, although IL-1Ra is an IL-1 antagonist with anti-inflammatory features, we observed increased IL-1Ra with increasing adiposity. We also observed positive cross-sectional and longitudinal correlations between leptin and IL-1Ra (ρ=0.30 and 0.25, respectively). Both findings are supported by a prior gastric bypass study in which investigators proposed that higher IL-1Ra levels in patients with obesity contribute to leptin resistance, thereby reinforcing a vicious cycle of progressive obesity and resistance to leptin (11).
In addition, we found SFRP5, a more recently identified adipokine with anti-inflammatory properties (38), to be negatively associated with adiposity at a magnitude similar to adiponectin in both cross-sectional and longitudinal analyses. Consistent with these findings, the two small, short-term diet/lifestyle intervention studies that have examined changes in SFRP5 in humans reported increases in SFRP5 associated with weight loss, increasing adiponectin, and decreasing leptin:adiponectin ratio (14, 15). However, neither study examined additional adipokines for assessment of their pattern of changes over time. Our findings indicate that SFRP5 shares a moderate to strong correlation with adiponectin (ρ=0.79 and 0.56 for cross- sectional and longitudinal, respectively), and modest negative correlation with leptin, SFRP4, IL- 1Ra, IL-6 and CRP (cross-sectional and longitudinal ρ= −0.15 to −0.24). Although the precise mechanism underlying decreasing SFRP5 with increasing obesity over time remains to be elucidated, it has been shown that SFRP5 is an inhibitor of Wnt5a, a molecule expressed in adipose tissue with an important role in inflammatory macrophage activation and signaling (38). SFRP1, another secreted frizzled-related protein inhibitor of Wnt5a, has been shown to increase adiponectin and reduce IL-6 and MCP-1 expression in adipocytes (39). Further investigation is needed to determine the specific role of SFRP5 in modulating pro- and anti-inflammatory adipokine imbalance in the presence of obesity and rising leptin levels.
While our study provides important insight into the long-term changes in multiple pro- and anti-inflammatory adipokines that result from changes in adiposity over time, and indicates a key role for leptin in this process, there are adipokines and cytokines that were not measured and therefore not accounted for in this analysis. As such, it is possible that other meaningful adipokine changes are not represented. Likewise, DEXA provides a direct measure of overall and region-specific body fat (ie. trunk, limbs, head), but not of omental and subcutaneous fat, which precluded our assessment of adipokine relationships with these specific compartments. Although our study is based on a large cohort of Mexican Americans at risk for T2DM, enabling analysis of both cross-sectional and longitudinal associations, our follow-up subset was modest in size. As such, we may have been able to detect cross-sectional relationships but had limited power for detecting longitudinal associations with the same adipokine(s) in univariate analyses. Nevertheless, as many of the adipokines interact in complex pathways, analysis of only individual adiposity-adipokine relationships does not provide insight into their relative importance or interpretation. We applied CCA to capture the underlying multivariate correlation among adipokines and adiposity in order to better understand their joint relationships. This approach led us to the observation that across a wide array of adipokines, longitudinal changes in leptin most strongly account for the relationship between changes in adiposity and adipokine levels, irrespective of baseline obesity status.
In conclusion, our findings suggest that increasing adiposity contributes to a growing imbalance in pro- and anti-inflammatory adipokines over time, in which leptin may have a particularly important role. Further investigation is necessary to better understand the extent to which these adipokines, with leptin as a key driver, directly and/or indirectly influence insulin sensitivity and β-cell function, thereby mediating metabolic disease risk in Mexican Americans.
Supplementary Material
What’s known on This Subject?
Higher pro-inflammatory and lower anti-inflammatory adipokines have been shown to be associated with obesity, but these data are often limited to cross-sectional relationships, and/or only one or a small number of measured adipokines.
What does this Study Add?
This study examines the joint multivariate association between longitudinal changes in 16 circulating adipokines and changes in adiposity over time in Mexican Americans at high risk for type 2 diabetes.
Our findings suggest that 1) longitudinal increases in adiposity were most strongly associated with increasing leptin, CRP and IL-1Ra, and decreasing adiponectin and SFRP5 over time, 2) these associations were stronger for participants with obesity than without obesity at baseline, and 3) these associations were most accounted for by changes in leptin.
Acknowledgments
The authors thank the families who participated in the BetaGene Study and also acknowledge the efforts of our recruiting and technical staff.
Funding: This work was supported by grant R01-DK-100302 and R01-DK-061628 from the National Institute of Diabetes and Digestive and Kidney Diseases (NIDDK), National Institutes of Health (NIH).
Footnotes
Disclosure: The authors have no potential conflicts of interest relevant to this article.
Author Contributions:
M.H.B., Y.H.S., C.K., T.A.B., R.M.W. and A.H.X. designed research; M.H.B., Y.H.S., J.W., C.K., A.M.K., R.M.W., T.A.B. and H.X. conducted research; R.M.W., T.A.B., and A.M.K. provided samples and databases; M.H.B., Y.H.S., J.W. and A.H.X. analyzed data or performed statistical analysis; M.H.B., Y.H.S., J.W., C.K., A.M.K, R.M.W., T.A.B., A.H.X. wrote paper; M.H.B., Y.H.S. and A.H.X. had primary responsibility for final content. All authors read and approved the final manuscript.
References
- 1.Kershaw EE, Flier JS. Adipose tissue as an endocrine organ. The Journal of clinical endocrinology and metabolism. 2004;89:2548–2556. doi: 10.1210/jc.2004-0395. [DOI] [PubMed] [Google Scholar]
- 2.Bluher M. Adipose tissue dysfunction in obesity. Experimental and clinical endocrinology & diabetes: official journal, German Society of Endocrinology [and] German Diabetes Association. 2009;117:241–250. doi: 10.1055/s-0029-1192044. [DOI] [PubMed] [Google Scholar]
- 3.Spalding KL, Arner E, Westermark PO, Bernard S, Buchholz BA, Bergmann O, et al. Dynamics of fat cell turnover in humans. Nature. 2008;453:783–787. doi: 10.1038/nature06902. [DOI] [PubMed] [Google Scholar]
- 4.Gray SL, Vidal-Puig AJ. Adipose tissue expandability in the maintenance of metabolic homeostasis. Nutrition reviews. 2007;65:S7–12. doi: 10.1111/j.1753-4887.2007.tb00331.x. [DOI] [PubMed] [Google Scholar]
- 5.Rodriguez A, Ezquerro S, Mendez-Gimenez L, Becerril S, Fruhbeck G. Revisiting the adipocyte: a model for integration of cytokine signaling in the regulation of energy metabolism. American journal of physiology Endocrinology and metabolism. 2015;309:E691–714. doi: 10.1152/ajpendo.00297.2015. [DOI] [PubMed] [Google Scholar]
- 6.Ruhl CE, Everhart JE. Leptin concentrations in the United States: relations with demographic and anthropometric measures. The American journal of clinical nutrition. 2001;74:295–301. doi: 10.1093/ajcn/74.3.295. [DOI] [PubMed] [Google Scholar]
- 7.Morimoto Y, Conroy SM, Ollberding NJ, Kim Y, Lim U, Cooney RV, et al. Ethnic differences in serum adipokine and C-reactive protein levels: the multiethnic cohort. International journal of obesity (2005) 2014;38:1416–1422. doi: 10.1038/ijo.2014.25. [DOI] [PMC free article] [PubMed] [Google Scholar]
- 8.Chang HM, Lee HJ, Park HS, Kang JH, Kim KS, Song YS, et al. Effects of weight reduction on serum vaspin concentrations in obese subjects: modification by insulin resistance. Obesity (Silver Spring, Md) 2010;18:2105–2110. doi: 10.1038/oby.2010.60. [DOI] [PubMed] [Google Scholar]
- 9.Mather KJ, Funahashi T, Matsuzawa Y, Edelstein S, Bray GA, Kahn SE, et al. Adiponectin, change in adiponectin, and progression to diabetes in the Diabetes Prevention Program. Diabetes. 2008;57:980–986. doi: 10.2337/db07-1419. [DOI] [PMC free article] [PubMed] [Google Scholar]
- 10.Zhang C, Luo H, Gao F, Zhang CT, Zhang R. A reduction in both visceral and subcutaneous fats contributes to increased adiponectin by lifestyle intervention in the Diabetes Prevention Program. Acta diabetologica. 2015;52:625–628. doi: 10.1007/s00592-014-0655-2. [DOI] [PubMed] [Google Scholar]
- 11.Meier CA, Bobbioni E, Gabay C, Assimacopoulos-Jeannet F, Golay A, Dayer JM. IL-1 receptor antagonist serum levels are increased in human obesity: a possible link to the resistance to leptin? The Journal of clinical endocrinology and metabolism. 2002;87:1184–1188. doi: 10.1210/jcem.87.3.8351. [DOI] [PubMed] [Google Scholar]
- 12.Wang X, You T, Murphy K, Lyles MF, Nicklas BJ. Addition of Exercise Increases Plasma Adiponectin and Release from Adipose Tissue. Medicine and science in sports and exercise. 2015;47:2450–2455. doi: 10.1249/MSS.0000000000000670. [DOI] [PMC free article] [PubMed] [Google Scholar]
- 13.Ruth MR, Port AM, Shah M, Bourland AC, Istfan NW, Nelson KP, et al. Consuming a hypocaloric high fat low carbohydrate diet for 12 weeks lowers C-reactive protein, and raises serum adiponectin and high density lipoprotein-cholesterol in obese subjects. Metabolism: clinical and experimental. 2013;62:1779–1787. doi: 10.1016/j.metabol.2013.07.006. [DOI] [PMC free article] [PubMed] [Google Scholar]
- 14.Schulte DM, Muller N, Neumann K, Oberhauser F, Faust M, Gudelhofer H, et al. Pro-inflammatory wnt5a and anti-inflammatory sFRP5 are differentially regulated by nutritional factors in obese human subjects. PloS one. 2012;7:e32437. doi: 10.1371/journal.pone.0032437. [DOI] [PMC free article] [PubMed] [Google Scholar]
- 15.Tan X, Wang X, Chu H, Liu H, Yi X, Xiao Y. SFRP5 correlates with obesity and metabolic syndrome and increases after weight loss in children. Clinical endocrinology. 2014;81:363–369. doi: 10.1111/cen.12361. [DOI] [PubMed] [Google Scholar]
- 16.Bluher M, Rudich A, Kloting N, Golan R, Henkin Y, Rubin E, et al. Two patterns of adipokine and other biomarker dynamics in a long-term weight loss intervention. Diabetes care. 2012;35:342–349. doi: 10.2337/dc11-1267. [DOI] [PMC free article] [PubMed] [Google Scholar]
- 17.Sumithran P, Prendergast LA, Delbridge E, Purcell K, Shulkes A, Kriketos A, et al. Long-term persistence of hormonal adaptations to weight loss. The New England journal of medicine. 2011;365:1597–1604. doi: 10.1056/NEJMoa1105816. [DOI] [PubMed] [Google Scholar]
- 18.Fransson EI, Batty GD, Tabak AG, Brunner EJ, Kumari M, Shipley MJ, et al. Association between change in body composition and change in inflammatory markers: an 11-year follow-up in the Whitehall II Study. The Journal of clinical endocrinology and metabolism. 2010;95:5370–5374. doi: 10.1210/jc.2010-0730. [DOI] [PMC free article] [PubMed] [Google Scholar]
- 19.Lee CC, Lorenzo C, Haffner SM, Wagenknecht LE, Festa A, Goodarzi MO, et al. The association of inflammatory and fibrinolytic proteins with 5 year change in insulin clearance: the Insulin Resistance Atherosclerosis Study (IRAS) Diabetologia. 2013;56:112–120. doi: 10.1007/s00125-012-2741-8. [DOI] [PMC free article] [PubMed] [Google Scholar]
- 20.Hanley AJ, Wagenknecht LE, Norris JM, Bergman R, Anderson A, Chen YI, et al. Adiponectin and the incidence of type 2 diabetes in Hispanics and African Americans: the IRAS Family Study. Diabetes care. 2011;34:2231–2236. doi: 10.2337/dc11-0531. [DOI] [PMC free article] [PubMed] [Google Scholar]
- 21.Batsis JA, Sahakyan KR, Singh P, Bartels SJ, Somers VK, Lopez-Jimenez F. Leptin, adiposity, and mortality: results from the National Health and Nutrition Examination Survey III, 1988 to 1994. Mayo Clinic proceedings. 2015;90:481–491. doi: 10.1016/j.mayocp.2015.01.023. [DOI] [PubMed] [Google Scholar]
- 22.Seven E, Husemoen LL, Sehested TS, Ibsen H, Wachtell K, Linneberg A, et al. Adipocytokines, C-reactive protein, and cardiovascular disease: a population-based prospective study. PloS one. 2015;10:e0128987. doi: 10.1371/journal.pone.0128987. [DOI] [PMC free article] [PubMed] [Google Scholar]
- 23.Black MH, Fingerlin TE, Allayee H, Zhang W, Xiang AH, Trigo E, et al. Evidence of interaction between PPARG2 and HNF4A contributing to variation in insulin sensitivity in Mexican Americans. Diabetes. 2008;57:1048–1056. doi: 10.2337/db07-0848. [DOI] [PMC free article] [PubMed] [Google Scholar]
- 24.Xiang AH, Takayanagi M, Black MH, Trigo E, Lawrence JM, Watanabe RM, et al. Longitudinal changes in insulin sensitivity and beta cell function between women with and without a history of gestational diabetes mellitus. Diabetologia. 2013;56:2753–2760. doi: 10.1007/s00125-013-3048-0. [DOI] [PMC free article] [PubMed] [Google Scholar]
- 25.Therneau TM. coxme: Mixed Effects Cox Models. R package version 2.2-5. 2015 Available from: https://CRAN.R-project.org/package=coxme.
- 26.Hotelling H. RELATIONS BETWEEN TWO SETS OF VARIATES*. Biometrika. 1936;28:321–377. [Google Scholar]
- 27.Knapp TR. Canonical correlation analysis: A general parametric significance-testing system. Psychological Bulletin. 1978;85:410–416. [Google Scholar]
- 28.R Development Core Team. R: A language and environment for statistical computing. R Foundation for Statistical Computing; Vienna, Austria: 2016. [Google Scholar]
- 29.Yeh ET, Willerson JT. Coming of age of C-reactive protein: using inflammation markers in cardiology. Circulation. 2003;107:370–371. doi: 10.1161/01.cir.0000053731.05365.5a. [DOI] [PubMed] [Google Scholar]
- 30.Ridker PM. Cardiology Patient Page. C-reactive protein: a simple test to help predict risk of heart attack and stroke. Circulation. 2003;108:e81–85. doi: 10.1161/01.CIR.0000093381.57779.67. [DOI] [PubMed] [Google Scholar]
- 31.Zhang Y, Proenca R, Maffei M, Barone M, Leopold L, Friedman JM. Positional cloning of the mouse obese gene and its human homologue. Nature. 1994;372:425–432. doi: 10.1038/372425a0. [DOI] [PubMed] [Google Scholar]
- 32.Considine RV, Sinha MK, Heiman ML, Kriauciunas A, Stephens TW, Nyce MR, et al. Serum immunoreactive-leptin concentrations in normal-weight and obese humans. The New England journal of medicine. 1996;334:292–295. doi: 10.1056/NEJM199602013340503. [DOI] [PubMed] [Google Scholar]
- 33.Spiegelman BM, Flier JS. Adipogenesis and obesity: rounding out the big picture. Cell. 1996;87:377–389. doi: 10.1016/s0092-8674(00)81359-8. [DOI] [PubMed] [Google Scholar]
- 34.Hamann A, Matthaei S. Regulation of energy balance by leptin. Experimental and clinical endocrinology & diabetes: official journal, German Society of Endocrinology [and] German Diabetes Association. 1996;104:293–300. doi: 10.1055/s-0029-1211457. [DOI] [PubMed] [Google Scholar]
- 35.Chen K, Li F, Li J, Cai H, Strom S, Bisello A, et al. Induction of leptin resistance through direct interaction of C-reactive protein with leptin. Nature medicine. 2006;12:425–432. doi: 10.1038/nm1372. [DOI] [PubMed] [Google Scholar]
- 36.Loffreda S, Yang SQ, Lin HZ, Karp CL, Brengman ML, Wang DJ, et al. Leptin regulates proinflammatory immune responses. FASEB journal: official publication of the Federation of American Societies for Experimental Biology. 1998;12:57–65. [PubMed] [Google Scholar]
- 37.Bruun JM, Lihn AS, Verdich C, Pedersen SB, Toubro S, Astrup A, et al. Regulation of adiponectin by adipose tissue-derived cytokines: in vivo and in vitro investigations in humans. American journal of physiology Endocrinology and metabolism. 2003;285:E527–533. doi: 10.1152/ajpendo.00110.2003. [DOI] [PubMed] [Google Scholar]
- 38.Ouchi N, Higuchi A, Ohashi K, Oshima Y, Gokce N, Shibata R, et al. Sfrp5 is an anti-inflammatory adipokine that modulates metabolic dysfunction in obesity. Science (New York, NY) 2010;329:454–457. doi: 10.1126/science.1188280. [DOI] [PMC free article] [PubMed] [Google Scholar]
- 39.Ehrlund A, Mejhert N, Lorente-Cebrian S, Astrom G, Dahlman I, Laurencikiene J, et al. Characterization of the Wnt inhibitors secreted frizzled-related proteins (SFRPs) in human adipose tissue. The Journal of clinical endocrinology and metabolism. 2013;98:E503–508. doi: 10.1210/jc.2012-3416. [DOI] [PubMed] [Google Scholar]
Associated Data
This section collects any data citations, data availability statements, or supplementary materials included in this article.