

Abstract
Purpose
To investigate the association between macular features on spectral-domain optical coherence tomography (SD-OCT) and visual acuity (VA) in Coats' disease.
Methods
Thirty-nine eyes (39 patients) with SD-OCT from January 1, 2008 to December 31, 2016 were reviewed for SD-OCT features. Central subfield (CSF) SD-OCT findings were analyzed relative to VA (logarithm of the minimum angle of resolution) at baseline and final visit (when follow-up ≥ 6 months) and across visits.
Results
Mean VA ± standard deviation at baseline (37 eyes) was 0.92 ± 0.82. SD-OCT features associated with worse VA included, for treatment-naïve eyes (n = 21), outer retinal atrophy (ORA) (1.18 ± 0.34 with versus 0.20 ± 0.30 without, P = 0.005), subretinal fluid (SRF) (1.80 ± 0.63 vs. 0.63 ± 0.50, P = 0.008), bright hyperreflectivities (1.23 ± 0.68 vs. 0.52 ± 0.53, P = 0.02), thicker foveal subretinal space (r2 = 0.32, P = 0.01), and CSF (r2 = 0.39, P = 0.007); and for previously treated eyes (n = 16), a compact hyperreflective structure (1.60 ± 0.88 vs. 0.56 ± 0.64, P = 0.02) and ORA (1.34 ± 0.86 vs. 0.30 ± 0.44, P = 0.01). At final follow-up (n = 22), mean VA was 0.81 ± 0.83. Eyes with final VA <20/200 (n = 6, vs. >20/60, n = 11) more commonly had a compact hyperreflective structure and ORA at baseline and final visit (P < 0.05). Mean change in VA from baseline (n = 20) was −0.20 ± 0.59. Mean improvement in VA (range, −0.525 to −1.127) occurred in eyes with baseline SRF (P = 0.02) and bright hyperreflectivities (P = 0.03). Changes in thickness that correlated with change in VA included those for the foveal subretinal space (r2 = 0.52, P < 0.001) and CSF (r2 = 0.26, P = 0.045).
Conclusions
A compact hyperreflective structure (fibrosis) and ORA were associated with poor final VA while SRF, bright hyperreflectivities (exudation), and foveal subretinal thickness were associated with VA improvement post treatment.
Keywords: Coats' disease, spectral-domain optical coherence tomography, SD-OCT, visual acuity, VA, pediatric retina, pediatric retinal imaging
Coats' disease is characterized by idiopathic retinal vascular telangiectasias accompanied by retinal exudation and, in advanced cases, exudative retinal detachments.1 Traditional methods of diagnosing Coats' disease include direct visualization with indirect ophthalmoscopy and fluorescein angiography (FA). Indirect ophthalmoscopy classically shows yellow lipid-rich subretinal and intraretinal exudates associated with retinal vascular abnormalities,2,3 while FA can demonstrate hyperfluorescent telangiectasias with bulb-like outpouchings. More recently, wide-field imaging has also been utilized as it can aid in the early detection of peripheral vascular changes.4 Spectral-domain optical coherence tomography (SD-OCT), a relatively newer imaging modality, confers the additional advantage of in vivo cross-sectional imaging for quantification of the type and extent of macular involvement.
However, to date, there have been limited reports of OCT findings in Coats' disease that describe structural and visual response to therapy.5–12 Most studies have only reported on the presence of cross-sectional abnormal OCT findings including epiretinal membrane, intraretinal cystoid spaces, subretinal fluid (SRF), lipid exudation, retinal scar, subretinal hyperreflective nodule, and macular atrophy.5,8,10–12 Except for fibrotic nodule,10,11,13 these publications did not address the relationship between these OCT morphologies and visual acuity (VA). Thus, there remains a need for assessment of the relationships between these retinal and subretinal morphologies with VA, whether these change in response to therapy, and how baseline SD-OCT features relate to VA outcomes. In this study, we characterize the retinal and subretinal SD-OCT findings in a large series of patients with Coats' disease and associate these findings with the VA at every corresponding visit. We also examine the association between baseline SD-OCT features and final VA outcomes.
Methods
This was a retrospective cohort study of all patients diagnosed with Coats' disease who had SD-OCT imaging of the retina at Duke University Eye Center between January 1, 2008 and December 31, 2016. Patients who received tabletop SD-OCT imaging as part of standard clinical care were included based on a retrospective chart review while records for those who received handheld SD-OCT imaging were retrospectively obtained from a prospective OCT imaging study. Both studies were designed in accordance with the tenets of the Declaration of Helsinki, were approved by the Institutional Review Board (IRB) at Duke University, and were Health Insurance Portability and Accountability Act (HIPAA) compliant. For the prospective study, a parent of each participant provided informed consent for imaging and access to medical records and the SD-OCT images were selected from an existing database of research imaging of pediatric patients.
Subjects with a diagnosis code of exudative retinopathy (International Classification of Diseases, 9th revision, Code 362.12) were identified through a DEDUCE (Duke Enterprise Data Unified Content Explorer) search. Eyes that did not have Coats' disease fulfilling clinical criteria of having idiopathic retinal telangectasia associated with or without exudation and/or exudative retinal detachments, lacked SD-OCT imaging, had poor-quality SD-OCTs (due to media opacities, excessive eye movement or blinking), or had no documented VAs were excluded from the study.
Demographic information, VA, staging of Coats' disease, treatment history (laser or cryotherapy ablation, intravitreal steroid or anti-vascular endothelial growth factor, or surgical treatment with subretinal fluid drainage, vitrectomy, or scleral buckling), and total number of imaging sessions were documented. The best-corrected VA, when available, was documented. VA was measured with Snellen, Early Treatment Diabetic Retinopathy Study, Allen, or HOTV charts and converted to the logarithm of the minimum angle of resolution (logMAR) for statistical analysis. Low VAs (count fingers, hand movements, light perception and no light perception) measured at 2 feet were assigned logMAR values as previously described.14 At our institution, children with Coats' disease were co-managed between the pediatric retina and pediatric ophthalmology services to ensure that amblyopia therapy was initiated appropriately and in a timely manner. Affected eyes were divided based on clinical examination, fundus photographs, or fluorescein angiograms (FA) into five stages of disease as previously described by Shields et al.15 Some patients had SD-OCT imaging taken months to years after initial presentation to the Duke Eye Center. For this study, the baseline visit was defined as the date of the first obtained SD-OCT scan. The final visit was defined as the date of the last obtained SD-OCT scan.
Image capture was performed using tabletop SD-OCT (Spectralis; Heidelberg Engineering, Heidelberg, Germany) or portable handheld SD-OCT (Envisu; Leica Microsystems, Research Triangle Park, NC, USA) imaging with or without enhanced depth imaging (EDI). On the tabletop system, we obtained linear (30°) and volumetric scans (scan patterns of 30° × 23.3° or 30° × 25° with 768 A scans per horizontal scan). On the handheld system, we obtained volumetric scans (scan patterns of 9.3 × 9.3, 9.5 × 9.5, or 10.0 × 10.0 mm with 1366–1470 A scans per horizontal scan).16 After acquisition, raw data were reconstructed and viewed using the vendor's propriety software. Fundus photographs and FA were also compared to SD-OCT when available; these were obtained using tabletop systems: Zeiss FF450 (Carl Zeiss Meditec, Okerkochen, Germany), Optos 200Tx (Optos, Inc., Dunfermline, UK); or with RetCam 2 (Clarity Medical Systems, Pleasanton, CA, USA) in supine patients.
All macular SD-OCTs per imaging session were analyzed by a trained grader (SSO) and grading was reviewed with experts (LV, CAT). Interplatform differences were accounted for by using previously described conversion factors to convert axial measurements taken from the handheld platform to the corresponding Heidelberg Spectralis platform.17,18 Quantitative data included (1) foveal neurosensory retinal thickness: internal limiting membrane (ILM) to outer border of the retina; (2) foveal total retinal thickness: ILM to Bruch's membrane; (3) foveal subretinal thickness: outer border of the retina to Bruch's membrane; (4) foveal choroidal thickness: Bruch's membrane to choroidal–scleral junction; (5) central subfield (CSF) thickness: average thickness from ILM to Bruch's membrane in a 1-mm-diameter circle centered on the fovea; and (6) total macular volume: (from ILM to Bruch's membrane) in a 6-mm-diameter circle centered on the fovea. CSF scans were also evaluated for the presence or absence of SD-OCT features that included abnormalities of the vitreoretinal interface: vitreomacular adhesion or traction and epiretinal membrane (Figs. 1A, 1B); and within and beneath the retina: hyporeflective intraretinal cystoid spaces (which we did not describe as CME as these commonly had no FA leakage19), bright hyperreflectivities that could be intra- or subretinal and corresponded to exudates on color photographs (Figs. 1C, 1D), SRF (Figs. 1E, 1F), a compact hyperreflective structure that corresponded to a fibrotic nodule or macular fibrosis on color photographs (Figs. 1G, 1H), and outer retinal atrophy (ORA) subdivided by association with outer plexiform and outer nuclear layer loss, ellipsoid and interdigitation zone involvement and retinal pigment epithelial attenuation or atrophy (Figs. 1I, 1J). Since ORA could also be seen overlying a compact hyperreflective structure (Fig. 1H), ORA not overlying a compact hyperreflective structure was graded as a separate entity (Fig. 1J). Unless otherwise specified, ORA in this manuscript refers to ORA that can surround, but is not above a compact hyperreflective structure.
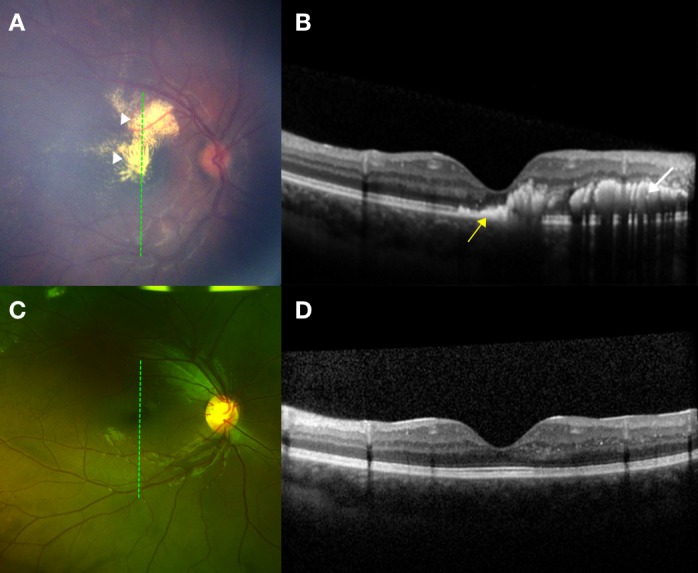
Figure 1.

Examples of graded features on spectral-domain optical coherence tomography (SD-OCT) and their corresponding color photographs. The dotted green lines on the left correspond to the SD-OCT sections on the right. All images were taken in treatment-naïve eyes. (A, B) Epiretinal membrane. (A) On color photography, epiretinal membrane is not easily visible but on (B) SD-OCT, epiretinal membrane appears as a hyperreflective membrane (white arrow) that can distort the foveal contour and cause retinal thickening. (C, D) Exudation. (C) On color photography, there is dense yellow exudation seen in the macula. (D) On SD-OCT, these exudates appear as bright hyperreflectivities intraretinally (white arrows) and subretinally (yellow arrow). SD-OCT also showed hyporeflective intraretinal cystoid spaces (red arrow) not otherwise visible on color photography. (E, F) Subretinal fluid (SRF). (E) On RetCam photography, SRF in the macula can be difficult to visualize on a two-dimensional image. (F) On SD-OCT, SRF (white arrow) is easily visualized along with subretinal bright hyperreflectivities (yellow arrow). (G, H) Fibrotic nodule/macular fibrosis. (G) On color photography, a fibrotic nodule/macular fibrosis appears as a dull yellow-gray mound of material. (H) On SD-OCT, this is seen as a compact hyperreflective structure (white arrows). There were also overlying and adjacent areas with loss of ellipsoid and interdigitation zones (yellow arrows). (I, J) ORA. (I) On color photography, ORA is seen in the inferior half of the macula. (J) On SD-OCT, the retinal architecture in the superior macula is intact but there is discontinuity of the ellipsoid and interdigitation zones (yellow arrow) and atrophy of the outer plexiform layer, outer nuclear layer, ellipsoid zone, interdigitation zone, and retinal pigment epithelium (white arrow) in the inferior macula.
To better characterize SD-OCT findings of treatment naïve versus those who had prior treatment for Coats' disease, we divided the population into these two groups for the analysis of SD-OCT features versus VA at baseline. Across all patient visits with both SD-OCT and VA available, we also compared the relationship between SD-OCT features with VA. Across the entire follow-up group (and then with subanalysis of eyes that were treatment naïve at baseline) we compared the baseline and final OCT features to good (better than 20/60) versus poor (worse than 20/200) VA outcomes at the final visit. We also compared baseline OCT features with change in VA from baseline to final visit in eyes with follow-up. For the longitudinal analysis, patients had to have follow-up of 6 months or longer.
Wilcoxon rank sum test was used to compare continuous variables between groups while the Fisher's exact test was used to compare categorical variables between groups. The Wilcoxon signed rank test was used to compare paired data. Generalized estimating equations (GEEs) were used to analyze the relationship between SD-OCT features with VA for all imaging sessions for all eyes since data from all imaging sessions included multiple longitudinal observations from the same eyes.20 A P value of less than 0.05 was considered statistically significant. Statistical analysis was performed using SAS version 9.4 (SAS Institute, Inc., Cary, NC, USA) and JMP Pro version 13.0 (SAS Institute, Inc.).
Results
A chart search revealed 84 patients with Coats' disease and when those records were reviewed, 48 were found to have had SD-OCT imaging. Upon review of the SD-OCT images, nine patients were further excluded from the study: six patients (two eyes with stages 3A1 and 3A2 disease, one eye with stage 3B disease, and three eyes with extensive scarring) due to poor-quality imaging, and an additional three patients who lacked VA data. This left 39 patients in the study, and 28 of these were children aged 18 or younger. One patient had bilateral involvement and the better eye was excluded from analysis. We had previously published a retrospective review comparing the visual outcomes for patients with Coats' disease who sought treatment at our institution over two 10-year periods (1996–2005 and 2006–2015).3 Twenty-three eyes from 23 patients from the previously published cohort were included in this study.3
Among the 39 eyes from 39 patients included in this study, 21 eyes were treatment naïve prior to their baseline SD-OCT while 18 eyes had received prior treatment. For the previously treated group, the average number of months (±standard deviation, SD) between the most recent prior treatment and the baseline OCT was 55.3 ± 58.8. Two eyes from the previously treated group did not have VA documented at the baseline visit but were included in the study since they had VA documented at the most recent follow-up. Baseline demographics, Coats' disease staging,15 and clinical characteristics for the 39 eyes are listed in Table 1. For the 22 eyes that had follow-up VA and SD-OCT at ≥6 months, clinical characteristics are shown in Table 2. In total, there were 167 imaging sessions after exclusion of 11 imaging sessions due to uninterpretable images from extreme pathology and/or inability to fix (n = 7), lack of cooperation in young patients (n = 2), or data loss (n = 2). Of these 167 imaging sessions, 144 had documented VA at the time of the imaging session.
Table 1.
Demographics and Baseline Ocular Characteristics

Table 2.
Characteristics of Eyes With Longitudinal Visual Acuity and Spectral-Domain Optical Coherence Tomography Follow-Up ≥ 6 Months

Association of VA With SD-OCT Findings
VA at the Baseline Visit
Mean VA ± SD at baseline (available for 37 eyes) was 0.92 ± 0.82 logMAR. In treatment-naïve eyes at the baseline visit (n = 21), comparison of VA for patients with and without selected SD-OCT features in the CSF is shown in Table 3. CSF features that were associated with poorer baseline VA included any hyperreflective material (P = 0.001) that consisted of intraretinal bright hyperreflectivities (P = 0.02) and subretinal bright hyperreflectivities (P = 0.01) (Fig. 1D), SRF (P = 0.008) (Fig. 1F), and ORA (P = 0.005) (Fig. 1J). Note that all eyes with subretinal bright hyperreflectivities also had bright hyperreflectivities within the retina (Fig. 1D).
Table 3.
Association Between Central Subfield Spectral-Domain Optical Coherence Tomography Findings With Visual Acuity (VA) for Treatment-Naive and Previously Treated Eyes at the Baseline Visit

In addition, for the treatment-naïve group, the following SD-OCT findings were associated with worse VA: increasing foveal total retinal thickness (r2 = 0.36, P = 0.008), foveal subretinal thickness (r2 = 0.32, P = 0.01), CSF thickness (r2 = 0.39, P = 0.007), and total macular volume (r2 = 0.75, P < 0.0001). In contrast, foveal neurosensory retinal thickness (which did not include subretinal material and fluid, P = 0.55) and foveal choroidal thickness (P = 0.77) were not associated with VA. None of these retinal measurements were found to be associated with stage of disease (data not shown). Notably, this analysis excluded three of five eyes with a compact hyperreflective structure since the combination of a compact hyperreflective structure and neurosensory retina extended beyond the axial frame of the OCT and thus quantitative measurements could not be obtained in these eyes.
For previously treated eyes at the baseline visit (n = 16), results for the comparison of VA with SD-OCT features at the same visit are shown in Table 3. Features associated with VA included the following: a compact hyperreflective structure (P = 0.02) (Fig. 1H) and ORA (P = 0.01) (Fig. 1J). None of the retinal thickness measurements (including those incorporating thicknesses of subretinal fluid and material) were found to be associated with VA (data not shown).
VA at All Visits
The comparison of VA with SD-OCT features at the same visit for all eyes at all available imaging sessions (n = 144) is shown in Table 4. Except for 24 visits, all visits were after at least one treatment session for Coats' disease. A compact hyperreflective structure (P = 0.002) and ORA (P < 0.001) were associated with VA for this analysis. None of the retinal thickness measurements (including those incorporating thicknesses of subretinal fluid and material) were found to be associated with VA (data not shown).
Table 4.
Association Between Central Subfield Spectral-Domain Optical Coherence Tomography Features With Visual Acuity for All Imaging Sessions for All Eyes (n = 144)

VA at the Most Recent Follow-Up
For 22 eyes with follow-up ≥ 6 months, mean VA at the most recent visit was 0.81 ± 0.83 logMAR. Change in selected SD-OCT features from the baseline to final visits were as follows: No eyes with a compact hyperreflective structure (0/4) or ORA (0/9) had resolution of finding after treatment (Fig. 2) while all eyes with SRF (3/3) and subretinal bright hyperreflectivities (4/4), and a majority of eyes with intraretinal bright hyperreflectivities (6/8) had resolution of finding after treatment (Fig. 3). A few eyes that did not previously have a compact hyperreflective structure (2/18 eyes) and ORA (1/7 eyes) also newly developed these findings despite treatment. No eyes newly developed SRF or intraretinal or subretinal bright hyperreflectivities after treatment.
Figure 2.

Evolution of a compact hyperreflective structure and outer retinal atrophy (ORA) in stage 2B disease. The dotted green lines on the left correspond to the main SD-OCT sections on the right while the dotted light blue lines on the left correspond to the inset SD-OCT sections on the right. (A, B) At presentation, a 6-year-old boy had VA 20/400. (A) RetCam photography demonstrated dense fibrotic nodules (red arrowheads) with surrounding exudates (yellow arrowhead) and ORA inferiorly (white arrowhead). (B) A horizontal SD-OCT section through the fovea demonstrated a compact hyperreflective nodular structure (red arrows) with overlying hyporeflective intraretinal cystoid spaces (green arrow). There were also overlying and adjacent ORA (white arrows) and adjacent subretinal bright hyperreflectivities (yellow arrow). There was a macular hole (white asterisk) overlying the compact hyperreflective nodule as well. The inset SD-OCT section across the inferotemporal arcade demonstrated hyporeflective intraretinal cystoid spaces (blue arrow) with ORA (white arrow). (C, D) One year after one session of laser photocoagulation, the patient's VA had deteriorated to 3/200. (C) Cropped wide-field color photography of the patient's macula demonstrated resolved exudation but persistent fibrotic nodules (red arrowheads) and ORA (white arrowhead). (D) A horizontal SD-OCT section through the fovea showed that the adjacent bright hyperreflectivities had resolved while the compact hyperreflective nodule (red arrows) persisted with no reduction in size. The hyporeflective intraretinal cystoid spaces (green arrow) persisted but were smaller in size. The ORA (white arrows) and macular hole also remained (white asterisk). The inset SD-OCT section across the inferotemporal arcade demonstrated resolved hyporeflective intraretinal cystoid spaces but persistent ORA (white arrow).
Figure 3.
Evolution of bright hyperreflectivities in stage 2B disease. The dotted green lines on the left correspond to the SD-OCT sections on the right. (A, B) At presentation, a 10-year-old boy had VA 20/160. (A) RetCam photography showed star-shaped exudates (white arrowheads) in the central and superior macula. (B) A vertical SD-OCT section through the fovea demonstrated predominantly intraretinal bright hyperreflectivities (white arrow) and some subretinal bright hyperreflectivities (yellow arrow). (C, D) After treatment with two sessions of laser photocoagulation, VA had improved to 20/20. (C) A cropped wide-field photograph demonstrated complete resolution of exudates in the macula. (D) A vertical SD-OCT section through the fovea showed that the bright hyperreflectivities had resolved.
At the final visit for all 22 eyes with follow-up, certain SD-OCT features were more frequently found in eyes with poor final VA (worse than 20/200) than in eyes with good final VA (better than 20/60) (Table 5). These included a compact hyperreflective structure (P = 0.006), ORA (P = 0.04), and hyporeflective intraretinal cystoid spaces (P = 0.03). Next, baseline SD-OCT features were analyzed relative to the final VA groups (Table 6). Some baseline features were more common in eyes with final VA worse than 20/200 in contrast to those with final VA better than 20/60. These included a compact hyperreflective structure (P = 0.03) and ORA (P = 0.02).
Table 5.
Comparison Between Central Subfield Spectral-Domain Optical Coherence Tomography Findings at the Final Visit With Visual Acuity (VA) at the Final Visit for All Eyes With Follow-Up OCTs (n = 22)

Table 6.
Comparison Between Central Subfield Spectral-Domain Optical Coherence Tomography Findings at the Baseline Visit With Visual Acuity (VA) at the Final Visit for All Eyes With Follow-Up OCTs

Change in VA From Baseline to the Most Recent Visit
Change in VA from baseline to the final follow-up was available for 20 eyes. The mean change in VA was −0.20 ± 0.59 logMAR. As shown in Table 7, a change in VA from baseline to the final follow-up was associated with baseline SRF (P = 0.02) and baseline intraretinal hyperreflectivities (P = 0.03) but not baseline subretinal bright hyperreflectivities (P = 0.09).
Table 7.
Association Between Central Subfield Spectral-Domain Optical Coherence Tomography Findings at the Baseline Visit With Change in Visual Acuity (VA) From Baseline to Final Visit in All Eyes With Follow-Up

Given the improvement in VA associated with baseline SRF, we specifically examined two treatment-naïve eyes that had presented with stage 3A1 disease and two or three quadrants of foveal-involving SRF (Fig. 4). At presentation, both eyes also had exudates involving the fovea. Baseline VA was count fingers at 1 foot for both eyes. After treatment, SRF and exudation resolved for both eyes, but one eye developed extensive foveal fibrosis with overlying and adjacent ORA while the other developed extrafoveal fibrosis and ORA. At the most recent follow-up, the VAs for these eyes were 2/200 and 20/50, respectively.
Figure 4.

Evolution of subretinal fluid (SRF) in two patients with stage 3A1 disease (patient 1: A–D; patient 2: E–H). The dotted green lines on the left correspond to the SD-OCT sections on the right. Patient 1: (A, B) At presentation, patient 1 was a 17-year-old boy with count fingers at 1 foot VA. (A) On wide-field photography, there were massive lipid exudation (yellow arrowhead) and SRF (blue arrowhead) involving the fovea as well as intraretinal hemorrhage in the temporal periphery. (B) A horizontal SD-OCT section through the fovea showed SRF (blue arrow) and nasally, subretinal bright hyperreflectivities (yellow arrow). (C, D) After treatment with intravitreal bevacizumab injections, cryotherapy, and laser photocoagulation and 9 months after presentation, there was slight improvement of VA to 2/200. (C) On wide-field photography, the patient had developed a dense fibrotic band (red arrow) across the macula. (D) On SD-OCT, this was seen as a compact hyperreflective structure (red arrows) with overlying outer retinal atrophy (white arrows). Patient 2: (E, F) At presentation, patient 2 was an 8-year-old boy who had count fingers at 1 foot VA. (E) On wide-field photography, there was fovea involving extensive lipid exudation (yellow arrowhead) and retinal detachment extending inferiorly (blue arrowhead), a separate pocket of SRF superotemporally (blue arrowhead), and aneurysms and intraretinal heme in the temporal periphery. (F) A vertical SD-OCT section through the fovea showed dense subretinal bright hyperreflectivities (yellow arrow) and SRF inferiorly (blue arrow). (G, H) After treatment with laser photocoagulation, cryotherapy, and intravitreal bevacizumab and 7 years following initial diagnosis, VA had improved remarkably to 20/50. (G) On wide-field photography, the exudation and fluid had resolved and fibrotic changes were observed along the superonasal and superotemporal arcades extending into the temporal periphery (red arrowheads). (H) A vertical SD-OCT section through the fovea showed resolution of bright subretinal hyperreflectivities and parafoveal loss of outer retinal layers (white arrows) but preservation of retinal layers at the foveal center (white asterisk).
We then compared the change in VA from baseline to the final visit with change in retinal thickness measurements (Fig. 5). Change in VA was correlated with change in foveal total retinal thickness (P = 0.02), foveal subretinal thickness (P < 0.001), CSF thickness (P = 0.045), and total macular volume (P = 0.03). In contrast, change in VA was not correlated with change in foveal neurosensory thickness (P = 0.38) or foveal choroidal thickness (P = 0.77). Specifically, a decrease in foveal subretinal thickness, which has the strongest correlation with VA improvement, was found to be associated with baseline SRF [present (n = 2): −329 ± 182 μm versus absent (n = 18): −8 μm ± 39 μm; P = 0.02] and baseline subretinal bright hyperreflectivities [present (n = 3): −183 ± 238 μm versus absent (n = 16): −16 μm ± 62 μm; P = 0.03].
Figure 5.

Correlation between change in retinal thickness measurements (at the foveal center, across the central subfield and macula) and change in VA from baseline to the most recent follow-up. Decreases in foveal total retinal thickness, foveal subretinal thickness, central subfield thickness, and total macular volume were positively correlated with improvements in VA (−logMAR) while there was no correlation between change in foveal neurosensory retinal thickness or foveal choroidal thickness with change in VA.
Discussion
This is the first study in the literature to show an association between both qualitative and quantitative SD-OCT features in the macula with VA in Coats' disease. This study also included the largest number of children with Coats' disease and these comprehensively examined OCT findings (n = 28) to date. A literature search on PubMed using the terms “optical coherence tomography”, “Coats' disease”, “vision”, and “visual acuity” between January 1, 2007 and December 13, 2017 revealed no similar previously published manuscripts. Some prior studies have incorporated OCT imaging in the assessment of visual outcomes in subfoveal nodule/macular fibrosis10,11,13 but did not include the comprehensive list of qualitative and quantitative findings as in our study. In our report, a compact hyperreflective structure (fibrotic nodule or macular fibrosis) and ORA were associated with worse VA at baseline for previously treated eyes, did not resolve after therapy, and were not associated with VA improvement post treatment. They were also more commonly present at the baseline and final visits in eyes with poor final VA (<20/200) when compared to eyes with good final VA (>20/60). In contrast, although bright hyperreflectivities (exudates), SRF, and foveal subretinal thickness were associated with poorer VA at baseline prior to the initiation of any treatment, they could resolve and were linked to an improvement in VA after therapy.
A compact hyperreflective structure (fibrotic nodule or macular fibrosis) in the CSF was associated with worse VA at baseline for previously treated eyes in this study. It also persisted despite therapy, did not progress to improvement in VA, and was associated with poorer VA after treatment for all eyes with follow-up. Subfoveal nodule or macular fibrosis in Coats' disease has been shown to be associated with poor visual outcomes in prior publications.10,13,15 While Daruich et al.10 made a distinction between subfoveal nodule (defined as a yellow exudative, protruding, spheroidal lesion) and macular fibrosis (defined as a subretinal white-gray scar at the fovea), Jumper et al.13 and Shields et al.15 used the two terms interchangeably. We did not make a distinction between the two terms since it is still unknown if they (Figs. 1G, 1H, 2, 3C, 3D) are indeed two distinct entities or part of a spectrum of disease findings. Fibrosis has been postulated to cause decreased vision by disrupting the highly organized tissue architecture in the retina.21 Our study is the first to also report local destruction of the photoreceptors and retinal pigment epithelium overlying the compact hyperreflective structure in Coats' disease. This localized ORA likely also contributes to visual loss in these eyes.
Next, ORA (not above a compact hyperreflective structure) was associated with poor VA at baseline in both treatment-naïve and previously treated eyes, did not resolve with therapy, and was more commonly found at baseline and the most recent follow-up in eyes with poor (<20/200) final VA. ORA has been associated with poor VA in many other ocular conditions,22,23 but our study is the first to identify photoreceptor and retinal pigment epithelium atrophy at baseline as a macular feature associated with poor VA at follow-up in Coats' disease. Mechanistically, ORA in Coats' disease may develop secondary to chronic exudation and fluid, as well as from underlying fibrosis or ischemic or inflammatory effects.
Meanwhile, baseline SRF in the CSF was associated with poor VA prior to any treatment but this finding resolved after treatment with resultant improvement in foveal subretinal thickness and VA. Consequently, neither SRF at baseline or the final visit was associated with poor VA at the final visit. In contrast to our study findings, without using OCT, Shields and colleagues15 found that subfoveal fluid at the final follow-up was the reason for final VA worse than 20/200 in 47% of 79 eyes, while Al-Qahtani and colleagues24 reported that the only baseline structural change that was associated with poor visual outcomes, after adjusting for potential confounders and by using multivariate analyses, was SRF in all four quadrants with foveal involvement. We suspect the difference between these studies and our present report to be due to a difference in study population, as patients with retinal detachments in all four quadrants are likely to have higher macular detachment and are not likely to be imaged with OCT, as in our study that did not have any stage 3B treatment-naïve eyes. Differences in outcomes may also be impacted by frequency or selection of treatments to achieve anatomic resolution of disease.3
Both intraretinal and subretinal bright hyperreflectivities (exudates) in the CSF at baseline were also associated with poor VA prior to any treatment, but these baseline exudates could resolve after treatment. Specifically, baseline intraretinal bright hyperreflectivities (exudates) were associated with an improvement in VA from baseline to the final visit. Eyes with baseline subretinal bright hyperreflectivities (exudates) also demonstrated a greater improvement in VA compared to those without, but this relationship did not reach statistical significance. Given the small number of subjects in this study, this finding should be interpreted with caution since the small sample size may have limited the ability to detect differences across groups.
We also specifically examined two eyes with advanced disease and dense SRF and exudation at presentation, and demonstrated that SRF and exudates resolved after treatment but that fibrosis and ORA can subsequently form (Fig. 4). The eye that developed fibrosis and ORA affecting the fovea had poor final VA while the eye that developed fibrosis and ORA that spared the fovea had profound VA improvement. With the findings taken together, our study suggests that eyes with advanced disease and dense SRF and exudation may or may not have good VA outcomes after treatment depending on the formation and location of fibrotic bands and ORA (foveal or extrafoveal).
Our study demonstrated that quantitative measurements including increased foveal total retinal thickness, CSF thickness, and macular volume (all three incorporating both the retina and the subretinal space) as well as foveal subretinal thickness were correlated with poor VA in Coats' disease prior to treatment. After therapy, an improvement in all these measurements was also correlated with an improvement in VA and this relationship was the strongest for foveal subretinal thickness. Specifically, improvement in foveal subretinal thickness was associated with baseline SRF and subretinal bright hyperreflectivities (exudates). It is important to note, however, that three of the five eyes that presented with a compact hyperreflective structure prior to treatment could not be graded quantitatively since the combination of a compact hyperreflective structure and retina extended beyond the axial frame of the OCT. This led to the exclusion of eyes with the thickest quantitative measurements and is an important limitation to the study.
This study's strengths include being the first to utilize SD-OCT to assess for associations between VA with qualitative and quantitative findings in the CSF and macula in Coats' disease. Limitations of this study include exclusion of eyes with the most severe disease, its retrospective nature, nonstandardized imaging, small sample size, inability to measure VA in the youngest patients, and the possible role of amblyopia in restricting final VA in children. Our group had previously reported that earlier and more frequent treatments resulted in better VA outcomes in eyes with Coats' disease.3 However, due to the small sample size, it was not possible to study both the effects of treatment and OCT morphologic changes with VA outcomes in this study. Therefore, the effect of specific therapeutic modalities on VA outcomes was beyond the scope of this study.
In conclusion, SD-OCT is an essential component of multimodal imaging in the diagnosis and prognosis of Coats' disease in eyes in which macular imaging is possible. This study demonstrated that fibrotic nodules/macular fibrosis and ORA persisted after treatment and their presence at baseline and final visit were therefore associated with poor VA at the most recent follow-up. Meanwhile, untreated SRF, retinal exudation, and foveal subretinal thickness caused poor VA at baseline but these features could improve after treatment with good VA outcomes. Determination of these SD-OCT findings at the initial visit can help providers prognosticate visual outcomes and decide treatment strategies accordingly, and highlight the importance of incorporating multimodal imaging in this disease. Although these SD-OCT findings are promising prognostic imaging biomarkers, it will be important to properly validate these biomarkers in future studies before they can be reliably used in clinical research and clinical practice.
Acknowledgments
Presented at the annual meeting of the Association for Research in Vision and Ophthalmology, Honolulu, Hawaii, United States, April 29–May 3, 2018.
The authors thank Katrina P. Winter, BS, Du Tran-Viet, BS, and Vincent Tai, MS, for assistance with image acquisition and analysis.
Supported by The International Retinal Research Foundation, The Hartwell Foundation, The Andrew Family Charitable Foundation, National Institutes of Health (NIH) Grants 1RO1 EY025009 and UL1 RR024128 (Pilot project grant) from Duke Translational Research Institute and NIH Roadmap for Medical Research. The writing and content of the paper are solely the responsibility of the authors and do not necessarily represent the official view of NIH. The sponsors or funding organizations had no role in the design or conduct of this research.
Disclosure: S.S. Ong, International Retinal Research Foundation (F); P. Mruthyunjaya, Optos (R); S. Stinnett, None; L. Vajzovic, Alcon (F), Roche (F), Second Sight, Inc. (F), DORC (R); C.A. Toth, Alcon (R), The Hartwell Foundation (F), The Andrew Family Charitable Foundation (F), Duke Translational Research Institute (F), NIH Roadmap for Medical Research (F)
References
- 1. Shields J, Shields C. . Review: coats disease, the 2001 LuEsther T. Mertz lecture. Retina. 2001; 22: 80– 91. [DOI] [PubMed] [Google Scholar]
- 2. Rubin MP, Mukai S. . Coats' disease. Int Ophthalmol Clin. 2008; 48: 149– 158. [DOI] [PubMed] [Google Scholar]
- 3. Ong SS, Buckley EG, McCuen BW II, et al. Comparison of visual outcomes in coats' disease: a 20-year experience. Ophthalmology. 2017; 124: 1368– 1376. [DOI] [PubMed] [Google Scholar]
- 4. Suzani M, Moore AT. . Intraoperative fluorescein angiography-guided treatment in children with early Coats' disease. Ophthalmology. 2015; 122: 1195– 1202. [DOI] [PubMed] [Google Scholar]
- 5. Shields CL, Mashayekhi A, Luo CK, Materin MA, Shields JA. . Optical coherence tomography in children: analysis of 44 eyes with intraocular tumors and simulating conditions. J Pediatr Ophthalmol Strabismus. 2004; 41: 338– 344. [DOI] [PubMed] [Google Scholar]
- 6. Henry CR, Berrocal AM, Hess DJ, Murray TG. . Intraoperative spectral-domain optical coherence tomography in Coats' patients. Ophthalmic Surg Lasers Imaging Retina. 2012; 43: e80– e84. [DOI] [PubMed] [Google Scholar]
- 7. Kessner R, Barak A, Neudorfer M. . Intraretinal exudates in Coats' disease as demonstrated by spectral-domain OCT. Case Rep Ophthalmol. 2012; 3: 11– 15. [DOI] [PMC free article] [PubMed] [Google Scholar]
- 8. Hautz W, Golebiewska J, Kocyla-Karczmarewicz B. . Optical coherence tomography and optical coherence tomography angiography in monitoring Coats' disease. J Ophthalmol. 2017; 2017: 7849243. [DOI] [PMC free article] [PubMed] [Google Scholar]
- 9. Muakkassa NW, de Carlo TE, Choudhry N, Duker JS, Baumal CR. . Optical coherence tomography angiography findings in Coats' disease. Ophthalmic Surg Lasers Imaging Retina. 2016; 47: 632– 635. [DOI] [PubMed] [Google Scholar]
- 10. Daruich AL, Moulin AL, Tran HV, Matet A, Munier FL. . Subfoveal nodule in Coats' disease: toward an updated classification predicting visual prognosis. Retina. 2017; 37: 1591– 1598. [DOI] [PMC free article] [PubMed] [Google Scholar]
- 11. Sigler EJ, Calzada JI. . Retinal angiomatous proliferation with chorioretinal anastomosis in childhood Coats disease: a reappraisal of macular fibrosis using multimodal imaging. Retina. 2015; 35: 537– 546. [DOI] [PubMed] [Google Scholar]
- 12. Rabiolo A, Marchese A, Sacconi R,et al. Refining Coats' disease by ultra-widefield imaging and optical coherence tomography angiography. Graefes Arch Clin Exp Ophthalmol. 2017; 255: 1881– 1890. [DOI] [PubMed] [Google Scholar]
- 13. Jumper JM, Pomerleau D, McDonald HR, Johnson RN, Fu AD, Cunningham ET Jr.. Macular fibrosis in Coats disease. Retina. 2010; 30 4 suppl: S9– S14. [DOI] [PubMed] [Google Scholar]
- 14. The IONDT Research Group. The ischemic optic neuropathy decompression trial (IONDT): design and methods. Control Clin Trials. 1998; 19: 276– 296. [DOI] [PubMed] [Google Scholar]
- 15. Shields JA, Shields CL, Honavar SG, Demirci H, Cater J. . Classification and management of Coats disease: the 2000 Proctor Lecture. Am J Ophthalmol. 2001; 131: 572– 583. [DOI] [PubMed] [Google Scholar]
- 16. Maldonado RS, Izatt JA, Sarin N,et al. Optimizing hand-held spectral domain optical coherence tomography imaging for neonates, infants, and children. Invest Ophthalmol Vis Sci. 2010; 51: 2678– 2685. [DOI] [PMC free article] [PubMed] [Google Scholar]
- 17. Folgar FA, Yuan EL, Farsiu S, Toth CA. . Lateral and axial measurement differences between spectral-domain optical coherence tomography systems. J Biomed Opt. 2014; 19: 16014. [DOI] [PMC free article] [PubMed] [Google Scholar]
- 18. Folgar FA, Yuan EL, Farsiu S, Toth CA. . Errata: Lateral and axial measurement differences between spectral-domain optical coherence tomography systems. J Biomed Opt. 2015; 20: 59802. [DOI] [PMC free article] [PubMed] [Google Scholar]
- 19. Otani T, Yamaguchi Y, Kishi S. . Serous macular detachment secondary to distant retinal vascular disorders. Retina. 2004; 24: 758– 762. [DOI] [PubMed] [Google Scholar]
- 20. Zeger SL, Liang KY, Albert PS. . Models for longitudinal data: a generalized estimating equation approach. Biometrics. 1988; 44: 1049– 1060. [PubMed] [Google Scholar]
- 21. Friedlander M. . Fibrosis and diseases of the eye. J Clin Invest. 2007; 117: 576– 586. [DOI] [PMC free article] [PubMed] [Google Scholar]
- 22. Bhisitkul RB, Mendes TS, Rofagha S,et al. Macular atrophy progression and 7-year vision outcomes in subjects from the ANCHOR, MARINA, and HORIZON studies: the SEVEN-UP study. Am J Ophthalmol. 2015; 159: 915– 924, e912. [DOI] [PubMed] [Google Scholar]
- 23. Santos AR, Costa MA, Schwartz C,et al. Optical coherence tomography baseline predictors for initial best-corrected visual acuity response to intravitreal anti-vascular endothelial growth factor treatment in eyes with diabetic macular edema: the Chartres Study. Retina. 2018; 38: 1110– 1119. [DOI] [PubMed] [Google Scholar]
- 24. Al-Qahtani AA, Almasaud JM, Ghazi NG. . Clinical characteristics and treatment outcomes of coats disease in a Saudi Arabian population. Retina. 2015; 35: 2091– 2099. [DOI] [PubMed] [Google Scholar]