

Abstract
While enhancers for embryonic stem cell (ESC)-expressed genes and lineage-determining factors are characterized by conventional marks of enhancer activation in ESCs1,2,3, it remains unclear whether enhancers destined to regulate cell-type-restricted transcription units might also have some currently overlooked, distinct signatures in ESCs. Here, we report that cell-type-restricted enhancers, are unexpectedly premarked and activated as transcription units by the binding of a single, or two, ESC transcription factors, although not exhibiting traditional enhancer epigenetic marks in ESCs, thus uncovering the initial temporal origins of cell-type-restricted enhancers. This premarking is required for future cell-type-restricted enhancer activity in the differentiated cells, with the strength of the ESCs signature being functionally important for subsequent robustness of cell-type-restricted enhancer activation. This model has been experimentally validated in macrophage-restricted enhancers and neural precursor cells (NPCs)-restricted enhancers using ESCs-derived macrophages or NPCs, edited to contain specific ESC transcription factor motif deletions. The ESC transcription factor-determined DNA hydroxyl-methylation of the enhancers in ESCs may serve as a potential molecular memory for subsequent enhancer activation in the mature macrophage. These findings suggest that the massive repertoire of cell-type-restricted enhancers are essentially hierarchically and obligatorily “premarked” by binding of a defining ESC transcription factor in ESCs, dictating robustness of enhancer activation in mature cells.
Enhancers function as critical regulatory elements that integrate genomic information for cell fate transition and cell specific gene regulation1,2,3. Here, we hypothesize that cell-type-restricted enhancers might be premarked in ESCs. To begin to explore this question, we selected macrophage enhancers, because the sequential events leading to macrophage differentiation and regulation by inflammatory signals are rather well understood4,5,6. We first examined the full repertoire of macrophage-restricted enhancers in ESCs, finding that the majority (18,405) exhibited an absence of H3K4me1, H3K4me2, H3K27Ac and H3K27me3 marks (referred to as “unmarked” in Extended data Fig.1a), although ~4,000 enhancers, active in both macrophages and ESCs and including “housekeeping genes”, did exhibit H3K4me2 and H3K27Ac, generally within 200kb of coding target genes (Extended data Fig.1a, Fig.1a). Finally, a small number of enhancers (214) had marks of “poised” enhancers, i.e. H3K27me3 (Extended data Fig.1a, Fig.1a). To further understand the enhancer features in ESCs, an ATAC-seq assay was performed. The 18,405 “unmarked” macrophage enhancers were in an “open” configuration compared to random regions (Fig.1b), consistent with published DNase hypersensitivity analyses in ESCs (Fig.1b), but not as robustly accessible when compared to ESC-active enhancers (Extended data Fig.1b). To more specifically identify the transcription factors (TFs) that might underlie the macrophage enhancers have an “open” chromatin configuration, we profiled the distribution of several of the most important ESC TFs - Esrrb, Nanog, Oct4 and Sox2 (ENOS) in a −1kb/+1kb window, ensuring that we were exclusively analyzing macrophage-restricted enhancers. Interestingly, we observed the binding of ENOS in 6,775 macrophage-restricted enhancers (Fig.1c). The specificity of ENOS binding in macrophage-restricted enhancers was established by comparing with random regions (Extended data Fig.1c), revealing a statistically significant binding of Esrrb (see example, Extended data Fig.1d). Interestingly, we found that ~80% of macrophage-restricted enhancers were bound by a single, or at most two, ESC TFs, while ESC-active enhancers exhibited binding of all four ENOS factors (Fig.1d, Extended data Fig.1e), exemplified by genome browser images (Extended data Fig.1f). Premarking events were further studied by analyzing 12 ESC TFs from the published literature7, and finding that active ESC-restricted enhancers were characteristically bound by predominantly 4~8 of the 12 ESC TFs evaluated (Oct4, Sox2, Nanog, Esrrb, Smad1, E2f1, Tcfcp2l1, Zfx, Stat3, Klf4, c-myc and n-myc), consistent with their often-reported cooperative binding7,8, while the majority of the active macrophage-restricted enhancers exhibit binding of only one or two of these factors (Fig.1e).
Figure 1. Features of macrophage enhancers in ESCs.
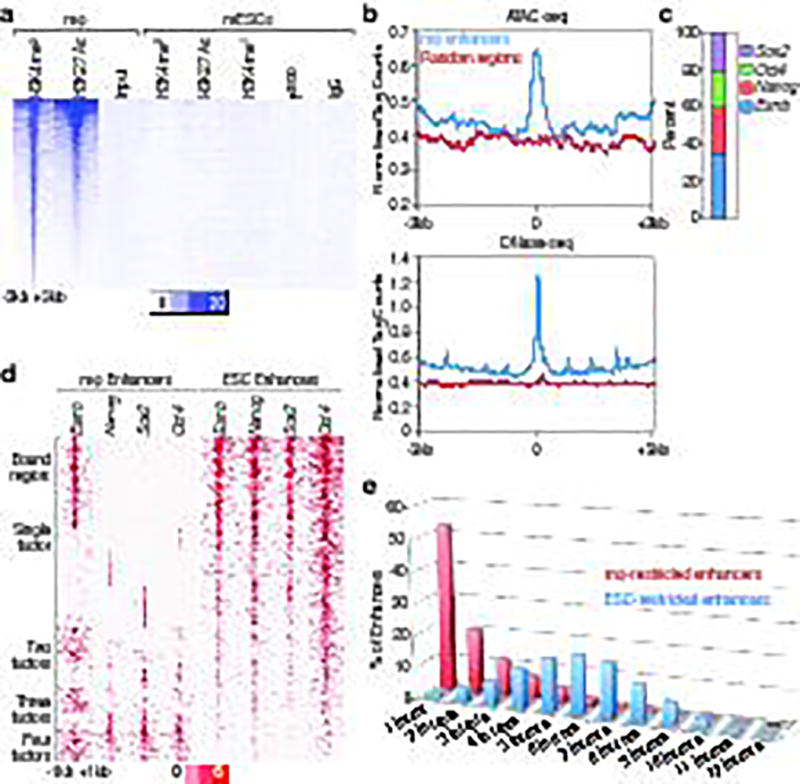
a, Heatmap of H3K4me1, H3K4me2 and H3K27Ac, and p300 with −3kb/+3kb window, centered on Pu.1 in 18,405 macrophage-restricted enhancers in ESCs. b, Tag density of ATAC-seq and DNase-seq in 18,405 macrophage-restricted enhancers and random regions in mESC shows chromatin openness of macrophage-restricted enhancers in ESCs. c, Target percentage of ESC TFs (Esrrb, Nanog, Oct4, Sox2) bound macrophage-restricted enhancers with −1kb/+1kb from macrophage-restricted enhancers. d, ENOS factor binding centered on each ESC factors in 6,775 premarked macrophage-restricted enhancers and 28,450 active ESC-restricted enhancers in −1kb/+1kb window. e, The binding of 12 ESC TFs (Oct4, Sox2, Nanog, Esrrb, Smad1, E2f1, Tcfcp2l1, Zfx, Stat3, Klf4, c-myc and n-myc) in 6,809 active macrophage-restricted enhancer and 8,209 active ESC-restricted enhancers defined based on H3K27Ac (over 100 tags) in −1kb/+1kb window. ChIP-seq Data from published sources are listed in Supplementary Table 1.
To determine whether cell-type-restricted enhancers in other cell types also exhibit similar pre-marking, we examined cell-type-restricted enhancers from heart, kidney and N2A neuronal cells, finding that these enhancers in ESCs again predominantly exhibited binding of a single ENOS factor and chromatin openness (Extended data Fig.2a–d).
Given the well-established role of the Cohesin complex in chromatin architecture and gene regulation9,10,11, we examined whether the Cohesin complex plays a role in premarked enhancers, and found that Cohesin was colocalized with ENOS-bound regions (Fig.2e), consistent with previous report11. Therefore, next, it was important to investigate whether premarked enhancers could interact with other genomic regions. A macrophage enhancer located in 5’ of Il1a was selected and 4C-seq was performed12. This “premarked” enhancer exhibited specific interactions with other genomic regions in ESCs, including an upstream CTCF-bound site, but not with the cognate promoter. In Kdo2-lipid A (KLA)-treated macrophages, this enhancer exhibits robust interactions with the cognate promoter of the target coding gene (Extended data Fig.3a). An enhancer located in 5’ of Tnfaip3 was similarly found to exhibit specific interactions with other genomic regions in ESCs, but not with its cognate promoter (Extended data Fig.3b). In addition, we performed RNA-seq and examined proximal macrophage-expressed genes of 6,775 macrophage-restricted enhancers, finding 634 differentially expressed genes (FC≥4), which correspond to functional categories relevant to the macrophage but not ESCs (Extended data Fig.3c,d). These data, together with 4C-seq, suggest that premarked macrophage enhancers are not functional, despite ESC TF binding and open chromatin configurations in ESCs.
Figure 2. ESC TFs bind to macrophage-restricted enhancers in ESCs.
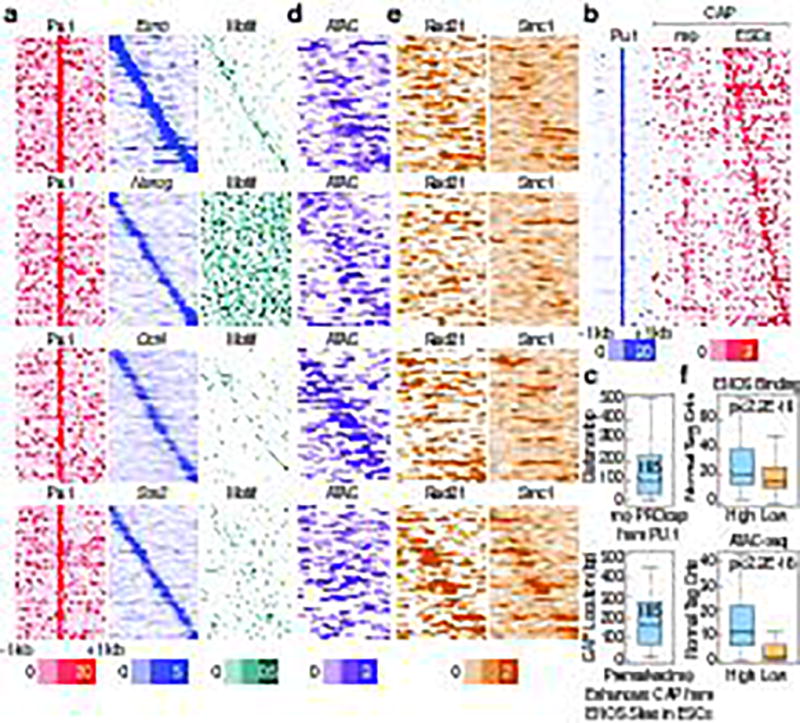
a, d, e, Heatmap of (a), ENOS binding (d), ATAC-seq (e), Rad21 and Smc1 in −1kb/+1kb window in 6,775 premarked macrophage enhancers is plotted relative to the location of the Pu.1 binding sites in the enhancers. a, Last panel shows corresponding binding sites of ENOS to the presence of the ENOS binding. b, 2,345 PRO-cap peaks identified in macrophages or ESCs in −1kb/+1kb window from 6,775 premarked enhancers are plotted by heatmap centered on Pu.1. c, Location of PRO-cap peak sites from Pu.1 in macrophage or from the ENOS in ESCs is calculated in 638 premarked macrophage enhancers, which has PRO-cap peaks in a −500bp/+500bp window from Pu.1 binding sites. f, ENOS binding and ATAC-seq signal in highest vs. lowest ~40% of macrophage enhancers selected based on Rad21 binding intensity in ESCs. In the box plots, line shows median, and box shows 25th and 75th percentiles. P-values are calculated using Welch’s two t-test.
To further explore any potential impact of ENOS binding in ESCs on the subsequent function of enhancers bound by Pu.1, a key macrophage TF, we assessed the physical location of ENOS binding in premarked enhancers. When centered on Pu.1 binding sites, we observed that the ENOS binding varies in the 6,775 macrophage enhancers, corresponding to the location of cognate binding sites (Fig.2a).
Because eRNA expression is a mark of enhancer activity13, the possibility of transcription unit in ENOS-bound premarked enhancer was examined. Because the GRO-seq data was insufficiently robust on these enhancer regions to draw clear conclusions, we performed PRO-cap. 2,336 of significant Cap sites were identified in −1kb/+1kb window in 6,775 premarked enhancers in ESCs. While Cap sites were found to be located in close proximity to the Pu.1 binding site in the macrophages, they were located broadly in ESCs, at various distances from the Pu.1 site, correlating closely with ENOS binding sites (Fig.2b). The median distance from the Pu.1 site to the macrophage specific eRNA Cap (−500bp/+500bp from the Pu.1 site) proved to be ~105 bp in the mature macrophage13, while the median distance from the ENOS binding site to the ESC specific eRNA Cap was ~165 bp (Fig.2c). This ESC-induced transcription unit for each enhancer was therefore distinct from the eRNA transcription units subsequently nucleated by Pu.1 and C/EBPα in the mature macrophage, the binding sites for which are located within a “core” enhancer region. Indeed, ATAC-seq revealed chromatin openness in the region where ENOS bound to the enhancers (Fig.2d). The functional correlation between Cohesin and ENOS bound enhancers were further examined, and found that high Rad21 binding was associated with high ENOS binding and a more “open” configuration (Fig.2f).
To preclude any concerns regarding serum culture conditions, we performed ChIP-seq with H3K4me2 and H3K27Ac, and ATAC-seq under two different culture conditions: 2i and serum. H3K4me2 and H3K27Ac were not observed in macrophage enhancers in both 2i- and serum- cultured ESCs, and ATAC-seq signal was equivalently detected in both conditions (Extended data Fig.4a,b), indicating that culturing ESCs in serum did not impact our observations. Indeed, most pluripotency-associated genes were transcribed at similar levels in serum- or 2i- cultured ESCs14 and only 8% of cells are heterogeneous in serum-treated ESCs15.
To investigate potential function of premarking, we examined the correlation between ENOS factors and the ultimate activity of the enhancers in the mature macrophage. ENOS-bound macrophage enhancers with the highest or lowest ~20% levels of ENOS transcription units were selected to test their ultimate activation in the macrophage. The highest group of enhancers exhibited the higher “activation”, as determined by binding of Pu.1, PRO-cap signal, eRNA transcription, levels of H3K4me2 and H3K27Ac, and binding of Cohesin in macrophage (Fig.3a–d). In addition, when the highest or least ~20% of active macrophage enhancers were extracted based on GRO-seq signal in macrophage13, ENOS binding and ATAC-seq signals in ESCs proved to be higher in the most active macrophage enhancers compared to less active macrophage enhancers (Fig.3e,f). Indeed, we observed that putatively active macrophage enhancers, defined by eRNA transcription, are found much more frequently in the 6,775 ENOS-bound enhancers compared to the rest of the 11,630 macrophage enhancers that do not bind ENOS in a −1kb/+1kb window (Fig.3g). The correlation between premarking and enhancer robustness was confirmed in other tissues: spleen, lung, cortex and bone marrow (Extended Data Fig.5a–d).
Figure 3. ESC TF binding is predictive of future enhancer activity.
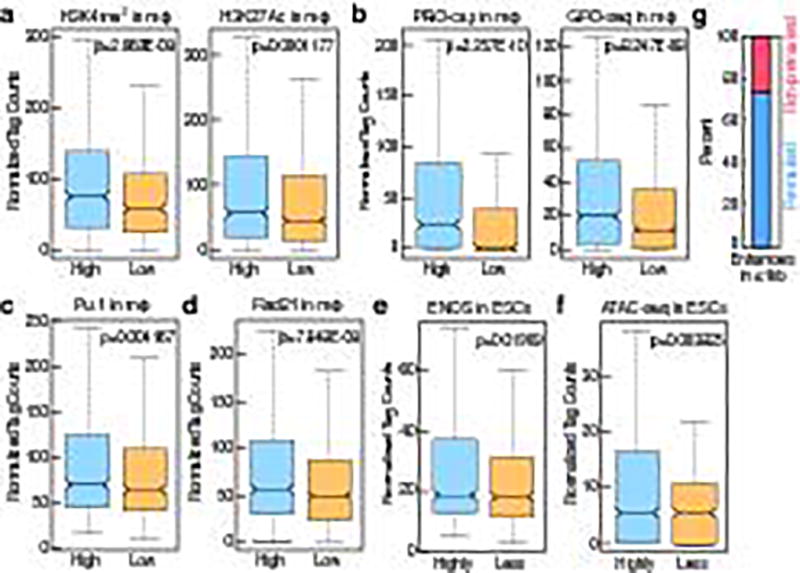
a, b, c, d, Comparison of the highest or lowest ~20% of enhancers selected based on ENOS binding and PRO-cap signal in ESCs, and the level of (a), H3K4me2 and H3K27Ac (b), PRO-cap and GRO-seq (c), Pu.1 d), Rad21 in the mature macrophage. e, f, Comparison of the highly or less ~20% of active macrophage enhancers selected based on GRO-seq signal of premarked macrophage enhancers in macrophage, and the level of (e), ENOS (f), ATAC-seq in ESCs. g, The percentage of functional macrophage enhancers in 6,775 enhancers which have ENOS in a −1kb/+1kb window (premarked enhancers) vs. 11,630 enhancers which don't have ENOS in a −1kb/+1kb window (non-premarked enhancers). In the box plots, line shows median, and box shows 25th and 75th percentiles. P-values are calculated using Welch’s two t-test.
We next investigated whether the binding of these factors in ESCs exerted a direct role on the ultimate activation of the cell-type-restricted enhancers in the mature macrophage, choosing premarked macrophage-restricted enhancers linked to coding target genes that would not be predicted to influence macrophage development. We first selected a putative enhancer near the Tlr1 locus, and then used CRISPR-Cas9 technology in ESCs to selectively delete the Esrrb binding site, followed by differentiation16 (Extended data Fig.6b). Mature macrophages were selected based on their ability to adhere to the non-adherent culture plates, as confirmed by expression of Cd11b and F4/80 (Extended data Fig.6a), permitting only a limited harvest of mature macrophages, thus precluding global genomic analyses. Significantly, three independently-derived individual clonal lines (#3, #10, #14) were sequence-proven to harbor a 8 bp deletion of the Esrrb site in the Tlr1 enhancer (Extended data Fig.6c,d). Consistent with the confirmed deletion, Esrrb binding in ESCs was decreased in these mutant clones compared to wild type (wt) clones (Fig.4a). The mutant clonal cells were differentiated to macrophages with an equivalent efficiency with the wt cells; ChIP-qPCR for Pu.1 and H3K4me2 was performed, and eRNA transcription was measured in the ESC-derived macrophages (ESDM). These analyses revealed that Pu.1 binding was inhibited, that eRNA transcription was lost, and that there was a consistent decrease in the level of the H3K4me2 with deletion of the Esrrb site (Fig.4b). To corroborate these findings, mutant clonal cells targeting another enhancer, Tnfaip3 enhancer, were constructed with either a 16 bp deletion (#26) or a 21 bp deletion (#45) encompassing the Esrrb binding site (Extended data Fig.6e–g), and differentiated to macrophage, finding that the reduction of Pu.1 recruitment, eRNA transcription and H3K4me2 levels in mutant ESDM correlated with inhibition of Esrrb binding in ESCs (Fig.4c,d). As a control, we tested Tlr1 eRNA transcription in Tnfaip3 mutant cells, observing no change (Extended data Fig.6h). As additional tests, two other loci, Prdx5 and Nod2, were similarly investigated (Extended data Fig.7a–b,e–f), again finding that enhancer activities defined by eRNA transcription were inhibited in mutant ESDM with loss of Esrrb binding in ESCs, but Prdx5 mutant enhancers (B11, F1, G11) exhibited the same level of Nod2 eRNA transcription as wt (Extended data Fig.7c–d,g). Because modifying the genomic locus could potentially result in different genetic events, we performed RNA-seq in the Tlr1 enhancer clonal cells (wt, #10, #14), finding that normal ESCs and clonal ESCs (wt, #10 and #14) exhibited the same pattern of transcription in the Tlr1 loci (Extended data Fig.6i).
Figure 4. Premarking in ESCs is functionally required for robust future enhancer activation.
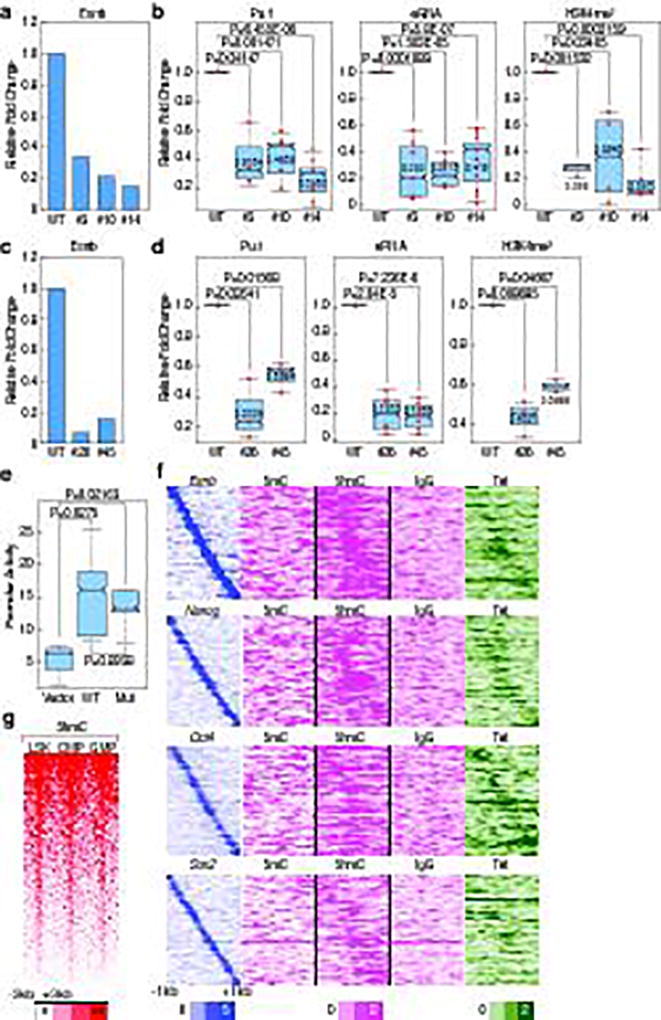
a, c, The binding of Esrrb in WT vs. mutant clones of (a), Tlr1 (#3, #10, #14) (c), Tnfaip3 (#26, #45) in ESCs. One example of representative data is added (n≥2 biological repeats). b, d, Pu.1 binding, eRNA transcription, and H3K4m2 level in WT vs. mutant clones of (b), Tlr1 (d), Tnfaip3 in ESDM. Each dot indicates a biological experiment (n≥3 biological repeats from two pooled different experiments, n=2 biological repeats from two pooled different experiments for #45 for H3K4me2 ChIP-qPCR). e, Promoter activities in native full length Tlr1 enhancer response to WT vs. Esrrb deleted mutant in Raw264.7 cells (n=5 biological repeats). f, Mapping of DNA methylation modification (5mC and 5hmC) and binding of Tet1 in 6,775 premarked-macrophage enhancers in a −1kb/+1kb window by centered on Pu.1. g, 5-hmC in LSK, CMP and GMP in 6,775 premarked enhancers in −3kb/+3kb window centered on Pu.1. In the box plots, line shows median, and box shows 25th and 75th percentiles. P-values are calculated using Welch’s two t-test. Data from published sources are listed in Supplementary Table 1. Primer sets are listed in Supplementary Table 2.
Enhancers harboring the Esrrb core site deletion were evaluated by luciferase reporter assay for any potential impairment of enhancer function compared to the wt enhancers in macrophage due to genomic sequence disruption, finding that it was equally competent to increase reporter expression as the wt enhancer in immortalized Raw 264.7 macrophage cells (Fig.4e), further evidence that inhibition effects in Tlr1 mutant ESDMs is due to inhibition of Esrrb binding in ESCs.
This functional linkage was further examined in neural precursor cell (NPC)-restricted enhancers, selecting enhancers in the Nek1 or Ankrd1 loci, referred to as N4 or N8, respectively. Sox2 and Esrrb binding in N4 and Esrrb binding in N8 were found, and Sox2 or Esrrb binding site, in N4 or N8, respectively, was targeted for deletion (Extended data Fig.8a,d). Clonal ESCs were differentiated to NPCs in N2B27 medium for 6 days, with >70% cells exhibiting the green signal caused by Sox1-GFP reporter knocked-in in ESCs17. NPC differentiation was further confirmed by qRT-PCR with ESC-specific genes (Oct4, Esrrb and Nanog) and NPC-specific genes (Sox1, FGF5, Nestin and Pax6) (Extended data Fig.8g). The eRNA transcription of N4 or N8 was inhibited in N4- or N8- mutant ESC-derived NPCs, respectively correlating with inhibition of Esrrb binding in ESCs (Extended data Fig.8b,e). Sox2 binding could not be assessed due to ineffectiveness of the anti-Sox2 IgG. The specificity of N4- or N8-mutant clones on inhibition of eRNA transcription was confirmed by testing eRNA transcription in the N8 locus in N4 mutant cells; or the N4 locus in N8 mutant cells (Extended data Fig.8c,f).
Collectively these analyses corroborate the functional importance of ESC factor premarking in both macrophage-restricted and NPC-restricted enhancers.
Poised enhancers, another class of well-studied cell-type-specific enhancers marked in ESCs, are often found near lineage-determining factors, often as super-enhancers18,19,20 exemplified by Pu.1. The 214 macrophage enhancers exhibit poised chromatin signatures (Extended Data Fig.1a) with binding of 2~4 ENOS factors in the core of their enhancers in the ESCs (Extended Data Fig.9a,b). For example, we noted that the Pu.1 gene has four clustered enhancers with poised chromatin signatures in ESCs. In contrast to the two enhancers (Enh2 and Enh3) active in mature macrophages, the other two (Enh1 and Enh4), bound by Esrrb and Oct4, are not (Extended Data Fig.9c,d). These two premarked enhancers in ESCs might participate in the early activation of Pu.1, which is known to exhibit a positive feedback loop on the two Pu.1-bound enhancers21.
A particularly intriguing question is how the marking of future cell-type-restricted enhancers might be “remembered” for their ultimate activation later in development. Based on the literature and analysis of the mRNA levels of the ENOS factors, the temporal pattern of disappearance of these factors virtually coincides with the appearance of the first lineage determining factors, Tal1, Gata2 and RunX1, followed by the appearance of Pu.1 and C/EBPα, which initiate macrophage enhancer activation program22 (Extended data Fig.10a). Another potential explanation is that binding of one of the ESC TFs on the future cell-type-restricted enhancers might be accompanied by a specific DNA demethylation event that serves to ensure that an enhancer remains accessible to TFs, the binding of which may be impaired by DNA methylation. We therefore analyzed available data in ESCs regarding DNA methylation and, interestingly, we found the 5-hmC mark and the enzyme responsible for that mark, TET1, to be present in the 6,775 premarked macrophage enhancers (Fig.4f), reflecting the previous observation of the presence of TET1 in a complex with Esrrb and Oct423. Interestingly, we further found that knockdown of Esrrb reduced 5-hmC levels in Esrrb-bound macrophage enhancers in ESCs (Extended data Fig.10b). To examine whether 5-hmC is maintained during the differentiation process, such that it could serve as a marker for molecular memory, we examined 5-hmC during hematopoiesis using published data24, and found that the 5-hmC was maintained during hematopoiesis (Extended data Fig.10c, Fig.4g). The enhancer histone marks, H3K4me1 and H3K27Ac, were studied during hematopoiesis25, but not found in ESCs, or even in mesoderm, being gained gradually early in hematopoesis (Extended data Fig.10c,d).
Investigation of the signature of cell-type-restricted enhancers in ESCs has provided a surprising insight into the process of genomic enhancer recognition in ESCs underlying cell-type-specific transcriptional programs. Furthermore, the marking of the cell-type-restricted enhancers in ESCs license the ultimate robust activation of the cell-type-restricted enhancer in the mature differentiated cell (Extended data Fig.10e).
METHODS
Cell culture
46c murine ESCs were kindly gifted by Austin Smith. Cells were grown in feeder free condition as previous described17. ESCs were maintained in serum culture medium with DMEM-KO(Invitrogen 10829-018) supplemented with 15% ESC qualified-fetal bovine serum (Omega, FB-05), 2 mM nonessential amino acids (Invitrogen 11140-050), glutamax (Invitrogen 35050061), penicillin/streptomycin (Invitrogen 15140122), 2-mercaptoethanol (Sigma, M7522) and 1000 U/ml LIF (ESGRO, ESG1106). ESCs in 2i medium were grown in N2/B27 media with 50% Neurobasal (Gibco 21103-049) and 50% DMEM/F12 (Invitrogen 21331-020), 2 mM nonessential amino acids, glutamax, penicillin/streptomycin, 2-mercaptoethanol, N2 supplement (Invitrogen, 175020-01), B27 (Invitrogen, 17504-001), 1000 U/ml LIF, and 2i (ESGRO, ESG1121). Mycoplasma contamination was regularly checked (Lonza, LT07-318). Peritoneal macrophages were obtained from 6–8 weeks of female C57BL/6J mice obtained from Jackson laboratory. Mice were injected with thiogycollate 3–4 days before collecting day, and cultured in RPMI supplemented with 10% FBS and penicillin/streptomycin for overnight before collection. All animal care and experimental procedures were in accordance with the University of California, San Diego research guidelines for the care and use of laboratory animals.
Antibodies
Antibodies used for ChIP/ChIP-seq included: Rad21 (Abcam, ab992), H3K4me2 (Upstate, 07-030), Pu.1 (Santa Cruz, sc-352) and H3K27Ac (Active Motif, 39133); for immuno-staining, F4/80-FITC (eBioscience, 11-4801-81) and CD11b-PE-Cyanine5 (eBioscience, 15-0112-81); for MeDIIP, 5-hmC (Active Motif, #39769).
Enhancer reporter assay
For construction of Tlr1 enhancer reporter plasmids, 600bp of Tlr1 locus spanning the Esrrb binding site was PCR amplified and cloned into pGL4.23 at the KpnI/XhoI sites downstream of the luciferase reporter gene controlled by a minimal promoter. Enhancer reporters were transfected into RAW264.7 macrophages using Lipofectamine 3000 (Invitrogen), using 200 ng of enhancer reporter and 5 ng of Renilla. Luciferase activity was measured 48 h after transfection using a Veritas microplate luminometer (Turner Biosystems) and normalized to Renilla activity to correct for differences in transfection efficiency. Experiment was performed five independent times. In the box plots, line shows median, and box shows 25th and 75th percentiles. P-values are calculated using Welch’s two t-test.
ESC differentiation to macrophage
ESC differentiation to macrophage was performed as described previously16. In brief, ESCs were trypsinized and transferred to bacteriological plates in macrophage differentiation medium A which has 15% L929 conditioned medium and 1ng/ml IL3 but lack of LIF for 6~8days to make embryoid bodies (EBs). EBs were transferred onto gelatin-coated tissue culture dishes for 3~4 days. After that, supernatants of adherents EBs containing floating macrophage progenitors were collected and plated onto bacteriological dishes for 7 days to obtain adherent macrophage in macrophage differentiation medium which has 15% L929 conditioned medium. Medium was readded to the adherent EB plates and macrophage progenitors were obtained every 2 days.
ESC differentiation to NPCs
ESC differentiation to NPCs was performed as described previously17. Briefly, ESCs were trypsinized, plated in gelatin-coated plates and cultured in N2B27 medium for 6 days. On Day6, >70% of green-signal expressing cells were observed, which indicates differentiation of NPCs, and cells were collected for further experimental analysis.
CRSIPR/Cas9 assay
The online software (http://crispr.mit.edu) was employed to design optimal candidate sgRNAs to target proximal regions of ESC TF motif and these sgRNAs were cloned to vector PX459 (Addgene #48139), which co-expresses sgRNA and Cas9. This plasmid was transfected into ESCs with Lipofectamine 2000 and 1.0 µg/ml puromycin was added 2 days after transfection. Cells were cultured for another 3 days then diluted to pick up single-cell-derived clonal lines. DNA was extracted from these cells and PCR was performed to amplify fragment containing sgRNA-targeted ESC TF (Esrrb or Sox2) motif. Sequencing was applied to identify Esrrb motif mutated/deleted clones. sgRNA sequences and primer sequences are listed in supplementary table 2.
RNA preparation and RT-qPCR
RNA was isolated using Trizol (Invitrogen) or RNeasy kit (Qiagen). RNA was reverse transcribed using SuperScript III Reverse Transcriptase kit (Invitrogen). Quantitative PCR was performed using SYBR Green Master Mix (Biorad). The experiments were repeated at least three times as biological replicates and P-values were obtained using Welch’s two t-test. Primers are listed in supplementary table 2.
RNA-seq
RNA-seq sequencing libraries were made from 1 µg of DNase-treated total RNA samples using TruSeq stranded mRNA Library Prep Kit (Illumina, RS-122-2101, RS-122-2102) and performed according to the manufacturer’s instructions. RNA-seq libraries were quantified with Qubit, clustered and sequenced using HiSeq 3000/4000 SR cluster kit (Illumina GD-410-1001) and HiSeq 3000/4000 SBS kit (Illumina FC-410-1001). RNA-seq reads were counted by HOMER software considering only exonic regions for RefSeq genes. The proximal macrophage-expressed genes of 6,775 macrophage-restricted enhancers were obtained by using these criteria: FC≥4, over 20 tags in macrophage, and visualized by heatmap with log2 transform. Gene ontology analysis and genetic association analysis was performed using Metascape (http://metascape.org).
PRO-cap
Pro-cap and library preparation for sequencing was described previously26. Nuclei were prepared from ~40 million cells for run-on assay. Run-on reactions were stopped and RNA was extracted with Trizol LS reagent (Invitrogen). Following DNase treatment, the RNA was fragmented. Biotin incorporated fragmented RNA was immunoprecipitated with anti-strepavidin beads (Invitrogen). Then the RNA was treated with 3′-dephosphorylated using polynucleotide kinase (Enzymatics) and precipitated. The RNA was dephosphorylated with calf intestinal phosphatase (NEB) and 5′-de-capped with tobacco acid pyrophosphatase (Epicentre). The reaction was stopped and RNA was extracted with Trizol LS, and libraries were prepared by ligating Illumina TruSeq-compatible adapters to the RNA 3′ and 5′ ends with truncated mutant RNA ligase 2 (K227Q) and RNA ligase 1 (NEB), respectively, followed by reverse transcription, cDNA isolation and PCR amplification. Final libraries were size selected on TBE gels to 60–110 bp insert size. PRO-cap results were trimmed to remove A-stretches originating from the library preparation. Each sequence tag returned by the Illumina Pipeline was aligned to the mm9 assembly using Bowtie2 allowing up to 3 mismatches. Only tags that mapped uniquely to the genome were considered for further analysis. Each sequencing experiment was normalized to a total of 107 uniquely mapped tags by adjusting the number of tags at each position in the genome to the correct fractional amount given the total tags mapped.
ChIP-seq
Cells were fixed with 2mM disuccinimidyl glutarate (DSG) (proteochem) for 45 mins and 1% formaldehyde for 10 mins, and quenched by glycine for 5 mins. Nucleus lysates were prepared by using sonication buffer with 1% SDS, and immunoprecipitation was performed with several different antibodies. After overnight incubation with antibodies, beads we re added for another 3hrs, and washing was performed. Reverse-crosslinking was done for overnight at 65°C and DNA was purified using QIAquick Spin column (Qiagen). For ChIP-seq, extracted DNA was ligated to adaptors and deep sequencing was performed with Illumina’s HiSeq 2000, 2500, or 4000 system according to the manufacturer’s instructions. The first 48bp for each sequence tag returned by the Illumina Pipeline was aligned to the mm9 assembly using BFAST or Bowtie2. Only uniquely mapped tags were selected for further analysis. The data was visualized by preparing custom tracks on the UCSC genome browser using HOMER. Genomic binding peaks for transcription factor were identified using the findPeaks.pl command from HOMER with 8-fold enrichment over the input sample, 4-fold enrichment over local background, a minimal tag number of 16, and normalization to 107 mapped reads per experiment. For histone marks, initial seed regions of 500bp were considered to calculate enriched reads. Regions of maximal density exceeding a given threshold with a FDR<0.001 were called as peaks. The peaks within ± 1,000bp apart from the RefSeq gene TSS site were considered to be promoter, and to focus the analysis on enhancers, peaks within 3kb of a gene promoter were filtered out.
4C-seq
Chromosome confirmation capture was performed as described previously12. Briefly, 10 million cells were cross-linked with 1% formaldehyde for 10 min and quenched with glycine for 5 min on ice. Soluble chromatin was incubated with 400 U of HindIII (NEB) overnight at 37°C, and then intramolecular ligations were performed using 1000 U of T4 DNA ligase (NEB) for 4hr at 16°C under dilution. Chromatin was decrosslinked at 65°C and then treated with RNase to remove RNA before purification using several phenol and phenol-chloroform extractions and ethanol precipitation. The second restriction digestion was also performed overnight at 37°C, using 50 U of DpnII (NEB). DNA was ligated overnight and purified as before and ultimately using Qiagen columns and subjected to inverse PCR (Expand Long-Range PCR system; Roche Diagnostics) using a first primer designed on the viewpoint near a HindIII site and a second outer primer designed beside the DpnII site. Both primers contained Illumina sequencing adapters and barcodes for multiplexing. PCR samples were purified using a Roche kit and quantified using a Qubit. We analyzed data using a bioinformatics pipeline previously described12.
MeDIP-Seq
Genomic DNA for hMeDIP was isolated from cells using Qiagen’s DNeasy Blood and Tissue Kit. Isolated genomic DNA was then fragmented to 100–300 bp through sonication using Diagenode’s Bioruptor platform and the size distribution was confirmed through gel electrophoresis. Barcoded adaptors for Illumina sequencing were added to 1µg of fragmented genomic DNA per experiment, using the NEBNext Ultra II DNA Library Prep Kit for Illumina, following manufacturer’s instructions. This protocol was stopped after adapter ligation and cleanup (and before any amplification steps), and the adapter ligated fragmented DNA was then used for hydroxy-methylated DNA pulldown. Denaturing, immune-precipitation, washing, and purification of hydroxy-methylated DNA were performed as described previously27, with the following modifications. One µl of 5-hmC antibody containing serum was used per IP reaction. Washing was done five times, with each wash for 15 minutes at 4°C. Next, DNA was eluted from beads using 200 µl digestion buffer, incubated overnight with Proteinase K at 50°C, and purified using Qiagen’s QIAquick PCR Purification Kit. Purified hydroxy-methylated genomic DNA was then further processed with NEBNext Ultra II DNA Library Prep Kit for Illumina at the step of PCR Enrichment of Adaptor Ligated DNA, as per manufacturer’s instructions, continuing with the entire protocol to prepare libraries for Illumina sequencing. Data was mapped to mm9 using Bowtie2 with standard settings and peaks were found by using MACS with default parameter.
ATAC-seq
ATAC-seq was performed as described previously28. Nuclei were prepared from 50,000 cells and the transposition reaction was performed for 30mins at 37°C. DNA fragments were amplified by PCR, purified and deep sequencing was performed with Illumina’s HiSeq 2000, 2500, or 4000 system according to the manufacturer’s instructions. ATAC-seq data was mapped to mm9 using Bowtie2 with standard settings. Tag directories with reads mapped to the mitochondrial chromosome filtered out were created. ATAC-seq peaks were identified using findPeaks.pl in HOMER with the settings: -style histone -size 75 -minDist 75 -minTagThreshold 6 -L 8 -F 8. BED files were created from Tag directories using the HOMER package.
Deep-sequencing
For all ChIP-seq, RNA-seq, 4C-seq, ATAC-seq, MeDIP-seq and PRO-cap, the DNA libraries were sequenced for 50cycles on Illumina’s HiSeq 200, 2500 or 4000 system according to the manufacturer’s instructions. Sequencing experiments were visualized by preparing custom tracks for the UCSC Genome browser.
Bioinformatic characterization of enhancers
The criteria for identifying Pu.1-H3K4me2 co-bound enhancer regions was that the distance from the center of a Pu.1 peak to the H3K4me2 peak-occupied region was ≤1kb. ESC factor bound macrophage enhancers were defined by calculating the distance ≤1kb between ESC factor peak spanning region and Pu.1 bound macrophage enhancers. The active ESC enhancers or active macrophage enhancers were defined using H3K27Ac (over 100 tags) to examine 12 different ESC factor binding. The functional macrophage enhancers were defined using GRO-seq (over 20 tags) in macrophage, and these enhancers were used to count number of functional enhancers in ENOS bound enhancer or non-bound enhancer in a −1kb/+1kb. Highly active or less active macrophage enhancers were created after excluding non-active macrophage enhancers by using GRO-seq (less than 5 tags) in macrophage. The comparison of tag intensity of ChIP-seq, ATAC-seq, PRO-cap and GRO-seq or distances between different categories were presented as boxplots by using normal scales. P-values were calculated using Welch’s two t-test. To profile the distribution of ESC factors surrounding Pu.1-H3K4me2 co-bound enhancer regions, ChIP-seq signals surrounding Pu.1 peak centers were separated by 40 bins, and then were sorted by the tag numbers based on the distance to Pu.1 peak center.
GEO Data
The GEO data sets used in this study are listed in Supplementary Table 1.
Data availability
All deep sequencing data is deposited in GEO under accession number GSE81681.
Extended Data
Extended data Figure 1. Features of macrophage-restricted enhancers in ESCs.

a, Pu.1+, H3K4me2+ macrophage enhancer profiles in murine ESCs. b, Normalized tag counts of ATAC-seq and DNase-seq in 18,405 random regions vs. 18,405 macrophage enhancers vs. 28,450 ESC enhancers. c, The percentage of macrophage enhancers or random region bound by ENOS in a −1kb/+1kb window d, Esrrb binding in random regions vs. macrophage enhancers vs. ESC enhancers in ESCs. e, ENOS binding profiles in 6,775 macrophage enhancers. f, UCSC genome browser screen shots show ENOS binding with chromatin openness but no enhancer marks, such as H3K4me2 and H3K27Ac in macrophage-restricted enhancers in ESCs. The Irg1 gene locus has two different macrophage-restricted enhancers bound by ESC TF. The blue bar indicates macrophage-restricted enhancers. In the box plots, line shows median, and box shows 25th and 75th percentiles. P-values are calculated using Welch’s two t-test.
Extended data Figure 2. ESC TFs bind in heart-, kidney-, N2A- restricted enhancers in ESCs.

a, Profiles of cell-type-restricted enhancers in heart, kidney, and N2A neuronal cells, with percent of unmarked, poised and active enhancers in ESCs. b, Target percentage of ENOS bound heart-, kidney- and N2A-restricted enhancers in ESCs. c, Heatmap of Esrrb, Nanog, Oct4 and Sox2 binding with −1kb/+1kb window, centered on each transcription factor in 17,561 heart-, 14,242 kidney- and 12,027 N2A cells-restricted enhancers in ESCs. d, Heatmap of ATAC-seq with −1kb/+1kb window, centered on each transcription factor in heart-, kidney- and N2A cells-restricted enhancers in ESCs. Data from published sources are listed in Supplementary Table 1.
Extended data Figure 3. The premarked macrophage-restricted enhancers do not interact with cognate target coding genes of macrophage in ESCs.

a, b, 4C-seq in ESCs and macrophage. Primer sets for 4C are listed in Supplementary Table 2. (a), 4C-seq analysis of the Il1a gene locus from the enhancer viewpoint in KLA-treated peritoneal macrophages or in ESCs. Black arrow represents the interaction frequency based on the trunc mean in 4 00kb window. Coordinate of macrophage putative enhancer in 5’ of Il1a is indicated with red box. (b), 4C-seq analysis of the Tnfaip3 gene locus from the enhancer viewpoint in KLA-treated Raw 264.7 macrophages or in ESCs. Black arrows indicate interactions based on linear mean in 1Mb window. Red box indicates coordinate of putative Tnfaip3 enhancer and blue circle indicates Tnfaip3 promoter. c, Heatmap of 634 closest macrophage expressed genes (FC≥4, over 20 tags in macrophage) of 6,775 premarked macrophage enhancers in ESCs and macrophage. Color indicates normalized tag counts with log2 transform. d, Go-term analysis of 634 closest macrophage expressed genes.
Extended data Figure 4. Features of 6,775 macrophage enhancers in ESCs are not altered by different ESC culture medium, 2i- or serum.

a, b, Heatmap of (a), H3K4me2 and H3K27Ac, and (b), ATAC-seq in 6,775 premarked macrophage enhancers and 28,450 ESC enhancers in 2i- or serum- cultured ESCs. It is centered on ENOS and visualized in a −1kb/+1kb window.
Extended data Figure 5. ENOS binding correlates with future enhancer activities.

a, b, c, d, Comparison of the ~10% “most” marked (high) and “least” marked (low) enhancers selected based on ENOS binding, and the level of H3K4me1 and H3K27Ac on these enhancers in the mature tissues- (a), Spleen (b), Lung (c), Cortex (d), Bone marrow. In the box plots, line shows median, and box shows 25th and 75th percentiles. Red dots indicate each value of H3K4me1 or H3K27Ac. P-values are calculated using Welch’s two t-test. Data from published sources are listed in Supplementary Table 1.
Extended data Figure 6. Premarking in ESCs is required for robust future macrophage enhancer activation.

a, Photomicrographs of macrophages differentiated from ESCs documented by F4/80 and CD11b staining. Scale bar=50 µM. b, Screenshot of the Tlr1 locus. The blue box corresponds to CRISPR/Cas9 target region. c, d, The putative Tlr1 enhancer mutant sequence diagram and DNA sequence documentation of several of the homozygous mutation clones, used for analysis. e, Screenshot of the Tnfaip3 locus. The blue box corresponds to CRISPR/Cas9 target region. f, g, The putative Tnfaip3 enhancer mutant sequence diagram and DNA sequence documentation of several of the homozygous mutation clones, used for analysis. h, Tlr1 eRNA transcription was tested in wt and mutant clonal cells (#26, #45) of Tnfaip3 enhancer. One representative experiment is plotted (n=2 biological repeats). i, UCSC genome browser shot image of RNA-seq in Tlr1 locus in normal ESCs and clonal mutant ESCs (wt, #10, #14). Primer sets are listed in Supplementary Table 2.
Extended data Figure 7. Premarking in ESCs is required for robust future macrophage enhancer activation.

a, b, The putative Prdx5 enhancer mutant sequence diagram and DNA sequence documentation of several of the homozygous mutation clones, used for analysis. c, Three mutant clones (B11, F1, G11) of the putative Prdx5 enhancer decreased level of Prdx5 eRNA transcription in ESDM (right). Each dot indicates one biological experiment (n=3 biological repeats from two pooled different experiments. n=2 biological repeats from two pooled different experiments for B11). Esrrb binding in ESCs is a representative experiment (left) (n=2 biological repeats). d, Nod2 eRNA transcription was tested in wt and mutant (B11, F1, G11) clonal cells of Prdx5 enhancer. One representative data is plotted (n=2 biological repeats). e, f, The putative Nod2 enhancer mutant sequence diagram and DNA sequence documentation of several of the homozygous mutation clones, used for analysis. g, Two mutant clones (D2, D12) of the putative Nod2 enhancer decreased level of Nod2 eRNA transcription in ESDM (right). Each dot indicates one biological experiment (n=3 biological repeats from two pooled different experiments. n=2 biological repeats from two pooled different experiments for D12). Esrrb binding in ESCs is a representative experiment (left) (n=2 biological repeats). In the box plots, line shows median, and box shows 25th and 75th percentiles. P-values are calculated using Welch’s two t-test. Primer sets are listed in Supplementary Table 2.
Extended data Figure 8. Premarking in ESCs is required for robust future NPC enhancer activation.

a, The putative Nek1 enhancer, referred to as N4, mutant sequence diagram and DNA sequence documentation of several of mutation clones (N4C3, N4C16), used for analysis. b, Two mutant clones (N4C3, N4C16) of the N4 enhancer decreased level of N4 eRNA transcription in NPCs (right). Each dot indicates one biological experiment. A representative experiment for Esrrb binding in ESCs is presented (left) (n=3 biological repeats for N4C3, n=2 biological repeats for N4C16). c, N8 eRNA transcription was tested in N4 mutant clones (N4C3, N4C16) to show specificity of N4 mutant cells on inhibition of N4 eRNA transcription. A representative experiment is presented (n=2 biological repeats). d, The putative Ankrd1 enhancer, referred to as N8, mutant sequence diagram and DNA sequence documentation of several of the mutation clones (N8C6, N8C12), used for analysis. e, Two mutant clones (N8C6, N8C12) of the N8 enhancer decreased level of N8 eRNA transcription in NPCs (right). Each dot indicates one biological experiment. Esrrb binding in ESCs is a representative experiment showing inhibition of Esrrb binding in Esrrb deleted N8 locus (left) (n=3 biological repeats). f, N4 eRNA transcription was examined to prove the specificity of N8 mutant cells on inhibition of N8 eRNA transcription. A representative data is presented (n=3 biological repeats). g, NPC differentiation was confirmed on day 6 after differentiation by testing expression of ESC-expressing genes and NPC-expressing genes. A representative experiment is presented (n=2 biological repeats). In the box plots, line shows median, and box shows 25th and 75th percentiles. P-values are calculated using Welch’s two t-test. Primer sets are listed in Supplementary Table 2.
Extended data Figure 9. ESC TFs binding in poised enhancer.

a, Profile of 214 macrophage enhancers, which have poised chromatin signatures in ESCs. b, ESC transcription factors (Oct4, Sox2, Nanog, Esrrb, E2f1, Tcfcp2l1, Zfx and Klf4) were analyzed in 129 macrophage enhancers to test binding of ESC TFs. These 129 macrophage enhancers were obtained based on the criteria; high H3K27me3 in ESCs and high H3K27Ac (over 20 tags) in macrophage. Data from published sources are listed in Supplementary Table 1. c, Schematic diagram of Pu.1 enhancers. d, Genome browser screenshot of the poised Pu.1 enhancers. Blue arrow indicates Esrrb binding region and red arrow indicates Oct4 binding region. Red box indicates four clustered putative Pu.1 enhancers.
Extended data Figure 10. Establishment and maintenance of 5-hmC on premarked enhancers and proposed model.

a, Esrrb, Oct4 and CEBP level is measured in four different time points through differentiation process from ESCs to macrophage. b, 5-hmC level in 6,775 premarked enhancers in sictrl vs. siEsrrb expressing ESCs. In the box plots, line shows median, and box shows 25th and 75th percentiles. P-values are calculated using Welch’s two t-test. c, Schematic of the hematopoietic differentiation stages25. d, H3K4me1 and H3K27Ac in 6,775 premarked enhancers were analyzed during hematopoietic differentiation- ESC, mesoderm, LT-HSC, ST-HSC, MPP, CMP, GMP and macrophage-, and presented in heatmap with −3kb/+3kb window at the center of Pu.1. Data from published sources are listed in Supplementary Table 1. e, Model of “premarked” lineage determining and terminal differentiation enhancer indicating that poised enhancers bind several ESC transcription factors, while the late-activated cell-specific enhancers are premarked based on binding of a single ESC transcription factor, causing chromatin opening, transcription of a ncRNA, and appearance of a 5-hmC mark in the area of the enhancer that may provide the molecular memory for what ultimately will be the Pu.1/C/EBPα core from which eRNAs will be transcribed.
Supplementary Material
Acknowledgments
The authors are grateful to Janet Hightower for assistance with figure preparation; H. Taylor for help with animal-based cell culture. M.G.R. is an investigator with the Howard Hughes Medical Institute. This work was supported by grants from NIH to M.G.R. (DK018477, DK039949, NS093066, and GM104459).
Footnotes
AUTHOR CONTRIBUTIONS
H.S.K. and M.G.R. conceived the project. H.S.K. performed most of the experiments reported, with particular contributions from W.M. (CRISPR-Cas9), Y.T. (PRO-cap) and E.D. (4C-seq); D.M. and Y.T. performed most of the bioinformatics analyses; T.S. performed the DNA methylation experiment; K.O. prepared samples for deep sequencing assays; Q.M. analyzed 4C-seq; additional experiments/methods and discussion were contributed by E.D., D.S-K. and M.F. H.S.K. and M.G.R. wrote the manuscript.
All the authors declare no conflict of interests.
References
- 1.Heintzman ND, et al. Histone Modifications at Human Enhancers Reflect Global Cell Type-Specific Gene Expression. Nature. 2009;459:108–112. doi: 10.1038/nature07829. [DOI] [PMC free article] [PubMed] [Google Scholar]
- 2.Miguel-Escalada I, Pasquali L, Ferrer J. Transcriptional enhancers: functional insights and role in human disease. Curr. Opin. Genet. Dev. 2015;33:71–76. doi: 10.1016/j.gde.2015.08.009. [DOI] [PMC free article] [PubMed] [Google Scholar]
- 3.Ong C-T, Corces VG. Enhancer function: new insights into the regulation of tissue-specific gene expression. Nat. Rev. Genet. 2011;12:283. doi: 10.1038/nrg2957. [DOI] [PMC free article] [PubMed] [Google Scholar]
- 4.Kaikkonen MU, et al. Remodeling of the enhancer landscape during macrophage activation is coupled to enhancer transcription. Mol. Cell. 2013;51:310–325. doi: 10.1016/j.molcel.2013.07.010. [DOI] [PMC free article] [PubMed] [Google Scholar]
- 5.Huang H-T, et al. A Network of Epigenetic Regulators Guide Developmental Hematopoiesis In Vivo. Nat. Cell Biol. 2013;15:1516–1525. doi: 10.1038/ncb2870. [DOI] [PMC free article] [PubMed] [Google Scholar]
- 6.Epelman S, Lavine KJ, Randolph GJ. Origin and Functions of Tissue Macrophages. Immunity. 2014;41:21–35. doi: 10.1016/j.immuni.2014.06.013. [DOI] [PMC free article] [PubMed] [Google Scholar]
- 7.Chen X, et al. Integration of external signaling pathways with the core transcriptional network in embryonic stem cells. Cell. 2008;133:1106–1117. doi: 10.1016/j.cell.2008.04.043. [DOI] [PubMed] [Google Scholar]
- 8.Boyer LA, et al. Core Transcriptional Regulatory Circuitry in Human Embryonic Stem Cells. Cell. 2005;122:947–956. doi: 10.1016/j.cell.2005.08.020. [DOI] [PMC free article] [PubMed] [Google Scholar]
- 9.Schmidt D, et al. A CTCF-independent role for cohesin in tissue-specific transcription. Genome Res. 2010;20:578–588. doi: 10.1101/gr.100479.109. [DOI] [PMC free article] [PubMed] [Google Scholar]
- 10.Phillips-Cremins JE, et al. Architectural protein subclasses shape 3-D organization of genomes during lineage commitment. Cell. 2013;153:1281–1295. doi: 10.1016/j.cell.2013.04.053. [DOI] [PMC free article] [PubMed] [Google Scholar]
- 11.Kagey MH, et al. Mediator and Cohesin Connect Gene Expression and Chromatin Architecture. Nature. 2010;467:430–435. doi: 10.1038/nature09380. [DOI] [PMC free article] [PubMed] [Google Scholar]
- 12.van de Werken HJG, et al. Robust 4C-seq data analysis to screen for regulatory DNA interactions. Nat. Methods. 2012;9:969–972. doi: 10.1038/nmeth.2173. [DOI] [PubMed] [Google Scholar]
- 13.Li W, et al. Functional Importance of eRNAs for Estrogen-dependent Transcriptional Activation Events. Nature. 2013;498:516–520. doi: 10.1038/nature12210. [DOI] [PMC free article] [PubMed] [Google Scholar]
- 14.Ying Q-L, et al. The ground state of embryonic stem cell self-renewal. Nature. 2008;453:519–523. doi: 10.1038/nature06968. [DOI] [PMC free article] [PubMed] [Google Scholar]
- 15.Kumar RM, et al. Deconstructing transcriptional heterogeneity in pluripotent stem cells. Nature. 2014;516:56–61. doi: 10.1038/nature13920. [DOI] [PMC free article] [PubMed] [Google Scholar]
- 16.Zhuang L, et al. Pure populations of murine macrophages from cultured embryonic stem cells. Application to studies of chemotaxis and apoptotic cell clearance. J. Immunol. Methods. 2012;385:1–14. doi: 10.1016/j.jim.2012.06.008. [DOI] [PubMed] [Google Scholar]
- 17.Ying Q-L, Stavridis M, Griffiths D, Li M, Smith A. Conversion of embryonic stem cells into neuroectodermal precursors in adherent monoculture. Nat. Biotechnol. 2003;21:183–186. doi: 10.1038/nbt780. [DOI] [PubMed] [Google Scholar]
- 18.Wang A, et al. Epigenetic priming of enhancers predicts developmental competence of hESC-derived endodermal lineage intermediates. Cell Stem Cell. 2015;16:386–399. doi: 10.1016/j.stem.2015.02.013. [DOI] [PMC free article] [PubMed] [Google Scholar]
- 19.Rada-Iglesias A, et al. A unique chromatin signature uncovers early developmental enhancers in humans. Nature. 2011;470:279–283. doi: 10.1038/nature09692. [DOI] [PMC free article] [PubMed] [Google Scholar]
- 20.Hnisz D, et al. Transcriptional super-enhancers connected to cell identity and disease. Cell. 2013;155 doi: 10.1016/j.cell.2013.09.053. [DOI] [PMC free article] [PubMed] [Google Scholar]
- 21.Will B, et al. Minimal PU.1 reduction induces a preleukemic state and promotes development of acute myeloid leukemia. Nat. Med. 2015;21:1172–1181. doi: 10.1038/nm.3936. [DOI] [PMC free article] [PubMed] [Google Scholar]
- 22.Lichtinger M, et al. RUNX1 reshapes the epigenetic landscape at the onset of haematopoiesis. EMBO J. 2012;31:4318–4333. doi: 10.1038/emboj.2012.275. [DOI] [PMC free article] [PubMed] [Google Scholar]
- 23.Gagliardi A, et al. A direct physical interaction between Nanog and Sox2 regulates embryonic stem cell self-renewal. EMBO J. 2013;32:2231–2247. doi: 10.1038/emboj.2013.161. [DOI] [PMC free article] [PubMed] [Google Scholar]
- 24.Han D, et al. A Highly Sensitive and Robust Method for Genome-wide 5hmC Profiling of Rare Cell Populations. Mol. Cell. 2016;63:711–719. doi: 10.1016/j.molcel.2016.06.028. [DOI] [PMC free article] [PubMed] [Google Scholar]
- 25.Lara-Astiaso D, et al. Chromatin state dynamics during blood formation. Science. 2014;345:943–949. doi: 10.1126/science.1256271. [DOI] [PMC free article] [PubMed] [Google Scholar]
- 26.Kwak H, Fuda NJ, Core LJ, Lis JT. Precise Maps of RNA Polymerase Reveal How Promoters Direct Initiation and Pausing. Science. 2013;339:950–953. doi: 10.1126/science.1229386. [DOI] [PMC free article] [PubMed] [Google Scholar]
- 27.Thu KL, et al. Methylated DNA Immunoprecipitation. J. Vis. Exp. JoVE. 2009 doi: 10.3791/935. [DOI] [PMC free article] [PubMed] [Google Scholar]
- 28.Buenrostro JD, Giresi PG, Zaba LC, Chang HY, Greenleaf WJ. Transposition of native chromatin for multimodal regulatory analysis and personal epigenomics. Nat. Methods. 2013;10:1213–1218. doi: 10.1038/nmeth.2688. [DOI] [PMC free article] [PubMed] [Google Scholar]
Associated Data
This section collects any data citations, data availability statements, or supplementary materials included in this article.
Supplementary Materials
Data Availability Statement
All deep sequencing data is deposited in GEO under accession number GSE81681.