

Abstract
Immunopeptidomes promise novel surface markers as ideal immunotherapy targets, but their characterization by mass spectrometry (MS) remains challenging. Until recently, cell numbers exceeding 109 were needed to survey thousands of HLA ligands. Such limited analytical sensitivity has historically constrained the types of clinical specimens that can be evaluated to cell cultures or bulk tissues. Measuring immunopeptidomes from purified cell subpopulations would be preferable for many applications, particularly those evaluating rare, primary hematopoietic cell lineages. Here, we test the feasibility of immunopeptidome profiling from limited numbers of primary purified human regulatory T cells (TReg), conventional T cells (Tconv) and activated T cells. The combined T-cell immunopeptide dataset reported here contains 13,804 unique HLA ligands derived from 5,049 proteins. Of these, more than 700 HLA ligands were derived from 82 proteins that we exclusively identified from TReg-enriched cells. This study 1) demonstrates that primary, lineage-enriched T cell supbopulations recovered from single donors are compatible with immunopeptidome analysis; 2) presents new TReg-biased ligand candidates; and 3) supports immunopeptidome surveys value for revealing T cell biology that may not be apparent from expression data alone. Taken together, these findings open up new avenues for targeting TReg and abrogating their suppressive functions to treat cancer.
Keywords: antigen presentation, MHC, mass spectrometry, T-cells, FOXP3
1 Introduction
T cells are the foundation of adaptive immune responses, and achieve specificity for targeting MHC-presented antigens via their unique, clonally selected T cell receptors (TCR) [1]. Regulatory T cells (TReg) function as critical inhibitory immunoregulatory cells [2–4] and have been reported to be increased in tumor-bearing individuals, restraining immune-mediated anti-tumor cytotoxicity [5]. Increased TReg in solid tumors, including ovarian carcinoma [6,7], pancreatic cancer [8,9], lung cancer [10] and glioblastoma [11] have been associated with poor response to standard chemotherapy and diminished survival outcomes [5,12,13]. Increased TReg numbers have also correlated with negative outcomes following immunotherapy treatment of malignant melanoma [14]. Hence, targeted approaches to manipulate TReg are of great interest to help optimize anti-tumor immune responses and complement our current armamentarium of cancer therapeutics.
Several pre-clinical and clinical studies have tried to therapeutically eliminate TReg populations [15,16]. TRegs are best defined by expression of the transcription factor Forkhead box P3 (FOXP3). This forkhead/winged-helix family transcription factor is critical to TReg development and function, but its intranuclear location has constrained FOXP3’s immunotherapeutic utility. Although low IL127 and high CD25 (IL2 receptor) surface expression on CD4 T cells can be used to experimentally enrich TReg cells [17], the lack of TReg defining surface markers has limited in vivo depletion approaches.
Since major histocompatibility complex (MHC) class I molecules present peptide antigens derived from degraded intracellular proteins, essential cell fate marker proteins like FOXP3 can be detected by circulating lymphocytes despite their exclusive intracellular localization [3,4]. In support of this notion, successful recruitment of FOXP3-specific cytotoxic TReg cells (CTLs) by FOXP3-expressing dendritic cells (DCs) demonstrated that anti-TReg vaccinations could be possible [18]. Furthermore, spontaneous cytotoxic immune responses targeting FOXP3+ cells have been identified from the peripheral blood of healthy donors and cancer patients [19]. Although FOXP3 expression traditionally characterizes TReg, FOXP3 expression can also be induced in activated CD4+/CD25- Tconv. Such induction results in hyporesponsive T cells, suggesting a cell-intrinsic regulatory mechanism to avert unopposed T cell activation. Transient expression of FOXP3 in activated T cells represents overlapping properties shared by TReg and activated T cells and supports dissecting differences at all levels, including the immunopeptidome, to ultimately permit therapeutic targeting of TReg while sparing Tconv [20–22].
Here, we apply recent advances in immunopeptide enrichment and mass spectrometry [23–25] to directly investigate T-cell immunopeptidomes with a particular focus on TReg. Importantly, since few studies have measured immunopeptides from scarce primary cell subpopulations [26], our primary goal was to test the feasibility of profiling HLA-ligandomes derived from TReg and Tconv purified from healthy donors. The data we generated further suggest hundreds of candidate TReg-specific HLA ligands. More broadly, these data support immunopeptidomes’ ability to characterize distinct T cell lineages based on which proteins are presented, and how they are post-translationally modified.
2 Materials and methods
2.1 Cell purification
Human peripheral blood leukocytes were obtained from donors with leukocyte reduction system (LRS) chambers. De-identified donor blood was purchased from the Stanford blood center, following collection with informed consent, in accordance with institutional guidelines. Human TReg and CD4+ Tconv cells were enriched using immunomagnetic bead separation from a total of 18 healthy donors (Fig. 1). All donors were selected for the HLA-A2 allele in order to constrain inter-individual antigen peptide presentation diversity. Approximately 5×10⁸-1×10⁹ peripheral blood mononuclear cells (PBMCs) were isolated from LRS chambers using standard FICOL techniques (Ficoll-Paque PLUS, GE Healthcare, Pittsburgh, USA). Magnetic bead positive selection was subsequently used to isolate TReg using the Dynabead Regulatory CD4+/CD25+ T Cell Isolation Kit (ThermoFisher Scientific, USA) denoted as workflow 1 (Fig. 1) or EasySep Human CD4+/CD127low/CD25+ Regulatory T Cell Isolation Kit (StemCell Technologies, Vancouver, Canada) denoted as workflow 2 (Fig. 1). One T-cell bead isolation kit was used per donor blood specimen with exception of donor #2 for which we doubled isolation reagent by using two kits, resulting in over 60 % increased CD4+/CD25+ recovery. All T cell isolation procedures were performed according to the manufacturers’ guidelines.
Figure 1.
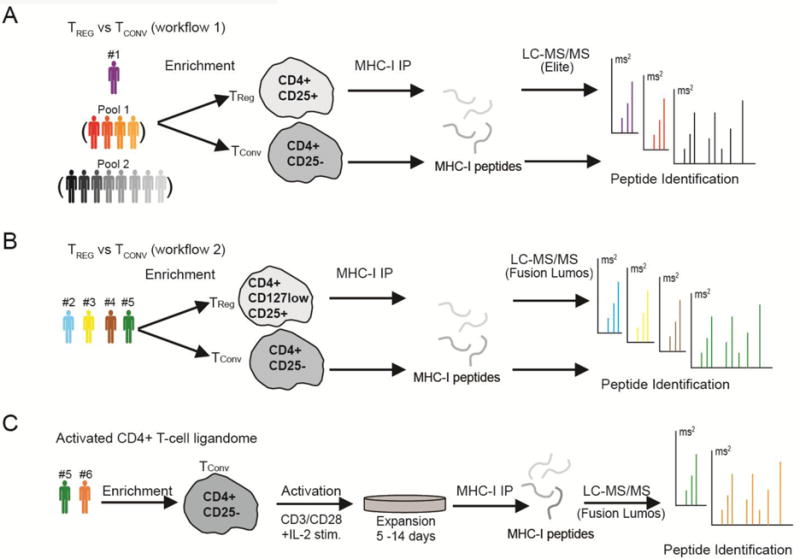
Experimental workflows for T cell enrichment and immunopeptide identification. (A) TReg enrichment using CD4+/CD25+ selection (Dynabead Regulatory T Cell Isolation Kit) and immunopeptidome profiling of one individual donor (denoted #1) and pooled donor samples with the Orbitrap Elite. The pooled samples were generated before peptide purification by combining cells from either four donors (Pool 1) or eight donors (Pool 2). (B) TReg enrichment using CD4+/CD127low/CD25+ selection (EasySep Human Regulatory T Cell Isolation Kit) and immunopeptidome profiling of individual donors using the Fusion Lumos. (C) Conventional T-cell enrichment using the CD4+/CD25- fraction from TReg kit, activation, expansion and immunopeptidome profiling with the Orbitrap Fusion Lumos.
2.2 Flow cytometric analysis
Prior to and following magnetic bead isolation procedures, T cells were analyzed using flow cytometry to assess the efficiency of T-cell isolation procedures. To permit T cell phenotyping, cells were washed and then stained for surface expression of CD4 (BD Pharmingen, San Diego, USA), CD25 (BD Biosciences, San Jose, USA) and CD127 (clone hIL-7R-M21) (BD Pharmingen, San Diego, USA) followed by intra-cellular staining for FOXP3 (Clone 236A/E7) (BD Pharmingen, San Diego, USA). Flow cytometry was performed using an LSR II flow cytometer (BD Biosciences, San Jose, USA). Cytobank software was used to analyze data generated from flow cytometry. Following bead enrichment, cells were harvested and washed twice with ice-cold PBS, snap-frozen in liquid nitrogen and then stored at −80 until further sample preparation.
2.3 T-cell activation
CD4+/CD25- T cell fractions isolated using tandem positive and negative magnetic bead selection (EasySep Human CD4+/CD127low/CD25+ Regulatory T Cell Isolation Kit, StemCell Technologies, Vancouver, Canada) from two healthy donors were activated and expanded in vitro using Human T-activator CD3/CD28 Dynabeads (Life Technologies, Carlsbad, USA) at a ratio of 2:1 cells:beads and high dose (500 IU/mL) recombinant Interleukin-2 (IL-2) (Peprotech, Rocky Hill, NJ). Cells were maintained in RPMI 1640 medium with L-glutamine (Corning Cellgro, Mediatech Inc., Manassas, VA, USA) supplemented with 10 % fetal bovine serum (HyClone FetalClone III, South Logan, UT, USA), 2% of Penicillin-Streptomycin and 2% L-Glutamine (Corning Cellgro, Mediatech Inc., Manassas, VA, USA). One donor underwent longer expansion and secondary CD3/CD28 activation on day 10 following the initial activation to achieve a larger final cell population for mass spectrometry analysis. Hence, cells were harvested five (single stimulation) or 14 (double stimulation) days after the initial activation. Harvested cells were washed twice with ice-cold PBS; an aliquot was set aside for flow cytometry analysis, and the remainder was snap-frozen in liquid nitrogen and stored at −80 until further sample preparation.
2.4 MHC-class I immunopeptidome purification
MHC-class I immunopeptidomes were extracted from five single-donor T cell preparations, two pooled T cell preparations, and two ex-vivo activated and expanded T cell preparations (Figure 1). In total, 15 MHC-class I ligandome data sets were generated. MHC class-I molecules were isolated and the associated peptides extracted as previously described [27,28]. In brief, cells were lysed for 20 min on ice in 20 mM Tris-HCl (pH 8), 150 mM NaCl, 1 % (w/v) CHAPS, 0.2 mM PMSF, 1x Halt™ Protease and Phosphatase Inhibitor Cocktail (Thermo Fisher Scientific, Rockford, USA) supplemented with complete protease inhibitor cocktail (Roche, Mannheim, Germany). The lysate was centrifuged (2×30 min, 13,200 rpm at 4°C) and the resulting supernatant was precleared for 30 min using rProtein A Sepharose fast-flow beads (GE Healthcare, Uppsala, Sweden). Precleared lysate was incubated with the pan HLA-A-, B-, and C- antibody W6/32 [29] coupled to rProtein A Sepharose fast-flow beads for 5h at 4°. Following the immune-capture of MHC-class I molecules, beads were washed with TBS (pH 7.4) and peptides were eluted from the purified MHC-molecules using 10% acetic acid. The eluate was then passed through a 10 kDa MWCO size filter, followed by a concentration step using vacuum centrifugation, before being desalted on C18 based STAGE tips [30] and stored at −80°C until LC-MS/MS analysis.
2.5 Mass Spectrometry Analysis of HLA Peptides
Isolated HLA peptides were reconstituted in 10-12 μl of 0.1 % formic acid and analyzed on a LTQ Orbitrap Elite mass spectrometer (Thermo Fisher Scientific, Bremen, Germany) or a Fusion Lumos mass spectrometer (Thermo Fisher Scientific, San Jose, USA). Peptides were separated by capillary reverse phase chromatography on a 20 cm reversed phase column (100 μm inner diameter, packed in-house with ReproSil-Pur C18-AQ 3.0 m resin (Dr. Maisch GmbH)). The Orbitrap Elite was equipped with an Eksigent ekspert nanoLC-425 system (Sciex, Framingham, USA) using a two-step linear gradient with 4–25 % buffer B (0.1% (v/v) formic acid and 5% DMSO in acetonitrile) for 120 min followed by 25-40 % buffer B for 30 min. The Fusion Lumos was equipped with a Dionex Ultimate 3000 LC-system and used a similar two-step linear gradient with 4–25 % buffer B (0.1% (v/v) formic acid in acetonitrile) for 80 min followed by 25-45 % buffer B for 10 min. Each of five peptide samples measured with the Orbitrap Elite system was analyzed three times with complementary acquisition methods as previously described [28] (Fig. 1A). Ten samples analyzed with Fusion Lumos system (Fig. 1B - 1C) were acquired in top speed data dependent mode with a duty cycle time of 3 s. Full MS scans were acquired in the Orbitrap mass analyzer with a resolution of 120 000 (FWHM) and m/z scan range of 340-1540. Precursor ions with charge state 1-5, intensity threshold above 50,000 and masses ranging from 700-1800 Da were selected for fragmentation using higher-energy collisional dissociation (HCD) with quadrupole isolation, isolation window of 1.6 m/z and normalized collision energy of 30%. HCD fragments were analyzed in the Orbitrap mass analyzer with a resolution of 15,000 (FWHM). Fragmented ions were dynamically excluded from further selection for a period of 30 seconds. Each sample was measured twice, once with above described HCD method and a second analysis using a method which toggled HCD and electron transfer dissociation (ETD) fragmentation modes for each isolated precursor using the following parameters for ETD: ions with charge states 1-2 were excluded, calibrated charge dependent ETD parameters were enabled and 25% of supplemental collision energy was used. The AGC target was set to 400000 and 50000 for full FTMS scans and FTMS2 scans. The maximum injection time was set to 50 ms and 200 ms for full FTMS scans and FTMS2 scans. Synthetic peptides were synthesized (ELIM Biopharm, Hayward, USA) followed by LC-MSMS analysis using the Fusion Lumos with same settings as previously described for validation of five experimentally observed peptides.
2.6 Computational Identification of Immunopeptidomes from Mass Spectra
All tandem mass (MS/MS) spectra were processed using Proteome Discoverer (v 2.2.0.388) and queried against a “target-decoy” sequence database [31] consisting of the human proteome Swiss-Prot database (20,214 entries, manually reviewed) with added common contaminants (e.g. keratins and staphylococcus protein A) using the SEQUEST search engine [32]. SEQUEST search parameters were set as follows: spectrum matching was set to one for b and y ions for HCD and c and z for EThcD. Parent mass error tolerance was set to 10 ppm and fragment mass error tolerance to 0.02 Da. Enzyme specificity was set to none, peptide length was set to 7-25 amino acids, and oxidation of methionines and deamidation (N,Q), cysteinylation, and phosphorylation (S, T, Y) were considered as variable modification. High-confidence peptide identifications were selected at a 1% false discovery rate using the Percolator algorithm with a validation based on the q-value [33]. All raw data and interpreted MHC immunopeptidome data have been deposited within the PRIDE [34] repository under accession PXD007860. Motif analysis with GibbsCluster 2.0 [35] was performed on donor-specific data subsets. The analysis was performed with default settings for peptides of variable lengths (between 8-13 amino acids long) and a motif length of 9 amino acids. In parallel, motif identification was performed using Motif-Z (manuscript in preparation; https://research.cchmc.org/motifZ/home/) using the flexible-length parameter.
3 Results and discussion
3.1. Study design and T-cell enrichment
TReg and Tconv cells were enriched from individual or pooled donors followed by HLA class I ligandome isolation and analysis by reversed phase LC-MS/MS using two purification schemes and mass spectrometry instruments (Fig. 1A - 1B). TReg enriched from five individual donors ranged from 4×10⁶ to 1.5×10⁷ cells with 43-90% TReg purity, as assessed by FOXP3 staining (Supplementary Tables 1-2, Supplementary Figure 1). We found that additional negative selection based on low CD127 expression increased TReg purity up to 90 % (Supplementary Table 1). To obtain larger donor-derived T cell numbers, we further activated and expanded two donors’ primary Tconv ex vivo. Isolated Tconv were stimulated with CD3/CD28 and high dose IL-2 for 5 or 14 days prior to HLA-ligandome analysis (Fig. 1C). The Tconv activation and expansion procedure increased cell numbers by up to ten fold (Supplementary Table 2) and upregulated FOXP3 and CD25 relative to the post-isolation CD4+/CD25- cells (Supplementary Fig. 1B).
3.2. TReg immunoprofiling is feasible from single donors, but depends on input cell quantities
We identified a substantial number of HLA ligands from enriched TReg cells (1,941 total, average of 322 unique peptides per experiment). We identified far more unique HLA ligands from enriched Tconv (6,456 total, average of 1,286 per experiment), and expanded Tconv (7,767 total, average of 4,038 per experiment) cells (Table 1 and Fig. 2) however, corresponding with up to 10-fold more cellular input. Despite these varied amounts of cell and HLA ligand yields, all three experimental sets yielded similar peptide length distributions (Fig. 2A, Supplementary Fig. 2), which were consistent with canonical HLA class I ligand lengths, as reported in the Immunoepitope Database (IEDB) [36]. Predicted binding affinities further supported the peptides we identified as bona fide HLA class I ligands. In accordance with all donors participating in this study expressing the HLA-A02:01 allele, we found that over 14 % of all 9-mer peptides we identified were predicted to bind HLA-A02:01 with modest- to strong binding affinity by NetMHC 4.0 [37]. This proportion is consistent with a theoretical HLA-A02:01 binding proportion of 17% (Supplementary Fig. 2). These length distribution and peptide sequence features support the 13,804 unique peptides originating from 5,049 source proteins we identified from all 15 datasets we profiled (Supplementary Table 4) as being enriched for bona fide HLA class I presented peptides. Motif analysis of the peptides identified for donor #4 and #5 suggested additional HLA-alleles for these individuals (Supplementary Fig 3-4).
Table 1.
Number of unique HLA-I peptides identified.
| Workflow 1 | TREG | TCONV |
|---|---|---|
| Sample | CD4+/CD25+ | CD4+/CD25- |
|
| ||
| Donor #1 | 25 (0)† | NA |
| Pool 1 (4 donors) | 122 (1) | 1221 (1) |
| Pool 2 (8 donors) | 259 (0) | 3337 (2) |
|
| ||
| Total Peptides | 373 (1) | 4048 (3) |
| Workflow 2 | TREG | TCONV |
|---|---|---|
| Sample | CD4+/CD127low/CD25+ | CD4+ /CD25- |
|
| ||
| Donor #2 | 1163 (1) | 1758 (7) |
| Donor #3 | 223 (0) | 50 (3) |
| Donor #4 | 416 (2) | 1168 (9) |
| Donor #5 | 43 (0) | 179 (1) |
|
| ||
| Total Peptides | 1676 (3) | 2988 (19) |
| Activated / Expanded | ||
|---|---|---|
|
| ||
| Sample | Post activation | |
| Donor #5 | 2428 (10) | |
| Donor #6 | 5648 (44) | |
|
| ||
| Total Peptides | 7767 (52) | |
Number of identified HLA-I phosphopeptides listed in parentheses.
Figure 2.

Similarities and differences between immunopeptidomes identified from three different T cell subpopulations. (A) Peptide length distribution based on all peptides identified for all samples collected with all workflows outlined in Fig. 1. (B) Increased immunopeptidome sequence depth with increased input of cells. Only data from individual donors were included since precise cell counts were not available from the pooled samples described in Fig. 1. The best-fit regression trend line suggests ligandome depth increases log-linearly with input cell amounts. (C) Towards T cell subpopulation immunopeptidomes. Venn diagrams at peptide and protein levels comparing TReg, Tconv, and expanded Tconv. Known T cell regulators including IKZF1, LCP1, CARD11 and ITK were among 653 proteins presented in all three cell states (see text). (D) Heat maps comparing TReg and TConv protein presentation from four individual donors (top), summed presentation across all these donors (“Total”; middle), and 58 differentially regulated cellular proteins (bottom) as reported by Procaccini et al. (2016) [43]. The total number of unique MHC-presented peptide sequences (distinguishing unmodified from post-translationally modified peptides) identified per protein accession contributed to the displayed counts. These heat maps were limited to samples processed with workflow 2 to enable direct comparisons. A minimum of three counts (over the four donors) was required per T cell class, resulting in a total of 318 displayed proteins. All proteins are listed in Supplemental Table 3. (E) Differential presentation between TReg, (green filled circles) and Tconv (blue open circles) is apparent despite deeper Tconv immunoprofiling depth. Peptide abundances were normalized by dividing each peptide’s chromatographic area by the sum of all peptides’ areas from the indicated specimen. Values are shown for donor#4. (F) Differential presentation between (TReg and Tconv) for the 316 proteins illustrated as functional protein association networks using the STRING database. STRING mapped 74 of 76 core proteins (TReg and Tconv); 53 of 55 TReg proteins; and 184 of 187 Tconv proteins. Ribosome subunits and their interacting proteins were colored red. RNA binding proteins are colored yellow (Core interaction map). For protein identities, see expanded version of the panels in Supplementary Figure 5.
The various T cell preparation methods we evaluated (Fig. 1) helped us develop a stronger sense for the dependency between input cell numbers and corresponding peptide identification rates (Fig. 2B). Not surprisingly, we found that number of input cells related in to the number of unique peptide ligands each experiment yielded in a log-linear fashion (R2 = 0.76), such that a ten-fold increase in unique peptides could be achieved with just 5-fold more cellular input. These data further suggest that on average, 37.5 million cells should be sufficient to produce a ligandome of at least 1000 unique peptides.
3.3. Proteins that shape T-cell-specific cell biology contribute to T cell immunopeptidomes
The 5,049 proteins identified in this study comprise a mixture of proteins frequently presented broadly as HLA ligands across many cell types, proteins with T cell restricted presentation, and proteins that are exclusively presented within each of the three conditions we examined. We designated 653 proteins identified in all three experimental conditions as antigens commonly presented among T cells (Fig. 2C). Several members of this “core” protein set have well-characterized T-cell specific functions. These include the IKAROS family zinc finger (IKFZ1) [38], Lymphocyte cytosolic protein 1 (LCP) [39], Caspase recruitment domain family, member 11 (CARD11) [40], and IL2-inducible T-cell kinase (ITK)[41]. IKAROS is a zinc finger transcription factor critical for T-cell development [38]. LCP plays a role in the activation of T-cells [39]. CARD11 is involved in the costimulatory signal essential for T- cell receptor (TCR)-mediated T-cell activation. The ITK tyrosine kinase is an important modulator of T-cell signaling and function by regulate phospholipase C-γ [41]. Off-target ITK inhibition by the Bruton’s tyrosine kinase (BTK) inhibitor, Ibrutinib, underlies the immunomodulatory effects of this agent [42] and implicates ITK as having functional relevance to T cell responsiveness. Identifying HLA ligands derived from these important intracellular T-cell proteins suggests they could be further studied and exploited to facilitate peptide-driven immuno-selection and immunomodulation.
We generated substantially deeper immunopeptidomes from Tconv and expanded T-cells relative to TRegs (Fig. 2C). Based on this discrepancy, we prioritized 82 antigen source proteins as being TReg-specific candidates since they were identified only from TRegs and not either of the larger data sets. These include peptides identified from the 60S ribosomal protein L21; from the E3 ubiquitin-protein ligases TOPORS, and TRIM33; from the calprotectin subunits S100 A8 and A9; from Regulator of G-protein signaling 18 (RGS18), and HLA class II histocompatibility antigen, DP alpha 1 (Fig. 2C–2E, Supplementary Table 4).
Other proteins we identified as shared, but differentially presented sources for TReg and Tconv HLA ligands could also serve as valuable TReg markers. For example, TRegs and Tconv may have distinct metabolic states, as supported by the recent observation of up-regulated glycolysis-associated proteins in TRegs relative to Tconv cells [43]. Thus, it might be expected that glycolytic proteins could be presented in both T cell states, but more strongly among TRegs. Of 318 most frequently-presented HLA ligand source proteins from four donors, 58 were recently reported as being differentially expressed between TRegs and Tconv (Fig. 2D) [43]. For example, aldolase A (fructose-bisphosphate aldolase) was previously shown to be upregulated in TRegs. This agrees with the relatively high presentation of the peptide ALSDHHIYL we observed among donor # 4′s TRegs and not their Tconv (Fig. 2D–2E).
Distinctions between the most frequently identified TReg and Tconv peptides were further apparent from protein association networks [44] (Fig. 2F). For example, we observed substantially more peptides from ribosomal proteins in TRegs than Tconv (Fig. 2F) and from one TReg profiled samples in particular (donor #2) (Fig. 2D). Although ribosomal proteins are known to be enriched among HLA-ligandomes, we found that several (e.g., RPL13 and RPL7A) agreed with previously reported increased protein abundance for TRegs [43]. However, other ribosomal proteins (RPS3A and RPS8; Fig. 2D–2E) were not consistent with a previous observation of lower expression in TReg [43]. Taken together, however these data support global immunopeptidome presentation differences between TRegs and Tconv: The 82 proteins that were only identified from TReg ligandomes and 64 proteins more that showed a strong biased presentation for TRegs or activated T cells could serve as sensitive cell-type markers in future studies.
3.4. FOXP3 HLA ligands: differentially presented TReg surface markers
Although it was not necessarily identified from most individual donors and therefore excluded from Fig. 2D, FOXP3-derived HLA ligands are noteworthy from this study. In particular, we identified three FOXP3 derived peptides from four of 15 samples, including two from enriched TRegs (Fig. 3A–3B, Supplementary Table 4). This observation aligns with reports that FOXP3 is transiently expressed upon Tconv activation [20] in addition to its canonical expression by inhibitory TReg. For example, the FOXP3 peptide ATWKNAIRH was substantially more abundant in donor #4′s TRegs (top 39th percentile) than the same peptide derived from the same donor’s Tconv (bottom 6th percentile) (Fig. 2E). Although these data indicate that FOXP3 HLA ligands can be strongly presented by TReg cell populations, they also suggest they can report transient cell states that may escape bulk transcription or proteomic analysis.
Figure 3.
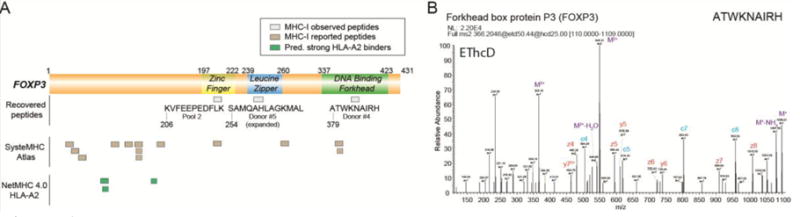
FOXP3 derived MHC class 1 ligands (A) FOXP3 derived peptides are depicted in relation to the corresponding protein domains. KVFEEPEDFLK was predicted to be a weak binder to HLA-A03:01, ATWKNAIRH as a weak binder to HLA- B15:17 and SAMQAHLAGKMAL as a weak binder to both HLA-B07:02 and HLA-B39:01 (NetMHC 4.0). Peptides reported and observed in the SysteMHC Atlas database are depicted with tan boxes. All the peptides in the SysteMHC Atlas were derived from a single malignant melanoma data set [46]. NetMHC 4.0 predicts FOXP3 to contain three peptides as strong binders to HLA-A2 and these peptides are depicted with green boxes. (B) MS/MS spectrum of the FOXP3-derived peptide ATWKNAIRH using EThcD fragmentation. This peptide was identified from both TReg and Tconv derived from donor #4.
To further estimate the influence HLA binding affinities might have on FOXP3 presentation, we determined that three potential FOXP3-derived peptides which are likely to be HLA-A02 with high affinity (NetMHC 4.0 [37]). However none of these were observed in any of our donors (Fig. 3A). Rather than being strong HLA-A02 ligands, the peptides noted in Fig. 3A could either weakly bind HLA-A02, or bind other HLA alleles expressed by the donors. Although precise HLA allele typing data were unavailable for the donors used in this study, motifs discovered from two of the most deeply sequenced donors’ immunopeptide repertoires indicated a small number of compatible alleles (Supplemental Fig. 3, 4). Predicting the identified FOXP3 peptides’ binding affinity for these alleles (NetMHC 4.0 [37]) suggested weak binding for the A03:01 allele (ATWKNAIRH from donor #4; 1669.5 nM) and for the B07:02 allele (SAMQAHLAGKMAL from donor #5; 1,820.2 nM). All three FOXP3 peptides presented in Fig. 3A were confirmed with synthetic peptides, which produced highly similar fragmentation spectra (Supplementary Fig. 6).
A recently reported immunopeptide database, SystemMHC Atlas [45] shows just 13 unique peptide sequences covering FOXP3, all of which were identified in a single study of bulk malignant melanoma tumors [46]. These specimens presumably included resident infiltrating Tconv and TReg, and consequently the precise cellular origin of the reported FOXP3 peptides is not clear. The approach of surveying enriched T cell subpopulations as outlined here stands to resolve this ambiguity.
3.5. Proteins central to T-cell biology are presented as post-translationally modified peptides
Among 13,804 peptides identified in this study, 5% bore chemical modifications likely derived from sample handling (599 with oxidized methionine, 139 with deamidated asparagine and glutamine). However, we identified 622 cysteinylated and 72 phosphorylated peptides – modifications previously found to reflect underlying biological states when presented as HLA ligands [23,47]. Most phosphorylated peptides were identified from the T cell activation and expansion experiments, and several were derived from proteins central to T-cell activation and migration (Table 1, Supplementary Table 4). For example, our activated T cell specimens yielded two phosphorylated peptides and four non-phosphorylated peptides from CD5, a marker of activated T cells [48,49]. In contrast, we only identified a single non-phosphorylated peptide from Tconv experiments (Fig. 4A and Supplementary Table 4) from CD5. We note that two CD5 HLA ligands were reported in the SystemMHC Atlas database but neither were reported to be phosphorylated [45]. Furthermore, we identified a phosphorylated HLA ligand derived from serine/threonine-protein kinase WNK1 (Fig. 4B). WNK1 was shown to regulate integrin-mediated T cell adhesion and T cell migration [50], and its autophosphorylation at the site we identified (S378), has been proposed to inhibit its kinase activity [51]. Both the CD5 and WNK1 phosphorylated peptides were validated and confirmed by similar spectra produced from synthesized peptides (Supplementary Fig. 7).
Figure 4.
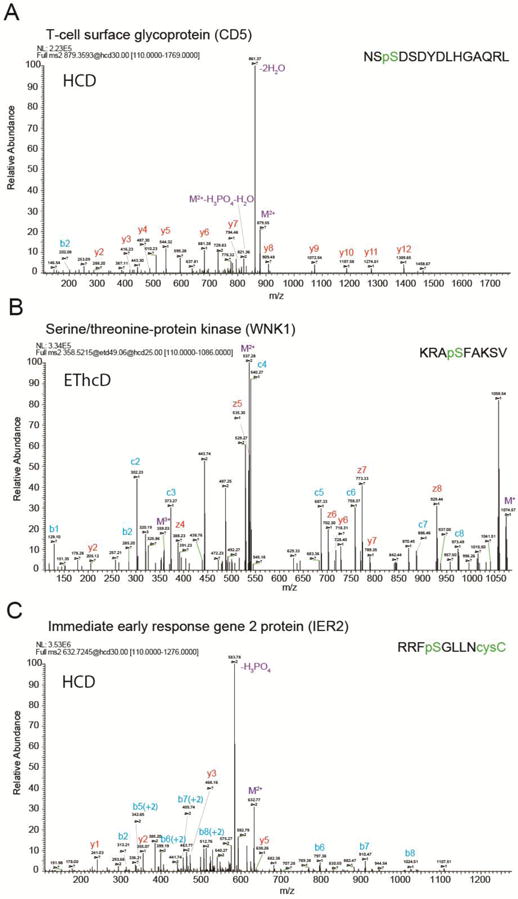
Example spectra identifying post-translationally modified HLA ligands. Examples were selected based on from the corresponding proteins’ known crucial roles in T-cell biology, and identified in the expanded activated samples. (A) Phosphorylated peptide N481 – L495 from CD5 acquired with HCD fragmentation. The indicated phosphosite S483 was previously reported in activated Jurkat T cells [49]. (B) Phosphorylated peptide K375-V383 from WNK1 acquired with EThCD fragmentation. (C) Phosphorylated and cysteinylated peptide R181-C188 from IER2 acquired with HCD fragmentation.
We also observed a phosphorylated and cysteinylated HLA ligand derived from immediate early response gene 2 protein (IER2) (Fig. 4C). IER2 is a DNA-binding protein expressed in activated tumor cells and metastatic tumor cells that can promote cell motility and been reported to correlate with poor metastasis-free and overall survival [52]. Its post-translational modification has not previously been reported. These and similar modified HLA-I ligands may relay cell state specific information for both cell biological inquiry and for developing new T cell subpopulation purification strategies.
4 Concluding remarks
This study demonstrates that profiling immunopeptidomes derived from specific enriched, primary T cell subpopulations and from individual donors is feasible. The T-lymphocyte HLA-class I immunopeptidomes presented here are a launching point for further efforts to characterize T cell subsets and dissect differences between Tconv, activated Tconv and TRegs. Further elaboration of this general approach should help build a foundation for new therapies which specifically target TReg while sparing Tconv. Additional efforts to anatomize the immunopeptidomes of alternative T cell subsets including Th1, Th2, Th17, Tr1 and T follicular helper cells, may uncover novel subset-specific surface targets and derivative strategies to allow therapeutic skewing of specific T cell subsets.
Our overarching goal is to expand the depth with which immunopeptidomes can be defined from specific T cell subsets enriched from single donors [53]. Comparing aspects of our default workflow (#1, Fig. 1) which we previously used to profile 17 different lymphoma tumors [28], to an improved workflow (#2, Fig. 1) for measuring defined T cell subsets, suggests that further improvement in sample preparation and data acquisition strategies will be fruitful in this endeavor. One way to achieve this could be through improved dynamic data acquisition: In the present study, we performed at least two LC-MS/MS analyses per specimen to enable alternative peptide fragmentation modes. Efforts towards optimizing single-injection workflows for limiting sample amounts stands to increase immunopeptidome sampling by a factor of two or more. This, along with improved sensitivity and reproducibility in cellular enrichment techniques should expand the number of clinically relevant specimens that are compatible with deep T-cell subpopulations immunopeptidome profiling.
Our approach may also provide valuable reference spectra for targeted analyses of TReg ligands. For example, more sensitive peptide detection with multiple reaction monitoring [54] could reduce the need for extensive cell enrichment, and instead to track TReg -specific antigens in larger lymphocyte populations. Relatedly, the data-independent analysis (DIA) strategy [55] could ultimately prove to be a more efficient use of limited cell numbers: this kind of single-run workflow could simultaneously establish the full range of HLA ligands presented in a cell population while letting researcher retrospectively test for the presence of known or suspected ligands, without consuming any additional biological material.
Several HLA ligands identified here, in particular FOXP3-derived peptides and phosphorylated peptides such as those derived from WNK1 and CD5 might collectively serve as unique and clinically valuable cell surface markers. We expect that further high-resolution HLA-ligandome surveys will reveal new aspects of T cell biology while opening increasing numbers of cell subtype-specific antigens to targeted immunotherapies.
Supplementary Material
Statement of significance of the study.
Dissecting cell heterogeneity across activated and inhibitory T cell subpopulations and identifying their distinguishing features will drive immunotherapy advancement. The results presented here provide the first characterization of TReg immunopeptidomes from primary material and corresponding elucidation of immunopeptidome level changes between resting and activated Tconv. Differences between TReg and Tconv immunopeptidomes revealed cellular changes that may not be readily apparent from more conventional transcript or protein expression studies. Importantly, combining immunoselection techniques with recent advances in immunopeptide preparation, instrumentation and computational approaches enabled direct immunopeptidome surveys from specific T cell subtypes derived from single donors. We expect these findings will aid future immunological studies seeking to characterize T-cell immunopeptidomes from cancer patients, and have implications for manipulating T-cell subpopulations to support efficient immunotherapeutic T-cell activation.
Acknowledgments
This work was supported by the W.M. Keck Foundation Medical Research Program (J.E.E.), and the National Institutes of Health (NIH U01 CA194389). In addition, (N.O.) was supported by a Wallenberg Foundation Postdoctoral fellowship and (L.S.) was supported by a St. Baldrick’s Foundation Scholar Award.
Abbreviations
- EThcD
Electron-transfer/higher-energy collision dissociation
- FDR
False discovery rate
- FOXP3
Forkhead box protein P3
- HCD
Higher energy collisional dissociation
- HLA-I
Human leukocyte antigen class I
- PBS
Phosphate buffered saline
- TReg
T regulatory cells
- Tconv
Conventional T cells
Footnotes
The authors declare no competing financial interests.
References
- 1.Chien YH, Gascoigne NR, Kavaler J, Lee NE, Davis MM. Somatic recombination in a murine T-cell receptor gene. Nature. 1984;309:322–6. doi: 10.1038/309322a0. [DOI] [PubMed] [Google Scholar]
- 2.Nomura T, Sakaguchi S. Naturally arising CD25+CD4+ regulatory T cells in tumor immunity. Curr Top Microbiol Immunol. 2005;293:287–302. doi: 10.1007/3-540-27702-1_13. [DOI] [PubMed] [Google Scholar]
- 3.Sakaguchi S. Naturally arising Foxp3-expressing CD25+CD4+ regulatory T cells in immunological tolerance to self and non-self. Nat Immunol. 2005;6:345–52. doi: 10.1038/ni1178. [DOI] [PubMed] [Google Scholar]
- 4.Fontenot JD, Rudensky AY. A well adapted regulatory contrivance: regulatory T cell development and the forkhead family transcription factor Foxp3. Nat Immunol. 2005;6:331–337. doi: 10.1038/ni1179. [DOI] [PubMed] [Google Scholar]
- 5.Facciabene A, Motz GT, Coukos G. T-Regulatory cells: Key players in tumor immune escape and angiogenesis. Cancer Res. 2012;72:2162–2171. doi: 10.1158/0008-5472.CAN-11-3687. [DOI] [PMC free article] [PubMed] [Google Scholar]
- 6.Curiel TJ, Coukos G, Zou L, Alvarez X, Cheng P, Mottram P, Evdemon-Hogan M, Conejo-Garcia JR, Zhang L, Burow M, Zhu Y, Wei S, Kryczek I, Daniel B, Gordon A, Myers L, Lackner A, Disis ML, Knutson KL, Chen L, Zou W. Specific recruitment of regulatory T cells in ovarian carcinoma fosters immune privilege and predicts reduced survival. Nat Med. 2004;10:942–949. doi: 10.1038/nm1093. [DOI] [PubMed] [Google Scholar]
- 7.Sato E, Olson SH, Ahn J, Bundy B, Nishikawa H, Qian F, Jungbluth AA, Frosina D, Gnjatic S, Ambrosone C, Kepner J, Odunsi T, Ritter G, Lele S, Chen YT, Ohtani H, Old LJ, Odunsi K. Intraepithelial CD8+ tumor-infiltrating lymphocytes and a high CD8+/regulatory T cell ratio are associated with favorable prognosis in ovarian cancer. Pnas. 2005;102:18538–43. doi: 10.1073/pnas.0509182102. [DOI] [PMC free article] [PubMed] [Google Scholar]
- 8.Jiang Y, Du Z, Yang F, Di Y, Li J, Zhou Z, Pillarisetty VG, Fu D. FOXP3+ Lymphocyte Density in Pancreatic Cancer Correlates with Lymph Node Metastasis. PLoS One. 2014;9:e106741. doi: 10.1371/journal.pone.0106741. [DOI] [PMC free article] [PubMed] [Google Scholar]
- 9.Tang Y, Xu X, Guo S, Zhang C, Tang Y, Tian Y, Ni B, Lu B, Wang H. An increased abundance of tumor-infiltrating regulatory t cells is correlated with the progression and prognosis of pancreatic ductal adenocarcinoma. PLoS One. 2014;9 doi: 10.1371/journal.pone.0091551. [DOI] [PMC free article] [PubMed] [Google Scholar]
- 10.Tao H, Mimura Y, Aoe K, Kobayashi S, Yamamoto H, Matsuda E, Okabe K, Matsumoto T, Sugi K, Ueoka H. Prognostic potential of FOXP3 expression in non-small cell lung cancer cells combined with tumor-infiltrating regulatory T cells. Lung Cancer. 2012;75:95–101. doi: 10.1016/j.lungcan.2011.06.002. [DOI] [PubMed] [Google Scholar]
- 11.Sayour EJ, McLendon P, McLendon R, De Leon G, Reynolds R, Kresak J, Sampson JH, Mitchell DA. Increased proportion of FoxP3+ regulatory T cells in tumor infiltrating lymphocytes is associated with tumor recurrence and reduced survival in patients with glioblastoma. Cancer Immunol Immunother. 2015;64:419–427. doi: 10.1007/s00262-014-1651-7. [DOI] [PMC free article] [PubMed] [Google Scholar]
- 12.Nishikawa H, Sakaguchi S. Regulatory T cells in cancer immunotherapy. Curr Opin Immunol. 2014;27:1–7. doi: 10.1016/j.coi.2013.12.005. [DOI] [PubMed] [Google Scholar]
- 13.Elkord E, Alcantar-Orozco E, Dovedi S, Tran D. T regulatory cells in cancer: recent advances and therapeutic potential. Expert Opin Biol Ther. 2010;10:1573–1586. doi: 10.1517/14712598.2010.529126. [DOI] [PubMed] [Google Scholar]
- 14.Yao X, Ahmadzadeh M, Lu YC, Liewehr DJ, Dudley ME, Liu F, Schrump DS, Steinberg SM, Rosenberg SA, Robbins PF. Levels of peripheral CD4 +FoxP3 + regulatory T cells are negatively associated with clinical response to adoptive immunotherapy of human cancer. Blood. 2012;119:5688–5696. doi: 10.1182/blood-2011-10-386482. [DOI] [PMC free article] [PubMed] [Google Scholar]
- 15.Shimizu J, Yamazaki S, Sakaguchi S. Induction of tumor immunity by removing CD25+CD4+ T cells: a common basis between tumor immunity and autoimmunity. J Immunol. 1999;163:5211–8. [PubMed] [Google Scholar]
- 16.Dannull J, Su Z, Rizzieri D, Yang BK, Coleman D, Yancey D, Zhang A, Dahm P, Chao N, Gilboa E, Vieweg J. Enhancement of vaccine-mediated antitumor immunity in cancer patients after depletion of regulatory T cells. J Clin Invest. 2005;115:3623–3633. doi: 10.1172/JCI25947. [DOI] [PMC free article] [PubMed] [Google Scholar]
- 17.Yu N, Li X, Song W, Li D, Yu D, Zeng X, Li M, Leng X, Li X. CD4+CD25+CD127low/- T cells: A more specific treg population in human peripheral blood. Inflammation. 2012;35:1773–1780. doi: 10.1007/s10753-012-9496-8. [DOI] [PubMed] [Google Scholar]
- 18.Nair S, Boczkowski D, Fassnacht M, Pisetsky D, Gilboa E. Vaccination against the forkhead family transcription factor Foxp3 enhances tumor immunity. Cancer Res. 2007;67:371–380. doi: 10.1158/0008-5472.CAN-06-2903. [DOI] [PubMed] [Google Scholar]
- 19.Larsen SK, Munir S, Woetmann A, Frøsig TM, Odum N, Svane IM, Becker JC, Andersen MH. Functional characterization of Foxp3-specific spontaneous immune responses. Leukemia. 2013:1–9. doi: 10.1038/leu.2013.196. [DOI] [PubMed] [Google Scholar]
- 20.Wang J, Ioan-Facsinay A, van der Voort EIH, Huizinga TWJ, Toes REM. Transient expression of FOXP3 in human activated nonregulatory CD4+ T cells. Eur J Immunol. 2007;37:129–138. doi: 10.1002/eji.200636435. [DOI] [PubMed] [Google Scholar]
- 21.Gavin MA, Torgerson TR, Houston E, DeRoos P, Ho WY, Stray-Pedersen A, Ocheltree EL, Greenberg PD, Ochs HD, Rudensky AY. Single-cell analysis of normal and FOXP3-mutant human T cells: FOXP3 expression without regulatory T cell development. Proc Natl Acad Sci U S A. 2006;103:6659–64. doi: 10.1073/pnas.0509484103. [DOI] [PMC free article] [PubMed] [Google Scholar]
- 22.Mantel PY, Ouaked N, Ruckert B, Karagiannidis C, Welz R, Blaser K, Schmidt-Weber CB. Molecular Mechanisms Underlying FOXP3 Induction in Human T Cells. J Immunol. 2006;176:3593–3602. doi: 10.4049/jimmunol.176.6.3593. [DOI] [PubMed] [Google Scholar]
- 23.Mommen GPM, Frese CK, Meiring HD, van Gaans-van den Brink J, de Jong APJM, van Els CACM, Heck AJR. Expanding the detectable HLA peptide repertoire using electron-transfer/higher-energy collision dissociation (EThcD) Proc Natl Acad Sci. 2014;111:4507–4512. doi: 10.1073/pnas.1321458111. [DOI] [PMC free article] [PubMed] [Google Scholar]
- 24.Bassani-Sternberg M, Pletscher-Frankild S, Jensen LJ, Mann M. Mass spectrometry of human leukocyte antigen class I peptidomes reveals strong effects of protein abundance and turnover on antigen presentation. Mol Cell Proteomics. 2015;14:658–673. doi: 10.1074/mcp.M114.042812. [DOI] [PMC free article] [PubMed] [Google Scholar]
- 25.Schumacher FR, Delamarre L, Jhunjhunwala S, Modrusan Z, Phung QT, Elias JE, Lill JR. Building proteomic tool boxes to monitor MHC class I and class II peptides. Proteomics. 2017;17 doi: 10.1002/pmic.201600061. [DOI] [PubMed] [Google Scholar]
- 26.Heyder T, Kohler M, Tarasova NK, Haag S, Rutishauser D, Rivera NV, Sandin C, Mia S, Malmström V, Wheelock ÅM, Wahlström J, Holmdahl R, Eklund A, Zubarev RA, Grunewald J, Ytterberg AJ. Approach for Identifying Human Leukocyte Antigen (HLA)-DR Bound Peptides from Scarce Clinical Samples. Mol Cell Proteomics. 2016;15:3017–29. doi: 10.1074/mcp.M116.060764. [DOI] [PMC free article] [PubMed] [Google Scholar]
- 27.Hunt DF, Henderson RA, Shabanowitz J, Sakaguchi K, Michel H, Sevilir N, Cox AL, Appella E, Engelhard VH. Characterization of peptides bound to the class I MHC molecule HLA-A2.1 by mass spectrometry. Science (80-) 1992;255:1261–3. doi: 10.1126/science.1546328. [DOI] [PubMed] [Google Scholar]
- 28.Khodadoust MSMS, Olsson N, Wagar LELE, Haabeth OAWOAW, Chen B, Swaminathan K, Rawson K, Liu CLCL, Steiner D, Lund P, Rao S, Zhang L, Marceau C, Stehr H, Newman AMAM, Czerwinski DKDK, Carlton VEHVEH, Moorhead M, Faham M, Kohrt HEHE, Carette J, Green MRMR, Davis MMM, Levy R, Elias JEJE, Alizadeh AAAA. Antigen presentation profiling reveals recognition of lymphoma immunoglobulin neoantigens. Nature. 2017;543:723–727. doi: 10.1038/nature21433. [DOI] [PMC free article] [PubMed] [Google Scholar]
- 29.Barnstable CJ, Bodmer WF, Brown G, Galfre G, Milstein C, Williams AF, Ziegler A. Production of monoclonal antibodies to group A erythrocytes, HLA and other human cell surface antigens-new tools for genetic analysis. Cell. 1978;14:9–20. doi: 10.1016/0092-8674(78)90296-9. [DOI] [PubMed] [Google Scholar]
- 30.Rappsilber J, Ishihama Y, Mann M. Stop and go extraction tips for matrix-assisted laser desorption/ionization, nanoelectrospray, and LC/MS sample pretreatment in proteomics. Anal Chem. 2003;75:663–670. doi: 10.1021/ac026117i. [DOI] [PubMed] [Google Scholar]
- 31.Elias JE, Gygi SP. Target-decoy search strategy for increased confidence in large-scale protein identifications by mass spectrometry. Nat Methods. 2007;4:207–14. doi: 10.1038/nmeth1019. [DOI] [PubMed] [Google Scholar]
- 32.Eng JK, McCormack AL, Yates JR. An approach to correlate tandem mass spectral data of peptides with amino acid sequences in a protein database. J Am Soc Mass Spectrom. 1994;5:976–989. doi: 10.1016/1044-0305(94)80016-2. [DOI] [PubMed] [Google Scholar]
- 33.Käll L, Canterbury JD, Weston J, Noble WS, MacCoss MJ, Kall L, Canterbury JD, Weston J, Noble WS, MacCoss MJ. Semi-supervised learning for peptide identification from shotgun proteomics datasets. Nat Methods. 2007;4:923–925. doi: 10.1038/nmeth1113. [DOI] [PubMed] [Google Scholar]
- 34.Vizcaíno JA, Csordas A, Del-Toro N, Dianes JA, Griss J, Lavidas I, Mayer G, Perez-Riverol Y, Reisinger F, Ternent T, Xu QW, Wang R, Hermjakob H. 2016 update of the PRIDE database and its related tools. Nucleic Acids Res. 2016;44:D447–D456. doi: 10.1093/nar/gkv1145. [DOI] [PMC free article] [PubMed] [Google Scholar]
- 35.Andreatta M, Alvarez B, Nielsen M. GibbsCluster: Unsupervised clustering and alignment of peptide sequences. Nucleic Acids Res. 2017;45:W458–W463. doi: 10.1093/nar/gkx248. [DOI] [PMC free article] [PubMed] [Google Scholar]
- 36.Fleri W, Paul S, Dhanda SK, Mahajan S, Xu X, Peters B, Sette A. The Immune Epitope Database and Analysis Resource in Epitope Discovery and Synthetic Vaccine Design. Front Immunol. 2017;8:278. doi: 10.3389/fimmu.2017.00278. [DOI] [PMC free article] [PubMed] [Google Scholar]
- 37.Andreatta M, Nielsen M. Gapped sequence alignment using artificial neural networks: Application to the MHC class i system. Bioinformatics. 2016;32:511–517. doi: 10.1093/bioinformatics/btv639. [DOI] [PMC free article] [PubMed] [Google Scholar]
- 38.Oravecz A, Apostolov A, Polak K, Jost B, Le Gras S, Chan S, Kastner P. Ikaros mediates gene silencing in T cells through Polycomb repressive complex 2. Nat Commun. 2015;6:8823. doi: 10.1038/ncomms9823. [DOI] [PMC free article] [PubMed] [Google Scholar]
- 39.Wabnitz G, Balta E, Samstag Y. L-plastin regulates the stability of the immune synapse of naive and effector T-cells. Adv Biol Regul. 2017;63:107–114. doi: 10.1016/j.jbior.2016.09.009. [DOI] [PubMed] [Google Scholar]
- 40.Pomerantz JL, Denny EM, Baltimore D. CARD11 mediates factor-specific activation of NF-kappaB by the T cell receptor complex. EMBO J. 2002;21:5184–5194. doi: 10.1093/emboj/cdf505. [DOI] [PMC free article] [PubMed] [Google Scholar]
- 41.Andreotti AH, Schwartzberg PL, Joseph RE, Berg LJ. T-cell signaling regulated by the Tec family kinase, Itk. Cold Spring Harb Perspect Biol. 2010;2:1–22. doi: 10.1101/cshperspect.a002287. [DOI] [PMC free article] [PubMed] [Google Scholar]
- 42.Dubovsky JA, Beckwith KA, Natarajan G, Woyach JA, Jaglowski S, Zhong Y, Hessler JD, Liu TM, Chang BY, Larkin KM, Stefanovski MR, Chappell DL, Frissora FW, Smith LL, Smucker KA, Flynn JM, Jones JA, Andritsos LA, Maddocks K, Lehman AM, Furman R, Sharman J, Mishra A, Caligiuri MA, Satoskar AR, Buggy JJ, Muthusamy N, Johnson AJ, Byrd JC. Ibrutinib is an irreversible molecular inhibitor of ITK driving a Th1-selective pressure in T lymphocytes. Blood. 2013;122:2539–2549. doi: 10.1182/blood-2013-06-507947. [DOI] [PMC free article] [PubMed] [Google Scholar]
- 43.Procaccini C, Carbone F, Di Silvestre D, Brambilla F, De Rosa V, Galgani M, Faicchia D, Marone G, Tramontano D, Corona M, Alviggi C, Porcellini A, La Cava A, Mauri P, Matarese G. The Proteomic Landscape of Human Ex Vivo Regulatory and Conventional T Cells Reveals Specific Metabolic Requirements. Immunity. 2016;44:406–421. doi: 10.1016/j.immuni.2016.01.028. [DOI] [PMC free article] [PubMed] [Google Scholar]
- 44.Szklarczyk D, Franceschini A, Wyder S, Forslund K, Heller D, Huerta-Cepas J, Simonovic M, Roth A, Santos A, Tsafou KP, Kuhn M, Bork P, Jensen LJ, Von Mering C. STRING v10: Protein-protein interaction networks, integrated over the tree of life. Nucleic Acids Res. 2015;43:D447–D452. doi: 10.1093/nar/gku1003. [DOI] [PMC free article] [PubMed] [Google Scholar]
- 45.Shao W, Pedrioli PGA, Wolski W, Scurtescu C, Schmid E, Vizcaíno JA, Courcelles M, Schuster H, Kowalewski D, Marino F, Arlehamn CSL, Vaughan K, Peters B, Sette A, Ottenhoff THM, Meijgaarden KE, Nieuwenhuizen N, Kaufmann SHE, Schlapbach R, Castle JC, Nesvizhskii AI, Nielsen M, Deutsch EW, Campbell DS, Moritz RL, Zubarev RA, Ytterberg AJ, Purcell AW, Marcilla M, Paradela A, Wang Q, Costello CE, Ternette N, van Veelen PA, van Els CACM, Heck AJR, de Souza GA, Sollid LM, Admon A, Stevanovic S, Rammensee HG, Thibault P, Perreault C, Bassani-Sternberg M, Aebersold R, Caron E. The SysteMHC Atlas project. Nucleic Acids Res. 2017:1–11. doi: 10.1093/nar/gkx664. [DOI] [PMC free article] [PubMed] [Google Scholar]
- 46.Bassani-Sternberg M, Bräunlein E, Klar R, Engleitner T, Sinitcyn P, Audehm S, Straub M, Weber J, Slotta-Huspenina J, Specht K, Martignoni ME, Werner A, Hein R, H Busch D, Peschel C, Rad R, Cox J, Mann M, Krackhardt AM. Direct identification of clinically relevant neoepitopes presented on native human melanoma tissue by mass spectrometry. Nat Commun. 2016;7:13404. doi: 10.1038/ncomms13404. [DOI] [PMC free article] [PubMed] [Google Scholar]
- 47.Cobbold M, De La Pena H, Norris A, Polefrone JM, Qian J, English AM, Cummings KL, Penny S, Turner JE, Cottine J, Abelin JG, Malaker SA, Zarling AL, Huang HW, Goodyear O, Freeman SD, Shabanowitz J, Pratt G, Craddock C, Williams ME, Hunt DF, Engelhard VH. MHC Class I-Associated Phosphopeptides Are the Targets of Memory-like Immunity in Leukemia. Sci Transl Med. 2013;5:203ra125–203ra125. doi: 10.1126/scitranslmed.3006061. [DOI] [PMC free article] [PubMed] [Google Scholar]
- 48.Davies AA, Ley SC, Crumpton MJ. CD5 is phosphorylated on tyrosine after stimulation of the T-cell antigen receptor complex. Proc Natl Acad Sci U S A. 1992;89:6368–72. doi: 10.1073/pnas.89.14.6368. [DOI] [PMC free article] [PubMed] [Google Scholar]
- 49.Mayya V, Lundgren DH, Hwang SI, Rezaul K, Wu L, Eng JK, Rodionov V, Han DK. Quantitative phosphoproteomic analysis of T cell receptor signaling reveals system-wide modulation of protein-protein interactions. Sci Signal. 2009;2:ra46. doi: 10.1126/scisignal.2000007. [DOI] [PubMed] [Google Scholar]
- 50.Köchl R, Thelen F, Vanes L, Brazão TF, Fountain K, Xie J, Huang CL, Lyck R, Stein JV, Tybulewicz VLJ. WNK1 kinase balances T cell adhesion versus migration in vivo. Nat Immunol. 2016;17:1075–1083. doi: 10.1038/ni.3495. [DOI] [PMC free article] [PubMed] [Google Scholar]
- 51.Xu Be, Min X, Stippec S, Lee BH, Goldsmith EJ, Cobb MH. Regulation of WNK1 by an autoinhibitory domain and autophosphorylation. J Biol Chem. 2002;277:48456–48462. doi: 10.1074/jbc.M207917200. [DOI] [PubMed] [Google Scholar]
- 52.Neeb A, Wallbaum S, Novac N, Dukovic-Schulze S, Scholl I, Schreiber C, Schlag P, Moll J, Stein U, Sleeman JP. The immediate early gene Ier2 promotes tumor cell motility and metastasis, and predicts poor survival of colorectal cancer patients. Oncogene. 2012;31:3796–3806. doi: 10.1038/onc.2011.535. [DOI] [PubMed] [Google Scholar]
- 53.Caron E, Aebersold R, Banaei-Esfahani A, Chong C, Bassani-Sternberg M. A Case for a Human Immuno-Peptidome Project Consortium. Immunity. 2017;47:203–208. doi: 10.1016/j.immuni.2017.07.010. [DOI] [PubMed] [Google Scholar]
- 54.Croft NP, Smith SA, Wong YC, Tan CT, Dudek NL, Flesch IEA, Lin LCW, Tscharke DC, Purcell AW. Kinetics of Antigen Expression and Epitope Presentation during Virus Infection. PLoS Pathog. 2013;9 doi: 10.1371/journal.ppat.1003129. [DOI] [PMC free article] [PubMed] [Google Scholar]
- 55.Caron E, Espona L, Kowalewski DJ, Schuster H, Ternette N, Alpízar A, Schittenhelm RB, Ramarathinam SH, Arlehamn CSL, Koh CC, Gillet LC, Rabsteyn A, Navarro P, Kim S, Lam H, Sturm T, Marcilla M, Sette A, Campbell DS, Deutsch EW, Moritz RL, Purcell AW, Rammensee HG, Stevanovic S, Aebersold R. An open-source computational and data resource to analyze digital maps of immunopeptidomes. Elife. 2015;4:1–17. doi: 10.7554/eLife.07661. [DOI] [PMC free article] [PubMed] [Google Scholar]
Associated Data
This section collects any data citations, data availability statements, or supplementary materials included in this article.