

Abstract
BACKGROUND/OBJECTIVES
To gain further insight into the role of adipocyte mitochondria in systemic lipid metabolism, inflammation and insulin sensitivity in humans and to provide a better understanding of the mechanisms of action of the peroxisome proliferator-activated receptor gamma agonist pioglitazone.
SUBJECTS/METHODS
Mitochondrial DNA (mtDNA) copy number, mitochondrial distribution, mitochondrial and overall cellular protein abundances as well as intrinsic mitochondrial function of subcutaneous adipocytes were assessed by real-time quantitative PCR, MitoTracker staining, global proteomics analyses and NADH cytochrome c reductase activity in insulin-sensitive, normal-glucose-tolerant (NGT) individuals and age, gender, adiposity-matched insulin-resistant individuals with abnormal glucose tolerant (AGT) before and after 3 months of pioglitazone treatment.
RESULTS
mtDNA copy number/adipocyte and mtDNA copy number/adipocyte volume were ~ 55% and ~ 4-fold lower in AGT than in NGT, respectively, and correlated positively with the M-value of euglycemic clamps and high-density lipoprotein, and negatively with fasting plasma triglyceride, tumor necrosis factor-α and interleukin-6 levels in the entire cohort. mtDNA copy number/adipocyte volume also correlated positively with plasma adiponectin. Pioglitazone, which improved insulin sensitivity, plasma lipids and inflammation, increased the mitochondrial copy number, and led to a redistribution of mitochondria from a punctate to a more reticular pattern as observed in NGT. This was accompanied by disproportionately increased abundances of mitochondrial proteins, including those involved in fat oxidation and triglyceride synthesis. Pioglitazone also increased the abundance of collagen VI and decreased the abundance of cytoskeletal proteins. NADH cytochrome c reductase activity of isolated adipocyte mitochondria was similar in AGT and NGT and unaltered by pioglitazone.
CONCLUSIONS
Adipocyte mitochondria are deficient in insulin-resistant individuals and correlate with systemic lipid metabolism, inflammation and insulin sensitivity. Pioglitazone induces mitochondrial biogenesis and reorganization as well as the synthesis of mitochondrial proteins including those critical for lipid metabolism. It also alters extracellular matrix and cytoskeletal proteins. The intrinsic function of adipocyte mitochondria appears unaffected in insulin resistance and by pioglitazone.
INTRODUCTION
In adipocytes, mitochondria play an essential role in many pathways that can have systemic effects. During nutrient uptake, adipocyte mitochondria must provide acetyl-CoA derived from glucose metabolism as substrates for de novo fatty acid synthesis and the subsequent packaging of fatty acid as triglycerides in lipid droplets.1 Cytosolic glycerol-3-phosphate, a central metabolite connecting glycolysis, lipogenesis and oxidative phosphorylation, is regulated by the glycerophosphate shuttle, whose function highly depends on the activity of mitochondrial glycerol-3-phosphate dehydrogenase.2 Moreover, ATP is required for insulin signaling, and hence for the antilipolytic effects of insulin.3,4 Lastly, mitochondrial function is linked to the secretion of adiponectin,5 which exerts anti-hyperglycemic and insulin-sensitizing effects. Abnormalities in adipocyte mitochondrial content and/or function may hence result in dysregulated cellular and systemic lipid metabolism as well as increased secretion of pro-inflammatory factors that can have detrimental effects on local and systemic insulin sensitivity. Indeed, in animal models of insulin resistance, mitochondria are reduced in white adipocytes,6–8 and adipose tissue is characterized by decreased expression of genes associated with mitochondrial ATP production, energy uncoupling, mitochondrial ribosomal proteins, outer and inner membrane translocases, and mitochondrial heat-shock proteins.7 This was coupled with reduced expression of transcription factors and nuclear receptors involved in mitochondrial biogenesis and impaired fat oxidation and respiration.7 Exercise and peroxisome proliferator-activated receptor gamma (PPAR-γ) agonists, which both increase insulin sensitivity, increased mitochondrial content, reversed most of the reductions in gene expression and improved mitochondrial function.6–11
However, the systemic role of adipocyte mitochondria in humans is unclear. In healthy lean to morbidly obese humans, mitochondrial number per cell in adipose tissue was found to correlate strongly with adipocyte lipogenesis ex vivo but not with whole-body insulin sensitivity when adjusted for age and body mass index (BMI).12 In contrast, mitochondrial number and gene expression of the nuclear transcription factor PGC-1 alpha were found to be reduced in adipose tissue from insulin-resistant individuals with type 2 diabetes (T2D) compared with insulin-sensitive normal-glucose-tolerant individuals; pioglitazone treatment in the T2D subjects increased the mitochondrial number and the expression of factors involved in mitochondrial biogenesis and fat oxidation.13 However, interpretation of these findings is limited due to uncontrolled glycemia and greater age and adiposity of the T2D subjects compared with the control subjects as well as the improved glycemia with pioglitazone treatment. Using unbiased global proteomics analysis, we recently reported significantly reduced abundance of several mitochondrial proteins in subcutaneous adipocytes of typical insulin-resistant individuals compared with insulin-sensitive individuals, but these reductions were less pronounced when insulin-resistant and insulin-sensitive subjects were matched for adiposity.14 In addition, proteomics studies using two-dimensional gel electrophoresis did not detect increased mitochondrial proteins in subcutaneous adipose tissue of obese healthy individuals after rosiglitazone treatment15 possibly due to methodological limitations.16,17 Lastly, little is known about the intrinsic function of adipocyte mitochondria in human insulin resistance and its associated dysregulated lipid metabolism and inflammation.
Therefore, to further our understanding of the role of adipocyte mitochondria in human systemic metabolism, we examined the mitochondrial number, density, distribution and protein abundance of subcutaneous adipocytes as well as the intrinsic adipocyte mitochondrial function in insulin-sensitive individuals with normal-glucose tolerance and insulin-resistant individuals with abnormal glucose tolerance (AGT) before and after pioglitazone treatment. Furthermore, with the opportunity of global proteomics analyses by one-dimensional gel electrophoresis followed by high-performance liquid chromatography–electrospray ionization tandem mass spectrometry (which is more sensitive than the two-dimensional gel electrophoresis) used for the measurement of mitochondrial protein abundances, we sought to gain better insight into the molecular mechanisms of action of the PPAR-γ agonist in human adipocytes in vivo.
MATERIALS AND METHODS
Subjects and study design
Seven insulin-resistant individuals with AGT and 13 insulin-sensitive individuals with normal-glucose tolerance (NGT) completed the study. AGT subjects had impaired fasting glucose and/or an elevated 2-h plasma glucose concentration during a standard oral glucose tolerance test of >140 but <250 mg dl−1 to minimize the effect of glucose toxicity that would be reduced by pioglitazone treatment. None of the AGT subjects had previously been diagnosed with T2D. NGT subjects had normal fasting and 2-h plasma glucose concentrations according to ADA criteria.18 Subjects with abnormal liver function, kidney disease, thyroid dysfunction, alcohol or drug abuse, or who were taking medications known to affect glucose metabolism or adipose tissue were excluded. AGT subjects were treated with pioglitazone for 3 months, administered at a dose of 30 mg per day for the first 2 weeks followed by 45 mg per day for the remaining treatment period. In NGT and AGT subjects before and after pioglitazone treatment, body composition was measured by DEXA (Lunar Podigry; General Electric, Madison, WI, USA), a biopsy of abdominal subcutaneous fat was obtained, and insulin sensitivity was assessed by a 2-h hyperinsulinemic–euglycemic clamp as previously described.14 The study was approved by the Institutional Review Board of Arizona State University and was carried out in accordance with the principles of the Declaration of Helsinki. All subjects gave informed written consent prior to any procedures. The study was registered at clinicaltrials.gov (NCT01165190).
Analytical procedures
Fasting serum concentrations of total cholesterol and triglycerides were measured by a photometric method; high-density lipoprotein (HDL) was measured by a homogeneous enzymatic assay and low-density lipoprotein was calculated using the Friedewald equation. Plasma non-esterified fatty acids (NEFA) were measured by a colorimetric kit (NEFA-C; Wako Pure Chemicals, Osaka, Japan). Plasma adiponectin, tumor necrosis factor-α (TNF-α) and interleukin-6 (IL-6) levels were measured by a bead-based multiplex assay using a Luminex analyzer (Luminex Corporation, Austin, TX, USA).
Biopsy samples of adipose tissue were immediately dissected free from vasculature and adipocytes were isolated as previously described.14,19
Cell diameter
Isolated adipocytes were mixed well, placed on a siliconized glass slide in a silicone well and covered with a glass coverslip. Cell diameter was measured manually using phase contrast microscopy (BX51; Olympus Inc., Hicksville, NY, USA) at × 10 magnification and Image J 1.46r version (NIH, Bethesda, MD, USA). About 200–300 cells were measured for each NGT subject and AGT subject before and after pioglitazone treatment.
Adipocyte mitochondrial number, density and distribution, and intrinsic mitochondrial function
The ratio of mtDNA to nuclear DNA in adipocytes, which reflects the cellular mitochondrial number, was determined by quantitative reverse transcriptase PCR as previously described.13 DNA was isolated from adipocytes according to the manufacturer’s protocol (Qiagen, Valencia, CA, USA). A ~ 120 nucleotide-long mtDNA fragment within the gene for NADH dehydrogenase subunit 1 (ND1; forward 5′-TGCGAGCAGTAGCCCAAACAAT-3′ and reverse 5′-TGTGCTGTGATAAG GGTGGAGA-3′) was used for quantification of mtDNA and a ~ 120 bp region of the nuclear gene for glyceraldehydes-3 phosphate dehydrogenase (GAPDH; forward 5′-AAGGAAATGAATGGGCAGCCGT-3′ and reverse 5′-AAAGCATCACCCGGAGGAGAAA-3′) (both Integrated DNA Technologies, London, UK) was used to normalize results. Amplification was performed on a MyIQ (BioRad Laboratories, Hercules, CA, USA). Adipocyte mitochondrial density was calculated by dividing the mtDNA to nuclear DNA ratio by the adipocyte volume assuming spherical shapes.
Patterns of distribution of adipocyte mitochondria were examined by live cell imaging using MitoTracker Green FM (Invitrogen, Carlsbad, CA, USA). Following incubation of adipocytes with 100 nM MitoTracker Green at 37 °C for 30 min, a single in-focus section was acquired by fluorescence microscopy (Zeiss Axiovert 200 M equipped with Xcite light source and DAPI/FITC/rhodamine filter sets). Approximately 30 adipocytes were assessed per sample.
To assess the intrinsic function of adipocyte mitochondria, the rotenone-sensitive activity of NADH cytochrome c reductase of isolated mitochondria was measured by a spectrophotometric assay as previously described.20
Proteomics analyses
Adipocyte proteomics analyses were performed by one-dimensional gel electrophoresis followed by high-performance liquid chromatography–electrospray ionization tandem mass spectrometry using a hybrid linear ion trap (LTQ)-Fourier Transform Ion Cyclotron Resonance (FTICR) mass spectrometer (LTQ FT; Thermo Fisher, San Jose, CA, USA) fitted with a PicoView nanospray source (New Objective, Woburn, MA, USA) as previously described.14,19 Data analyses and bioinformatics were performed as in Xie et al.19 Normalized spectral abundance factors were used to determine protein abundance21,22 as previously described.19,23 Criteria for protein identification included detection of ⩾ 2 unique identified peptides and a probability score of ⩾ 99%, based on Scaffold analysis. Only proteins detected in ⩾ 50% of the 14 proteomics analyses, a common threshold,23–25 and that differed in mean abundance ⩾ 1.5-fold between before and after pioglitazone treatment were subjected to statistical analyses. Genecards confidence level 5 was used to assign proteins to cellular locations.
Unpaired Student’s t-tests were used for comparisons between the NGT and the AGT subjects. Variables were tested for homogeneity of variance by the Levene test; those with unequal variance were log transformed prior to the comparisons. Paired Student’s t-tests were used for comparisons of AGT subjects before and after pioglitazone treatment. In addition to the Student’s t-tests, Wilcoxon signed-rank tests were used to compare proteomics data before and after pioglitazone treatment since about half of the proteins did not meet the assumption of normality. Frequencies of increased and decreased levels of proteins located in mitochondria, the endoplasmatic reticulum and the nucleus as well as all adipocyte proteins in response to pioglitazone were compared by Fisher exact probability tests. The sample size was based on the finding of significant mitochondrial effects of pioglitazone in human adipocytes (N = 5 subjects) in vitro.26 Proteomics data of the insulin-sensitive NGT subjects in comparison to insulin-resistant individuals have previously been reported.14 All statistical analyses were performed by SPSS Statistics Version 20 (IBM Corp., Armonk, NY, USA).
RESULTS
Demographic, physical and metabolic characteristics of NGT subjects and AGT subjects before and after pioglitazone treatment
Compared with the NGT subjects, AGT subjects before pioglitazone treatment had a similar gender distribution and were of similar age; body weight and BMI were greater but percent body fat was virtually identical. As expected, AGT subjects before pioglitazone treatment also were approximately 50% less insulin-sensitive and had increased fasting and 2-h postprandial plasma glucose concentrations and increased HbA1c. Fasting plasma concentrations of NEFA, triglycerides, IL-6 and TNF-α as well as plasma NEFA concentrations during the last 30 min of the hyperinsulinemic clamp were also increased, whereas plasma HDL cholesterol and adiponectin concentrations were decreased (Table 1).
Table 1.
Subjects’ demographic, physical and metabolic characteristics
| NGT | AGT Pre-Pio | AGT Post-Pio | P-value
|
||
|---|---|---|---|---|---|
| NGT vs Pre-Pio | Pre- vs Post-Pio | ||||
| Male/female | 4/9 | 3/4 | NS | ||
| Age (years) | 50 ± 4 | 52 ± 4 | NS | ||
| Weight (kg) | 73.1 ± 3.9 | 92.4 ± 6.0 | 94.5 ± 5.6 | <0.02 | <0.02 |
| BMI (kg m−2) | 25.8 ± 0.9 | 29.5 ± 0.8 | 30.3 ± 0.8 | <0.01 | <0.02 |
| Percent body fat | 36.6 ± 2.0 | 36.3 ± 2.4 | 36.7 ± 2.7 | NS | NS |
| Fasting plasma glucose (mmol l−1) | 4.9 ± 0.1 | 5.4 ± 0.2 | 5.0 ± 0.1 | = 0.06 | <0.03 |
| Fasting plasma insulin (pmol l−1) | 21.4 ± 2.8 | 54.4 ± 6.3 | 45.8 ± 6.1 | <0.001 | NS |
| 2- h OGTT plasma glucose (mmol l−1) | 6.0 ± 0.3 | 8.8 ± 0.8 | ND | <0.003 | |
| HbA1c (%) | 5.5 ± 0.1 | 6.0 ± 0.2 | 5.8 ± 0.1 | <0.004 | <0.05 |
| M-value (μmol kg−1 min−1) | 50.2 ± 2.6 | 24.2 ± 4.2 | 33.3 ± 3.4 | <0.0001 | <0.004 |
| Plasma NEFA (mmol l−1) | 0.54 ± 0.04 | 0.85 ± 0.18 | 0.42 ± 0.06 | <0.04 | <0.02 |
| Plasma triglycerides (mmol l−1) | 0.95 ± 0.11 | 1.47 ± 0.19 | 1.15 ± 0.13 | <0.04 | <0.001 |
| HDL cholesterol (mmol l−1) | 1.49 ± 0.12 | 1.08 ± 0.07 | 1.15 ± 0.08 | <0.05 | 0.085 |
| LDL cholesterol (mmol l−1) | 2.70 ± 0.16 | 2.82 ± 0.35 | 2.84 ± 0.31 | NS | NS |
| Systolic blood pressure (mmHg) | 118 ± 3 | 123 ± 4 | 124 ± 3 | NS | NS |
| Diastolic blood pressure (mmHg) | 73 ± 2 | 77 ± 4 | 79 ± 4 | NS | NS |
| Adiponectin (μg ml−1) | 12.4 ± 1.2 | 8.6 ± 1.1 | 18.5 ± 2.7 | <0.05 | <0.003 |
| TNF-α (pg ml−1) | 3.09 ± 0.24 | 5.57 ± 0.46 | 4.45 ± 0.31 | <0.001 | <0.006 |
| IL-6 (pg ml−1) | 1.09 ± 0.14 | 2.21 ± 0.28 | 1.62 ± 0.28 | <0.001 | <0.03 |
Abbreviations: LDL, low-density lipoprotein; ND, not determined; OGTT, oral glucose tolerance test. Data are presented as means ± s.e.
After 3 months of pioglitazone treatment, AGT subjects had gained on average approximately 2 kg, although percent body fat was not significantly altered. Fasting plasma glucose and HbA1c were slightly but statistically significantly decreased and insulin sensitivity was improved approximately 35%. Fasting plasma NEFA and triglycerides were approximately 50% and 20–25% reduced, respectively, while HDL cholesterol was about 6% increased. Plasma adiponectin was approximately twofold increased; TNF-α and IL-6 were approximately 20–25% reduced (Table 1).
Increased adipocyte size, decreased adipocyte mitochondrial content and altered distribution in insulin-resistant AGT subjects are reversed by pioglitazone treatment
Prior to pioglitazone treatment, adipocyte diameter was approximately 30% greater in AGT subjects than in NGT subjects (135 ± 9.3 vs 104 ± 6 μm, P<0.008), which translates to a more than twofold greater adipocyte volume. Three months of pioglitazone treatment significantly reduced the adipocyte diameter to 97 ± 7 μm (P<0.0001), a value numerically slightly below that in NGT.
Using MitoTracker Green staining, adipocyte mitochondria of NGT subjects appeared as punctuate structures distributed throughout the cytoplasm with an increased concentration near the perinuclear region in approximately 80% of the cells and as tubular, reticular structures in approximately 20% of the cells. In AGT subjects before pioglitazone treatment, mitochondria predominantly appeared as punctuate structures, which changed towards a more tubular, reticular pattern after pioglitazone treatment (Figure 1). The mtDNA copy number per adipocyte was approximately 55% reduced in AGT subjects before pioglitazone treatment compared with the NGT subjects (P<0.003) (Figure 1). Considering cell size, this translates into an approximately fourfold reduced mtDNA copy number per adipocyte volume. Pioglitazone increased, albeit did not normalize, the adipocyte mtDNA copy number approximately 1.4-fold (P<0.01) (Figure 1) but normalized the mtDNA copy number per adipocyte volume (P = 0.7). In the entire cohort of NGT and AGT subjects prior to pioglitazone treatment, the cellular mtDNA copy number and the mtDNA copy number per adipocyte volume correlated positively with the M-value (r = 0.57, P<0.02 and r = 067, P<0.004), and plasma HDL (r = 0.55, P<0.03 and r = 060, P<0.02), and negatively with fasting plasma triglyceride levels (r = − 0.48, P<0.05 and r = − 0.50, P<0.04), TNF-α (r = − 0.62, P<0.008 and r = − 0.58, P<0.02) and IL-6 (r = − 0.41, P<0.1 and r = − 0.50, P<0.04); mtDNA copy number per adipocyte volume but not the cellular mtDNA copy number correlated positively with adiponectin levels (r = 0.49, P<0.05). These correlations persisted after adjustment for age and percent body fat (Table 2). No significant correlations were observed between mtDNA copy number and fasting plasma NEFA or suppression of NEFA during the clamp.
Figure 1.

Distribution of adipocyte mitochondria by MitoTracker Green staining (a) and copy number of mtDNA per adipocyte by quantitative RT-PCR (b) in NGT subjects (N = 13) and AGT subjects before and after 3 months of pioglitazone treatment (N = 7).
Table 2.
Correlations between adipocyte mtDNA copy number per adipocyte or mtDNA copy number per adipocyte volume and insulin sensitivity, lipid parameters and inflammatory markers adjusted for age and percent body fat
|
mtDNA copy number per adipocyte
|
mtDNA copy number per adipocyte volume
|
|||
|---|---|---|---|---|
| r | P-value | r | P-value | |
| M-value | 0.69 | <0.005 | 0.77 | <0.001 |
| Fasting plasma triglycerides | − 0.54 | <0.04 | − 0.53 | <0.04 |
| HDL cholesterol | 0.57 | <0.03 | 0.60 | <0.02 |
| Adiponectin | 0.23 | = 0.4 | 0.48 | = 0.07 |
| TNF-α | − 0.77 | <0.001 | − 0.72 | <0.003 |
| IL-6 | − 0.43 | = 0.11 | − 0.52 | <0.05 |
Mitochondrial proteins are overrepresented among proteins that are increased in abundance by pioglitazone treatment
A total of 856 proteins were assigned in ⩾ 7 of the 14 proteomics analyses (Supplementary Table S1). Of these proteins, 213 were attributed to mitochondria, of which 28 (13%) were ⩾ 1.5-fold increased and 5 (2.3%) were ⩾ 1.5-fold decreased after pioglita-zone treatment. To determine how specifically this overrepresentation relates to proteins of mitochondria compared with those of other organelles, we also probed proteins attributed to the endoplasmatic reticulum (N = 103) and the nucleus (N = 329) for changes in abundance. Of these endoplasmatic reticulum and nuclear proteins, an approximately equal number were increased or decreased ⩾ 1.5-fold (both P<0.003 vs mitochondrial proteins), similar to the total of 856 proteins assigned in ⩾ 7 proteomics analyses (P<0.001 vs mitochondrial proteins) (Figure 2).
Figure 2.
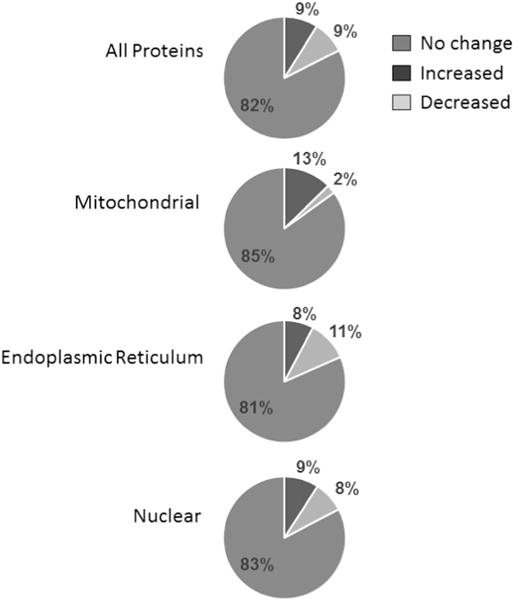
Changes in abundance of all adipocyte proteins (N = 856) and proteins attributed to mitochondria (N = 213), the endoplasmic reticulum (N = 103) and the nucleus (N = 329) after 3 months of pioglitazone treatment in AGT subjects (N = 7).
Intrinsic function of adipocyte mitochondria is similar in NGT and AGT subjects before and after pioglitazone treatment
To determine whether the intrinsic function of adipocyte mitochondria is altered in IR or by pioglitazone, mitochondria were isolated from adipocytes and the rotenone-sensitive NADH cytochrome c reductase activity was measured. Enzyme activities, reflecting complex I and complex III activities where reactive oxygen species production predominantly occurs,27 were similar between AGT and NGT and unaltered by 3 months of pioglitazone treatment (Figure 3).
Figure 3.

NADH cytochrome c reductase activity of isolated adipocyte mitochondria in NGT subjects (N = 13) and AGT subjects before and after 3 months of pioglitazone treatment (N = 7).
Effect of pioglitazone on global adipocyte protein abundance in AGT subjects
Global proteomics analyses were performed on isolated subcutaneous adipocytes from AGT subjects before and after 3 months of pioglitazone treatment to further our understanding of the molecular mechanisms of actions of thiazolidinediones in humans. Of the 856 proteins identified in ⩾ 7 of the 14 proteomics analyses, 151 were altered in abundance ⩾ 1.5-fold. Of these 151 proteins, 40 were statistically significant by paired Student’s t-test or the Wilcoxon sign-rank test (P<0.05; Table 3). Twenty-two were increased in abundance; 18 were decreased. Of the former, nine were mitochondrial in location, of which several were involved in lipid metabolism, beta-oxidation and oxidative phosphorylation, including cytochrome b–c1 complex subunit 8 (gene name UQCRQ), glycerol-3-phosphate acyltransferase 1, mitochondrial (gene name GPAM), ubiquinone biosynthesis protein COQ9, mitochondrial (gene name COQ9), ATP synthase subunit b, mitochondrial (gene name ATP5F1), and long-chain specific acyl-CoA dehydrogenase, mitochondrial (gene name ACADL). Other proteins of interest significantly increased by pioglitazone include the extracellular matrix proteins collagen, type VI, alpha-2 and alpha-3 (gene names COL6A2 and COL6A3), and prohibitin (gene name PHB) a protein involved in transcriptional regulation and mitochondrial function. Proteins significantly decreased by pioglitazone were adenosine kinase (gene name ADK) and cytoskeletal proteins, including tubulin (gene name TUBB2A), spectrin (gene name SPTAN1) and myosin (gene name MYH10). Unexpectedly, less abundant were also low-density lipoprotein receptor-related protein 1 (gene name LRP1), which is involved in the clearance of triglyceride-rich lipoproteins, and long-chain fatty acid–CoA ligase 3 (gene name ACSL3), which activates long-chain fatty acids for synthesis of cellular lipids and degradation via beta-oxidation.
Table 3.
Proteins detected in at least 7 of the total of 14 proteomics analyses and that differed significantly (P<0.05) in abundance by a factor ⩾ 1.5 between pre- and post-pioglitazone treatment
| Protein name (gene name) | Fold change | Student’s t-test | Wilcoxon signed-rank test |
|---|---|---|---|
|
| |||
| P-value | P-value | ||
| Up-regulated proteins | |||
| Collagen, type VI, alpha-3 (COL6A3) | 4.71 | = 0.146 | <0.044 |
| Cytochrome b–c1 complex subunit 8 (UQCRQ) | 4.66 | <0.004 | <0.028 |
| Glycerol-3-phosphate acyltransferase 1, mitochondrial (GPAM) | 4.12 | = 0.054 | <0.028 |
| Protein NipSnap homolog 3 A (NIPSNAP3A) | 3.95 | <0.037 | <0.044 |
| Signal recognition particle receptor subunit beta (SRPRB) | 2.37 | <0.048 | <0.047 |
| Membrane metallo-endopeptidase (MME) | 2.27 | <0.045 | <0.044 |
| Isoform 1 of Ubiquinone biosynthesis protein COQ9, mitochondrial (COQ9) | 2.20 | <0.016 | <0.028 |
| Isoform 2 of Leucyl-cystinyl aminopeptidase (LNPEP) | 2.19 | <0.011 | <0.028 |
| Isoform 2C2 of Collagen alpha-2(VI) chain (COL6A2) | 2.07 | = 0.143 | <0.028 |
| Apolipoprotein O-like (APOOL) | 2.01 | <0.021 | <0.028 |
| ATP synthase subunit b, mitochondrial (ATP5F1) | 1.87 | <0.002 | <0.018 |
| 40S ribosomal protein S3a (RPS3A) | 1.81 | = 0.095 | <0.044 |
| Cytidine monophosphate (UMP-CMP) kinase 1, cytosolic isoform a (CMPK1) | 1.74 | = 0.070 | <0.028 |
| Nucleoside diphosphate kinase 3 (NME3) | 1.68 | <0.041 | <0.028 |
| Isoform 1 of Enoyl-CoA hydratase domain-containing protein 1 (ECHDC1) | 1.63 | <0.008 | <0.018 |
| Prohibitin (PHB) | 1.60 | = 0.054 | <0.043 |
| Mitochondrial carrier homolog 2 (MTCH2) | 1.60 | <0.006 | <0.018 |
| Aspartyl-tRNA synthetase, cytoplasmic (DARS) | 1.58 | = 0.193 | <0.044 |
| Activated RNA polymerase II transcriptional coactivator p15 (SUB1) | 1.57 | = 0.066 | <0.044 |
| Methylmalonate-semialdehyde dehydrogenase [acylating], mitochondrial (ALDH6A1) | 1.56 | <0.065 | <0.028 |
| Long-chain specific acyl-CoA dehydrogenase, mitochondrial (ACADL) | 1.55 | <0.021 | <0.028 |
| Aldehyde dehydrogenase X, mitochondrial (ALDH1B1) | 1.55 | <0.039 | <0.047 |
| Downregulated proteins | |||
| Isoform 1 of Myosin-10 (MYH10) | 0.66 | <0.002 | <0.018 |
| Tubulin beta-2A chain (TUBB2A) | 0.64 | <0.001 | <0.018 |
| Ferritin (FTL) | 0.63 | <0.011 | <0.028 |
| 60S ribosomal protein L30 (RPL30) | 0.61 | <0.009 | <0.047 |
| Transmembrane protein 43 (TMEM43) | 0.61 | <0.009 | <0.018 |
| Transmembrane protein 109 (TMEM109) | 0.60 | = 0.156 | <0.044 |
| Isoform Long of Ubiquitin carboxyl-terminal hydrolase 5 (USP5) | 0.57 | <0.021 | <0.047 |
| PRA1 family protein 3 (ARL6IP5) | 0.56 | = 0.196 | <0.028 |
| Isoform Short of Adenosine kinase (ADK) | 0.54 | = 0.135 | <0.044 |
| Sideroflexin 3 (SFXN3) | 0.53 | <0.017 | <0.044 |
| Peflin (PEF1) | 0.52 | = 0.063 | <0.044 |
| General vesicular transport factor p115 (USO1) | 0.50 | = 0.104 | <0.044 |
| Dolichol-phosphate mannosyltransferase subunit 1 (DPM1) | 0.49 | <0.058 | <0.044 |
| Isoform 1 of Spectrin Alpha Chain, Non-Erythrocytic 1 (SPTAN1) | 0.42 | <0.043 | <0.047 |
| Protein NOXP20 (FAM114A1) | 0.38 | <0.036 | <0.044 |
| Prolow-density lipoprotein receptor-related protein 1 (LRP1) | 0.36 | <0.006 | <0.028 |
| Hsp90 co-chaperone Cdc37 (CDC37) | 0.22 | = 0.120 | <0.047 |
| Long-chain fatty acid–CoA ligase 3 (ACSL3) | 0.22 | <0.048 | <0.044 |
DISCUSSION
We targeted insulin-sensitive NGT individuals and insulin-resistant AGT individuals without frank hyperglycemia matched for age, gender and adiposity to further our understanding of adipocyte mitochondria in insulin sensitivity and their role in insulin sensitization by thiazolidinediones independent of major con-founders, including significant improvement in glycemia.28 There are several important findings from our study. First, using mitochondrial staining techniques and quantitative real-time PCR, we found an altered cellular distribution and a significant diminution of adipocyte mitochondria in the AGT individuals compared with the NGT individuals, and that the adipocyte mitochondrial content correlated positively with insulin sensitivity and fasting plasma HDL concentrations and negatively with circulating pro-inflammatory factors and fasting plasma triglyceride concentrations in the entire cohort. Pioglitazone treatment in the AGT subjects, which increased insulin sensitivity, decreased circulating pro-inflammatory factors and improved plasma lipids as expected, led to a redistribution of mitochondria towards normal, increased the abundance of mitochondrial proteins but not the abundance of proteins of other cellular loci and increased the adipocyte mitochondrial number about 1.4-fold. In combination with the reduced adipocyte size, this led to a normalization of the mitochondrial number per adipocyte volume. Assuming a requirement for mitochondrial mass proportional to cell size, these findings suggest that pioglitazone stimulates mitochondrial biogenesis to a level adequate to meet cellular demands. Kaaman et al.12 reported that the mitochondrial copy number per cell in adipose tissue correlates strongly with adipocyte lipogenesis ex vivo but not with whole-body insulin sensitivity when adjusted for age and BMI. In a study by Bogacka et al.,13 adipose tissue mtDNA copy number in T2D individuals was lower than in NGT individuals and normalized by pioglitazone treatment, but differences in age, adiposity and glycemic control between groups of subjects, and the marked improvement in glycemic control by pioglitazone treatment might have confounded these results. Further, adipose tissue mitochondrial copy number is heavily influenced by the number of stromal vascular cells, since the mitochondrial copy number per cell in adipose tissue is approximately 15-fold lower compared with the mitochondrial copy number in adipocytes.12 Thus, our findings establish for the first time that a reduced mitochondrial content in adipocytes is associated with whole-body insulin sensitivity independent of age, gender, adiposity, glycemic control in humans and that the PPAR-y agonist pioglitazone increases the mitochondrial content irrespective of improved glycemic control. To our knowledge, the latter had not been previously demonstrated in vivo in any species due to the hyperglycemic models studied. However, it is consistent with the increased mitochondrial biogenesis and content in response to PPAR-γ agonist treatment in 3T3L1 adipocytes and human adipocytes in vitro.26,29 We recently reported significantly reduced abundance of a number of mitochondrial proteins in subcutaneous adipocytes of typical insulin-resistant individuals compared with insulin-sensitive individuals, but that these reductions were less pronounced when insulin-resistant and insulin-sensitive subjects were matched for adiposity.14 Here we demonstrate that mitochondrial proteins are overrepresented among the proteins increased in abundance by pioglitazone consistent with the increased adipocyte mitochondrial content. In contrast, in the only proteomics study thus far investigating the effect of thiazolidinediones on adipose tissue in humans, no significant increases in mitochondrial proteins were observed after 2 weeks of rosiglitazone treatment in obese healthy individuals.15 This may be due to differences between the thiazolidinediones used and the length of treatment but more likely differences in the proteomics techniques. While we employed an unbiased highly sensitive global proteomics approach, two-dimensional gel electrophoresis in combination with electrospray ionization–liquid chromatography–tandem mass spectrometry as used in Ahmed et al.,15 is significantly limited in the comparison of mitochondrial protein abundances as it is relatively inaccurate in protein quantification and very restricted in the detection of low abundance, very hydrophobic, extreme molecular weight and extreme pI proteins.16,17
We assessed intrinsic mitochondrial function by measuring the rotenone-sensitive NADH cytochrome c reductase activity of isolated adipocyte mitochondria. Although this assay just reflects complex I and complex III activity, reactive oxygen species, which are largely responsible for the adverse metabolic consequences of nutrient overload, high-fat diet and obesity,30,31 are predominantly produced at these sites.27 Our observation that rotenone-sensitive NADH cytochrome c reductase activity of isolated adipocyte mitochondria was similar between AGT and NGT subjects and unaltered after 3 months of pioglitazone treatment therefore suggests that intrinsic mitochondrial function in adipocytes is not a major modulator of systemic insulin sensitivity in humans.
With the opportunity of global proteomics analyses, a secondary aim of the present study was to better understand the mechanisms of action of the PPAR-γ agonist in adipocytes at a molecular level. As mentioned above, we found preferential increases in mitochondrial protein levels after pioglitazone treatment. Consistent with previously reported changes in gene expression,13,32,33 this included several involved in fat oxidation and triglyceride synthesis, which may be involved in the improvement in systemic insulin sensitivity and lipid metabolism. Aside from mitochondrial proteins, we unexpectedly found markedly increased abundance in collagen VI (A2 and A3 isoforms), a highly enriched component of the extracellular matrix in adipose tissue.34 Results from cell culture experiments, knockout mouse models and human adipose tissue biopsies have implicated collagen VI in fibrosis and metabolic dysregulation in obesity at least in part due to restricted expansion of adipose tissue during states of excess caloric intake;35–38 further, pioglitazone, which alleviates the metabolic dysregulation in obesity, decreased adipose tissue COL6A3 mRNA in T2D patients.37 Potential explanations for these seemingly conflicting findings are that collagen gene expression is 4- to 12-fold greater in the stromal vascular fraction than adipocytes in humans,36 indicating that cells within the stromal vascular fraction rather adipocytes are the main source of adipose tissue collagen. Alternatively, it is possible that pioglitazone reduces the secretion of collagen VI into the extracellular space such that it accumulates within adipocytes and that changes in mRNA levels do not translate into corresponding changes in protein levels.
Another novel finding is the decreased abundance of cytoskeletal proteins in adipocytes after pioglitazone treatment, which we had previously found to be increased in insulin-resistant individuals.14 Interestingly, we also had observed increased microtubule-related proteins but decreased mitochondrial proteins in insulin-resistant skeletal muscle in an earlier proteomics study.23 Since interactions between the cytoskeletal network and mitochondria play critical roles in mitochondrial fusion and fission, morphology, localization as well as function,39 these observations not only suggest the existence of such reciprocal changes across several tissues but also a possible link between cytoskeletal and mitochondrial changes in insulin resistance and the response to thiazolidinediones.
Lastly, we found that pioglitazone reduced the adipocyte abundance of adenosine kinase, an enzyme that converts adenosine into AMP and ADP using ATP as a phosphate donor, which stimulates lipolysis and reduces lipogenesis.40,41 This reduced abundance is in keeping with the decreased plasma NEFA concentrations and the increased subcutaneous adipose tissue by thiazolidinediones. Unexpectedly, less abundant were also low-density lipoprotein receptor-related protein 1, which is involved in triglyceride-rich lipoprotein clearance, and long-chain fatty acid–CoA ligase 3, which activates long-chain fatty acids for synthesis of cellular lipids and degradation via beta-oxidation. However, we obtained the adipose tissue biopsies at a time when the major metabolic effects, including adipose tissue expansion, of pioglitazone have already taken place.42 Therefore, these reduced abundances might have been compensatory, and different results might have been observed at an earlier time point. Of note, caution should also be applied in interpreting the proteomics data as we subjected 151 proteins to statistical analysis, of which 40 were significant (P<0.05). This resulted in a false discovery rate of approximately 19%, similar to several previous proteomics studies.14,43,44
In summary, the present study indicates that the mitochondrial content of subcutaneous adipocytes is deficient in insulin-resistant individuals and correlates with systemic lipid metabolism, inflammation and insulin sensitivity independent of age and adiposity. Pioglitazone induces mitochondrial biogenesis and reorganization, and alters extracellular matrix and cytoskeletal proteins in adipocytes in insulin-resistant individuals. In contrast, the intrinsic function of adipocyte mitochondria appears unaffected in insulin resistance and by pioglitazone. These findings provide new information about the role of adipocyte mitochondria in whole-body metabolism and the molecular mechanisms of action of thiazolidinediones in humans.
Supplementary Material
Acknowledgments
This study was supported by NIH grants R01DK081750 (to ZY), R01DK107666 (to ZY) and R21DK082820 (to CM), the Translational Science Award 1-13-TS-27 (to ZY), the Clinical Research Grant 1-09-CR-39 (to CM) from the American Diabetes Association and a grant from Takeda Pharmaceuticals (to CM). We gratefully acknowledge the assistance of the CRU staff and especially thank the study volunteers.
Footnotes
CONFLICT OF INTEREST
This study was in part supported by a grant from Takeda Pharmaceuticals.
Supplementary Information accompanies this paper on International Journal of Obesity website (http://www.nature.com/ijo)
References
- 1.Kusminski CM, Scherer PE. Mitochondrial dysfunction in white adipose tissue. Trends Endocrinol Metab. 2012;23:435–443. doi: 10.1016/j.tem.2012.06.004. [DOI] [PMC free article] [PubMed] [Google Scholar]
- 2.Mracek T, Drahota Z, Houstek J. The function and the role of the mitochondrial glycerol-3-phosphate dehydrogenase in mammalian tissues. Biochim Biophys Acta. 2013;1827:401–410. doi: 10.1016/j.bbabio.2012.11.014. [DOI] [PubMed] [Google Scholar]
- 3.Haring HU, Rinninger F, Kemmler W. Decreased insulin sensitivity due to a postreceptor defect as a consequence of ATP-deficiency in fat cells. FEBS Lett. 1981;132:235–238. doi: 10.1016/0014-5793(81)81168-4. [DOI] [PubMed] [Google Scholar]
- 4.Steinfelder HJ, Joost HG. Reversible reduction of insulin receptor affinity by ATP depletion in rat adipocytes. Biochem J. 1983;214:203–207. doi: 10.1042/bj2140203. [DOI] [PMC free article] [PubMed] [Google Scholar]
- 5.Koh EH, Park JY, Park HS, Jeon MJ, Ryu JW, Kim M, et al. Essential role of mitochondrial function in adiponectin synthesis in adipocytes. Diabetes. 2007;56:2973–2981. doi: 10.2337/db07-0510. [DOI] [PubMed] [Google Scholar]
- 6.Wilson-Fritch L, Nicoloro S, Chouinard M, Lazar MA, Chui PC, Leszyk J, et al. Mitochondrial remodeling in adipose tissue associated with obesity and treatment with rosiglitazone. J Clin Invest. 2004;114:1281–1289. doi: 10.1172/JCI21752. [DOI] [PMC free article] [PubMed] [Google Scholar]
- 7.Rong JX, Qiu Y, Hansen MK, Zhu L, Zhang V, Xie M, et al. Adipose mitochondrial biogenesis is suppressed in db/db and high-fat diet-fed mice and improved by rosiglitazone. Diabetes. 2007;56:1751–1760. doi: 10.2337/db06-1135. [DOI] [PubMed] [Google Scholar]
- 8.Choo HJ, Kim JH, Kwon OB, Lee CS, Mun JY, Han SS, et al. Mitochondria are impaired in the adipocytes of type 2 diabetic mice. Diabetologia. 2006;49:784–791. doi: 10.1007/s00125-006-0170-2. [DOI] [PubMed] [Google Scholar]
- 9.Bostrom P, Wu J, Jedrychowski MP, Korde A, Ye L, Lo JC, et al. A PGC1-alpha-dependent myokine that drives brown-fat-like development of white fat and thermogenesis. Nature. 2012;481:463–468. doi: 10.1038/nature10777. [DOI] [PMC free article] [PubMed] [Google Scholar]
- 10.Roberts LD, Bostrom P, O’Sullivan JF, Schinzel RT, Lewis GD, Dejam A, et al. Beta-aminoisobutyric acid induces browning of white fat and hepatic beta-oxidation and is inversely correlated with cardiometabolic risk factors. Cell Metab. 2014;19:96–108. doi: 10.1016/j.cmet.2013.12.003. [DOI] [PMC free article] [PubMed] [Google Scholar]
- 11.Rao RR, Long JZ, White JP, Svensson KJ, Lou J, Lokurkar I, et al. Meteorin-like is a hormone that regulates immune-adipose interactions to increase beige fat thermogenesis. Cell. 2014;157:1279–1291. doi: 10.1016/j.cell.2014.03.065. [DOI] [PMC free article] [PubMed] [Google Scholar]
- 12.Kaaman M, Sparks LM, van Harmelen V, Smith SR, Sjolin E, Dahlman I, et al. Strong association between mitochondrial DNA copy number and lipogenesis in human white adipose tissue. Diabetologia. 2007;50:2526–2533. doi: 10.1007/s00125-007-0818-6. [DOI] [PubMed] [Google Scholar]
- 13.Bogacka I, Xie H, Bray GA, Smith SR. Pioglitazone induces mitochondrial bio-genesis in human subcutaneous adipose tissue in vivo. Diabetes. 2005;54:1392–1399. doi: 10.2337/diabetes.54.5.1392. [DOI] [PubMed] [Google Scholar]
- 14.Xie X, Yi Z, Sinha S, Madan M, Bowen BP, Langlais P, et al. Proteomics analyses of subcutaneous adipocytes reveal novel abnormalities in human insulin resistance. Obesity. 2016;24:1506–1514. doi: 10.1002/oby.21528. [DOI] [PMC free article] [PubMed] [Google Scholar]
- 15.Ahmed M, Neville MJ, Edelmann MJ, Kessler BM, Karpe F. Proteomic analysis of human adipose tissue after rosiglitazone treatment shows coordinated changes to promote glucose uptake. Obesity. 2009;18:27–34. doi: 10.1038/oby.2009.208. [DOI] [PubMed] [Google Scholar]
- 16.Rabilloud T, Kieffer S, Procaccio V, Louwagie M, Courchesne PL, Patterson SD, et al. Two-dimensional electrophoresis of human placental mitochondria and protein identification by mass spectrometry: toward a human mitochondrial proteome. Electrophoresis. 1998;19:1006–1014. doi: 10.1002/elps.1150190616. [DOI] [PubMed] [Google Scholar]
- 17.Jafari M, Primo V, Smejkal GB, Moskovets EV, Kuo WP, Ivanov AR. Comparison of in-gel protein separation techniques commonly used for fractionation in mass spectrometry-based proteomic profiling. Electrophoresis. 2012;33:2516–2526. doi: 10.1002/elps.201200031. [DOI] [PMC free article] [PubMed] [Google Scholar]
- 18.American Diabetes Association. Classification and Diagnosis of Diabetes. Diabetes Care. 2016;39(Suppl 1):S13–S22. doi: 10.2337/dc16-S005. [DOI] [PubMed] [Google Scholar]
- 19.Xie X, Yi Z, Bowen B, Wolf C, Flynn CR, Sinha S, et al. Characterization of the human adipocyte proteome and reproducibility of protein abundance by one-dimensional gel electrophoresis and HPLC-ESI-MS/MS. J Proteome Res. 2010;9:4521–4534. doi: 10.1021/pr100268f. [DOI] [PMC free article] [PubMed] [Google Scholar]
- 20.Jackman MR, Willis WT. Characteristics of mitochondria isolated from type I and type IIb skeletal muscle. Am J Physiol. 1996;270:C673–C678. doi: 10.1152/ajpcell.1996.270.2.C673. [DOI] [PubMed] [Google Scholar]
- 21.Paoletti AC, Parmely TJ, Tomomori-Sato C, Sato S, Zhu D, Conaway RC, et al. Quantitative proteomic analysis of distinct mammalian Mediator complexes using normalized spectral abundance factors. Proc Natl Acad Sci USA. 2006;103:18928–18933. doi: 10.1073/pnas.0606379103. [DOI] [PMC free article] [PubMed] [Google Scholar]
- 22.Zybailov BL, Florens L, Washburn MP. Quantitative shotgun proteomics using a protease with broad specificity and normalized spectral abundance factors. Mol Biosyst. 2007;3:354–360. doi: 10.1039/b701483j. [DOI] [PubMed] [Google Scholar]
- 23.Hwang H, Bowen BP, Lefort N, Flynn CR, De Filippis EA, Roberts C, et al. Proteomics analysis of human skeletal muscle reveals novel abnormalities in obesity and type 2 diabetes. Diabetes. 2010;59:33–42. doi: 10.2337/db09-0214. [DOI] [PMC free article] [PubMed] [Google Scholar]
- 24.Lefort N, Glancy B, Bowen B, Willis WT, Bailowitz Z, De Filippis EA, et al. Increased reactive oxygen species production and lower abundance of complex I subunits and carnitine palmitoyltransferase 1B protein despite normal mitochondrial respiration in insulin-resistant human skeletal muscle. Diabetes. 2010;59:2444–2452. doi: 10.2337/db10-0174. [DOI] [PMC free article] [PubMed] [Google Scholar]
- 25.Caruso M, Ma D, Msallaty Z, Lewis M, Seyoum B, Aljanabi W, et al. Increased interaction with insulin receptor substrate 1, a novel abnormality in insulin resistance and type 2 diabetes. Diabetes. 2014;63:1933–1947. doi: 10.2337/db13-1872. [DOI] [PMC free article] [PubMed] [Google Scholar]
- 26.Bogacka I, Ukropcova B, McNeil M, Gimble JM, Smith SR. Structural and functional consequences of mitochondrial biogenesis in human adipocytes in vitro. J Clin Endocrinol Metab. 2005;90:6650–6656. doi: 10.1210/jc.2005-1024. [DOI] [PubMed] [Google Scholar]
- 27.Brand MD. The sites and topology of mitochondrial superoxide production. Exp Gerontol. 2010;45:466–472. doi: 10.1016/j.exger.2010.01.003. [DOI] [PMC free article] [PubMed] [Google Scholar]
- 28.Lin Y, Berg AH, Iyengar P, Lam TKT, Giacca A, Combs TP, et al. The hyperglycemia-induced inflammatory response in adipocytes: The role of reactive oxygen species. J Biol Chem. 2005;280:4617–4626. doi: 10.1074/jbc.M411863200. [DOI] [PubMed] [Google Scholar]
- 29.Wilson-Fritch L, Burkart A, Bell G, Mendelson K, Leszyk J, Nicoloro S, et al. Mitochondrial biogenesis and remodeling during adipogenesis and in response to the insulin sensitizer rosiglitazone. Mol Cell Biol. 2003;23:1085–1094. doi: 10.1128/MCB.23.3.1085-1094.2003. [DOI] [PMC free article] [PubMed] [Google Scholar]
- 30.Huang CJ, McAllister MJ, Slusher AL, Webb HE, Mock JT, Acevedo EO. Obesity-Related Oxidative Stress: the Impact of Physical Activity and Diet Manipulation. Sports Med Open. 2015;1(1):32. doi: 10.1186/s40798-015-0031-y. [DOI] [PMC free article] [PubMed] [Google Scholar]
- 31.Fisher-Wellman KH, Neufer PD. Linking mitochondrial bioenergetics to insulin resistance via redox biology. Trends Endocrin Met. 2012;23:142–153. doi: 10.1016/j.tem.2011.12.008. [DOI] [PMC free article] [PubMed] [Google Scholar]
- 32.Kolak M, Yki-Jarvinen H, Kannisto K, Tiikkainen M, Hamsten A, Eriksson P, et al. Effects of chronic rosiglitazone therapy on gene expression in human adipose tissue in vivo in patients with type 2 diabetes. J Clin Endocrinol Metab. 2007;92:720–724. doi: 10.1210/jc.2006-1465. [DOI] [PubMed] [Google Scholar]
- 33.Sears DD, Hsiao G, Hsiao A, Yu JG, Courtney CH, Ofrecio JM, et al. Mechanisms of human insulin resistance and thiazolidinedione-mediated insulin sensitization. Proc Natl Acad Sci USA. 2009;106:18745–18750. doi: 10.1073/pnas.0903032106. [DOI] [PMC free article] [PubMed] [Google Scholar]
- 34.Scherer PE, Bickel PE, Kotler M, Lodish HF. Cloning of cell-specific secreted and surface proteins by subtractive antibody screening. Nat Biotechnol. 1998;16:581–586. doi: 10.1038/nbt0698-581. [DOI] [PubMed] [Google Scholar]
- 35.Khan T, Muise ES, Iyengar P, Wang ZV, Chandalia M, Abate N, et al. Metabolic dysregulation and adipose tissue fibrosis: Role of collagen VI. Mol Cell Biol. 2009;29:1575–1591. doi: 10.1128/MCB.01300-08. [DOI] [PMC free article] [PubMed] [Google Scholar]
- 36.Divoux A, Tordjman J, Lacasa D, Veyrie N, Hugol D, Aissat A, et al. Fibrosis in human adipose tissue: composition, distribution, and link with lipid metabolism and fat mass loss. Diabetes. 2010;59:2817–2825. doi: 10.2337/db10-0585. [DOI] [PMC free article] [PubMed] [Google Scholar]
- 37.Pasarica M, Gowronska-Kozak B, Burk D, Remedios I, Hymel D, Gimble J, et al. Adipose tissue collagen VI in obesity. J Clin Endocrinol Metab. 2009;94:5155–5162. doi: 10.1210/jc.2009-0947. [DOI] [PMC free article] [PubMed] [Google Scholar]
- 38.Spencer M, Yao-Borengasser A, Unal R, Rasouli N, Gurley CM, Zhu B, et al. Adipose tissue macrophages in insulin-resistant subjects are associated with collagen VI and fibrosis and demonstrate alternative activation. Am J Physiol. 2010;299:E1016–E1027. doi: 10.1152/ajpendo.00329.2010. [DOI] [PMC free article] [PubMed] [Google Scholar]
- 39.Anesti V, Scorrano L. The relationship between mitochondrial shape and function and the cytoskeleton. Biochim Biophys Acta. 2006;1757:692–699. doi: 10.1016/j.bbabio.2006.04.013. [DOI] [PubMed] [Google Scholar]
- 40.Fredholm BB. Adenosine and lipolysis. Int J Obes. 1981;5:643–649. [PubMed] [Google Scholar]
- 41.Daval M, Foufelle F, Ferré P. Functions of AMP-activated protein kinase in adipose tissue. J Physiol. 2006;574:55–62. doi: 10.1113/jphysiol.2006.111484. [DOI] [PMC free article] [PubMed] [Google Scholar]
- 42.Yki-Järvinen H. Thiazolidinediones. N Engl J Med. 2004;351:1106–1118. doi: 10.1056/NEJMra041001. [DOI] [PubMed] [Google Scholar]
- 43.Rahimov F, King OD, Leung DG, Bibat GM, Emerson CP, Jr, Kunkel LM, et al. Transcriptional profiling in facioscapulohumeral muscular dystrophy to identify candidate biomarkers. Proc Natl Acad Sci USA. 2012;109:16234–16239. doi: 10.1073/pnas.1209508109. [DOI] [PMC free article] [PubMed] [Google Scholar]
- 44.Geetha T, Langlais P, Luo M, Mapes R, Lefort N, Chen SC, et al. Label-free proteomic identification of endogenous, insulin-stimulated interaction partners of insulin receptor substrate-1. J Am Soc Mass Spectrom. 2011;22:457–466. doi: 10.1007/s13361-010-0051-2. [DOI] [PMC free article] [PubMed] [Google Scholar]
Associated Data
This section collects any data citations, data availability statements, or supplementary materials included in this article.