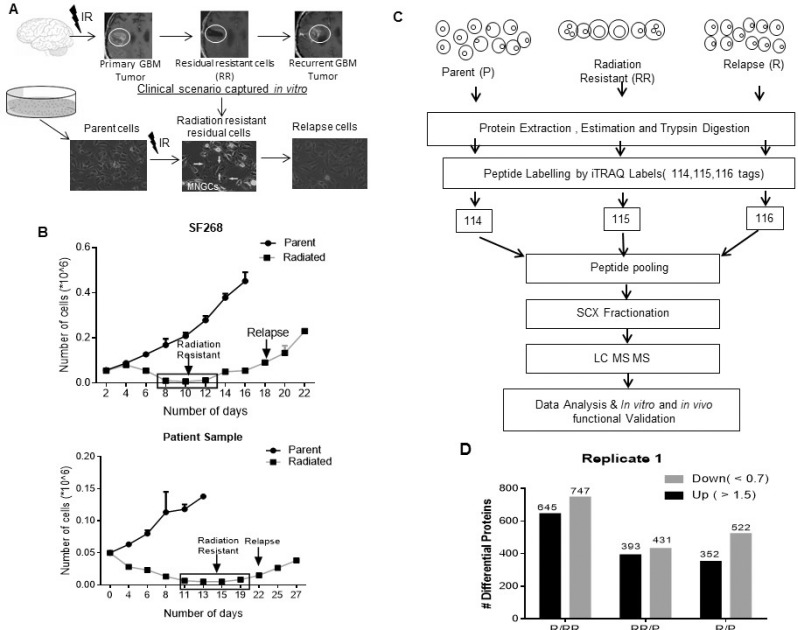
Figure 1. In vitro radiation resistant model.
(A) The illustration depicts the clinical scenario in patient’s pre and post treatment in which post-surgery there is a significant regression or complete abolishment of the tumor observed. However, in >90% cases tumor recurs. This clinical scenario was recapitulated in an in vitro model. The images represent the SF268 Parent, innate Radiation Resistant (RR) enriched with multinucleated giant cells (MNGCs) and Relapse (R) population. (B) Graph represents the growth kinetics of SF268 and Patient Sample post lethal dose of radiation. (C) A schematic representation of the proteomics workflow. (D) Graphical representation of the number of differential proteins identified in the RR and R w.r.t P and R w.r.t RR by the proteomic analysis. Results in each bar graph are the composite data from three independent experiments performed in triplicate (mean ± SEM)

