

Abstract
Glioblastoma (GBM) is one of the most common and lethal forms of primary brain tumors in human adults. Treatment options are limited, and in most cases ineffective. Natural products are sources of novel compounds endowed with therapeutic properties in many human diseases like cancer. ε-viniferin is a resveratrol dimer and well known for having antiproliferative and apoptotic effects on cancer cells. Cisplatin is a platinum containing anti-cancer drug. In this study, we aimed to investigate antiproliferative and apoptotic effects of using cis-platin and ε-viniferin alone or in combined treatment of C6 cells. Cell proliferation was detected by WST-1. Mitochondrial membrane potential changes in the cells (ΔΨm) were evaluated using cationic dye JC1. Apoptotic index which is a hallmark of late apoptosis was detected by using Terminal deoxynucleotidyl transferase dUTP nick end labeling (TUNEL) method and apoptotic alterations were observed by transmission electron microscope (TEM). Activation of caspase-8, -9, -3 in C6 cells at various incubation periods was measured by flow cytometer. Apoptotic index increased at highest level in only combined treatment cells (91.6%) after 48 h incubation. These results were supported by TEM images. Caspase-8 activation in C6 cells increased to a maximum (12.5%) after 6 h by using combined cis-platin/ε-viniferin treatment (13.25/95 μM). Caspase-9 was activated at 44.5% after combined treatment for 24 h. This rate is higher than using cis-platin (14.2%) or ε-viniferin (43.3%) alone. The combined 13.25 μM/cisplatin and 95 μM ε-viniferin treatment caused maximum caspase-3 activation in C6 cells (15.5%) at the end of the 72 h incubation. In conclusion, it was observed that caspase-8, -9, -3 activation which was determined in vitro, trigerred apoptotic mechanism in C6 cells by using low concentrations of combined cis-platin and ε-viniferin.
Keywords: Glioma cell, ε-Viniferin, Apoptosis, Combined treatment
Introduction
Glioma is the most aggressive primary cancer in the central nervous system, especially in brain (Tianqin et al. 2016; Ignarro et al. 2017; Sun et al. 2016; Chen et al. 2016) and constitute approximately 30% of all brain and central nervous system tumors and 80% of all malignant brain tumors (Ma et al. 2016). Nowadays, the common clinical treatments of glioblastoma are surgery concomitant with radiotherapy, chemotherapy or combined treatments (Tianqin et al. 2016; Wang et al. 2013). But these treatments are rarely curative because chemotherapy has limited effects (Yang et al. 2014). The major limitations of chemotherapy for treatment of glioblastoma are the inability of many drugs to pass through the blood–brain barrier and their low efficacy for induction of apoptosis. Therefore, the choice of active drugs is limited. Many clinical trials are evaluating new therapeutic agents for treatment of newly diagnosed glioblastoma or recurrent disease (Das et al. 2010). Currently, researches are focused on new agents and novel targets for treatment of glioma (Wang et al. 2012).
Dietary phytochemicals such as adjuvants have been suggested to play important roles in enhancing chemotherapeutic potential owing to multitargeted chemopreventive properties and lack of substantial toxicity (Lee et al. 2013). ε-viniferin (ε-VNF) is an antioxidant and formed from resveratrol by oxidative processes (Zghonda et al. 2011). Resveratrol and its oligomers, including ε-VNF, have also been suggested to show anti-proliferative and pro-apoptotic effects on cancer cells such as human hepatoma HepG2 cells, and human colon cancer cells (Zghonda et al. 2011; Colin et al. 2008; Ozdemir et al. 2014).
Anti-cancer drug cisplatin (CDDP), a first-generation platinum complex, cross-links DNA and thus prevents cell division by mitosis (Su et al. 2012; Lee et al. 2016). The most prominent anticancer effect of CDDP is oxidative stress, DNA damage and apoptosis induction (Hu et al. 2016). However, most of these drugs have serious side effects due to cytotoxicity on normal cells (Rai et al. 2016).
Many studies have also shown that the combined use of natural products and chemotherapy agents can increase the sensitivity and cytotoxicity of chemotherapy agents (Lee et al. 2016; Hu et al. 2016).
A potentially chemopreventive agent should exert its antioxidant or cytoprotective effects at concentrations much lower than cytotoxic effects, while a chemotherapeutic agent should induce cytostasis and/or apoptosis in cancer cells at concentrations lower than those being cytotoxic to non-proliferating cells (Rüweler et al. 2009).
Motivated by the present understanding of combination effect and CDDP and ε-VNF applied alone, we made an effort to delineate the molecular pathways modulated by combined effect of CDDP and ε-VNF in C6 cell lines.
Materials and methods
Cell cultures and reagents
The Glioma cell lines (C6) was obtained from the German Collection of Microorganisms and Cell Culture (DSMZ) (Leibniz Institute, Braunschweig, Germany) and maintained in Dulbecco’s Modified Eagle Medium (DMEM) (Sigma, Munich, Germany) which was supplemented with 10% FBS (Gibco, Paisley, UK), 100 U/mL penicillin/streptomycin and 2 mM l-glutamine. Exponentially growing cultures were maintained in an incubator with a humidified atmosphere with 5% CO2/95% air at 37 °C. CDDP was purchased from Sigma-Aldrich (Germany), ε-VNF was from Actichem (Montauban, France).
Cell proliferation assay
Cell proliferation was measured by the WST-1 (Roche, Mannheim, Germany) assay measuring the activity of mitochondrial dehydrogenases, performed following the manufacturer’s instructions at 12, 24 and 48 h time points. The cells were seeded at a concentration of 2 × 10⁴ cells/well in culture medium containing various amounts of CDDP (5 or 35 μM) and ε-VNF (95 or 130 μM), alone or in combination (13.25 µM CDDP + 95 µM ε-VNF or 16.25 µM CDDP + 127.5 µM ε-VNF). After period of time, 10 μl/well cell proliferation reagent WST-1 was added to each well, followed by incubation for an additional 4 h at 37 °C and 5% CO2. The absorbance of the treated cells against a background control as a blank was measured between 420–480 nm using a microplate (ELISA, ELX 808 IU, Bio-Tek, Winooski, VT, USA) reader.
Determination of cell index by real-time cell analysis method (RTCA)
xCELLigence Real-Time Cell Analyzer (RTCA) (DP, Roche, San Diego, CA, USA) was used for real-time and time-dependent analysis of binding of CDDP, ε-VNF and (CDDP + ε-VNF) combined group. The RTCA measure changes in electrical impedance as cell attach and spread in a multi-well plates covered with a gold microelectrode array (Rahim and Üren 2011). C6 Glioma cells were seeded using 16 well plates as 1 × 10⁴ cells in each well. After two hours of cell binding, they were incubated with CDDP (5, 15, 25, 35, 45 μM), ε-VNF (95, 105, 115, 130 μM) separately or in (CDDP + ε-VNF) combination (13.25 + 95 μM; 14.25 +105 μM; 15.25 +115 μM; 16.25 +127.5 μM; 17.25 +140 μM) in a RTCA at 30 min interval for 24 h at 37 °C. The electrical impedance is expressed as cell index (CI) value which calculates the number of the cells attached and spread on the bottom of the well. CI was calculated using a formula as mentioned below. CI = (resistance measured at a given time point − resistance measured without the cell) / 15Ω Normalized Cell Index (NCIti) is calculated as the Cell Index CIti at a given time point divided by the Cell Index CInml_time at the normalization time point (nml_time), as below: NCIti = CIti/CInml_time. Thus, the Normalized Cell Index for all wells must equal one (1) at the normalization time point.
Mitochondrial transmembrane potential (ΔΨm) assay
The ΔΨm was determined using tetraethylbenzimidazolylcarbocyanine iodide (JC-1 probe) (BD™ MitoScreen, San Diego, CA, USA) (RUO). In brief, C6 rat glioma cells were treated with CDDP (5–35 μM), ε-VNF (95–130 μM), and a combination of (CDDP + ε-VNF) (13.25 μM CDDP + 95 μM ε-VNF; 16.25 μM CDDP + 127.5 μM ε-VNF) for 6, 12, 24 h, incubated with 5 μM JC-1 at 37 °C for 15 min, and then washed and resuspended in cold PBS. Cells were analyzed using FACS Vantage flow cytometer according to the instructions given in BD™. Finally, a dot plot of red fluorescence (FL2, living cells with intact ΔΨm) versus green fluorescence (FL1, cells with lost ΔΨm) was recorded.
Transmission electron microscopic observation (TEM)
After treatment with CDDP and ε-VNF, alone or in combination, C6 cells were fixed in 2.5% (v/v) glutaraldehyde in 0.1 M phosphate buffer (pH 7.4), and left in PBS overnight at 4 °C and treated with 2% (w/v) osmium tetraoxide (Sigma). The cells were dehydrated gradually with 70, 90, 96 and 100% ice-cold ethanol, embedded in EPON 812 epoxy (Sigma). They were thin-sectioned using a glass knife to a maximum thickness of 100 nm. The sections were stained with lead citrate (Sigma, Steinheim, Germany) and uranyl acetate (Polysciences, Inc., Warrington, PA, USA) and finally observed and recorded under a transmission electron microscope (FEI Tecnai Spirit 120 kV; FEI Co., Eindhoven, Netherlands) (Johnson 1979).
TUNEL assay
Cells were grown on 24-well microplates and were treated with CDDP, ε-VNF and combination of them based on the cell proliferation assay. The fragmented DNA of apoptotic cells was quantified by terminal deoxynucleotidyl transferase deoxyuridine triphosphate (dUTP) nick end labeling (TUNEL) with the In Situ Cell Death Detection Kit, Flourescein (Roche). Briefly, the cells per well were fixed with 4% paraformaldehyde and incubated at 15–25 °C and washed with phosphate-buffered saline (PBS) for 30 min. Each well was then incubated in permeabilisation solution for 2 min on ice. The cells were washed with PBS twice. Then 50 μL of TUNEL Reaction Mixture was added to each well. The microplate was covered with parafilm and the cells were incubated for 60 min at 37 °C in a container, to protect cells from any light source. After incubation, each well was washed with PBS for three times. After washing with PBS, the slides were dried and fluorescent images were acquired with a fluorescence microscope (Leica, Wetzlar, Germany).
Caspase-3, -8 and -9 activities assay
Caspase-3, caspase-8 and caspase-9 activity assay kits were used to measure the activities of caspase-3 (BD Biosciences Pharmingen, San DIego, CA, USA), caspase-8 (Merck Millipore, Temecula, CA, USA) and caspase-9 (Becton-Dickinson, San DIiego, CA, USA) in each treated group. Procedures were performed according to the manufacture’s protocols. Samples were analyzed on a Becton–Dickinson FACS Aria flow cytometer (BD FACS AriaTM I Cell Sorter Flow Cytometer, Serial No: P07900204) using FACSDiva Version 6.1.2. Software.
Statistical analysis
MTT results are expressed as mean ± standard deviation and were statistically analyzed using one-way ANOVA test using the Graphpad programme.
Results
The inhibition of cell proliferation by CDDP and ε-VNF, alone or in combination
The effects of CDDP, ε-VNF, and the combination of these two drugs on the proliferation of C6 cells for 12, 24 and 48 h were investigated by high sensitive cell proliferation reagent, WST-1. As shown in Fig. 1, all treatments, except the lower concentration of CDDP (5 μM for 12 h) decreased the cell proliferation in a dose- and time-dependent manner. The cell proliferation of C6 cells was found about 100% even higher after treatment with 5 μM CDDP for 12 and 24 h. However, the longer incubation with 5 μM CDDP resulted in a significant decrease of cell proliferation up to 29%. Increasing the concentration of CDDP about seven fold caused a slight decrease in cell proliferation 74% at 12 h (****p < 0.0001), 85% at 24 h (**p < 0.01) and 71% at 48 h (****p < 0.0001) as compared to 5 μM CDDP. On the other hand, treatment of cells with 130 μM or 95 μM of ε-VNF had a similar effect on cell proliferation even after 48 h incubation time (Fig. 1a).
Fig. 1.

Cell proliferation (%) of a CDDP, ε-VNF and higher concentrations of combination of CDDP and ε-VNF and b CDDP, ε-VNF and lower doses of combination of CDDP and ε-VNF at 12, 24 and 48 h on C6 cell lines determined by WST-1. Data are representative of tree independent trials and are expressed as the mean ± SD. Significant differences between cell proliferation at 12, 24 and 48 h were indicated by *p < 0.05; ** p < 0.01; **** p < 0.0001
It has been also investigated whether the addition of CDDP together with ε-VNF to C6 cells had any benefits, therefore cells were treated with either 13.25 μM CDDP + 95 μM ε-VNF or 16.25 μM CDDP + 127.5 μM ε-VNF combination for 12, 24 and 48 h. As shown in Fig. 1b, a significant decline of cell proliferation was observed in cells incubated with combination of CDDP and ε-VNF in comparison with cells treated alone with one or the other drug for 24 and 48 h (****p < 0.0001). However the differences in C6 cell proliferation rate were not significant in the presence of either ε-VNF alone or CDDP combined with ε-VNF for 12 h, the proliferation rates measured in these conditions were found between 21–27%.
Cell viability assay
The effect of CDDP + ε-VNF on cell viability was tested using the RTCA system. CI values were obtained at 15-min intervals for period of 24 and 48 h (Fig. 2). After adding cells to 16 well plates, different concentrations (5 μM CDDP + 95 μM ε-VNF); (15 μM CDDP + 105 μM ε-VNF); (25 μM CDDP + 115 μM ε-VNF); (35 μM CDDP + 130 μM ε-VNF); (40 μM CDDP + 140 μM ε-VNF) of CDDP + ε-VNF were added to each well and a dose-dependent reduction in viability of cells treated with a combination of 15 μM CDDP + 105 μM ε-VNF was found after 24 h incubation time (Fig. 2).
Fig. 2.

xCELLigence real-time cell analyzer (RTCA) impedance profiles of E-plates containing C6 cells treated with different concentrations (CDDP + ε-viniferin) for 48 h. The different (CDDP + ε-VNF) concentrations (5 μM CDDP + 95 μM ε-VNF) (green); (15 μM CDDP + 105 μM ε-VNF) (dark blue); (25 μM CDDP + 115 μM ε-VNF) (pink); (35 μM CDDP + 130 μM ε-VNF) (cyan); (40 μM CDDP + 140 μM ε-VNF) (purple) are color-coded. The red line represents the profile of the control sample. (Color figure online)
Assessment of mitochondrial membrane potential (ΔΨm)
Measurement of the mitochondrial membrane potential percentage changes of the cells undergoing agent-induced apoptosis showed that, when compared to control groups, a dosage of 35 μM CDDP administered for 12 h alone resulted in 31.7% depolarization, and that with a dossage of 130 μM ε-VNF, 32% depolarization occured. However, in the combined usage 16.25 + 127.5 μM (CDDP +ε-VNF), ΔΨm increased to 44.8%. These findings show that the combined use of 16.25 µM CDDP + 127.5 µM ε-VNF resulted in an increase in depolarization and initiation of apoptosis at 12 h in comparison to high-dose CDDP (Fig. 3, Table 1). These findings show that combined administration of low dose CDDP and ε-VNF is more effective than single high dose drug administration.
Fig. 3.

Mitochondrial membrane permeabilization (MMP) of CDDP (35 μM), ε-VNF (130 μM), and CDDP + ε-VNF (16.25 + 127.5 μM) in C6 glioma cells for 12 h. Mitochondrial membrane permeabilization (MMP) was determined by flow cytometry using JC-1. The percentages of cells with MMP (blue) were calculated. Gates defined as nonapoptotic, healthy cells (P2), apoptotic cells (P3). (Color figure online)
Table 1.
Effect of CDDP, VNF, and combined treatments on mitochondrial membrane potential in C6 cells. Data refer to the percentage of cells with intact ΔΨm (polarize) and fold ΔΨm (depolarize). C6 cells, were treated with /without drugs for 6, 12, 24 h.
| Treatment | 6 h | 12 h | 24 h | |||
|---|---|---|---|---|---|---|
| Intact ΔΨm | Fold ΔΨm | Intact ΔΨm | Fold ΔΨm | Intact ΔΨm | Fold ΔΨm | |
| Control | 99.6 | 3.2 | 97.3 | 2 | 90.6 | 9.4 |
| CDDP 35 μM | 90 | 9.9 | 68.8 | 31.7 | 93.3 | 6.7 |
| CDDP 5 μM | 87.5 | 12.6 | 89.2 | 10.9 | 94.2 | 5.6 |
| ε-VNF 130 μM | 94.5 | 5.5 | 66.5 | 32 | 81.3 | 18.5 |
| ε-VNF 95 μM | 89.4 | 10.6 | 69.8 | 30 | 90.4 | 9.6 |
| CDDP + ε-VNF (16.25 + 127.5 μM) | 91.2 | 8.8 | 53.8 | 44.8 | 84.5 | 15.3 |
| CDDP + ε-VNF (13.25 + 95 μM) | 88.5 | 11.5 | 69.2 | 30.7 | 82.2 | 10.6 |
Morphology changes observed by transmission electron microscopy (TEM)
To explore whether a decrease in cell viability induced by CDDP and ε-VNF is due to induction of cell apoptosis, we analyzed morphological changes in C6 cells after treatment with both drugs. The subcellular changes induced by 35 μM CDDP, 130 μM ε-VNF alone, or (16.25 μM CDDP + 127.5 μM ε-VNF) combination (Fig. 4a) and 5 μM CDDP, 95 μM ε-VNF alone, or (13.25 μM CDDP + 95 μM ε-VNF) combination (Fig. 4b) in C6 cells were investigated by transmission electron microscopy. In the rat C6 glioma cells (control group), which have not been treated for 48 h in our study, the nucleus and cell membrane were smooth, the endoplasmic reticulum and mitochondria were smooth and the cristae can be distinguished. Cells treated with the 35 μM CDDP dose appeared to have impaired core and cytoplasm integrity after 48 h (Fig. 4a). Cells treated with 5 μM CDDP were less susceptible to damage but apoptosis was distinguished by slight condensation of chromatin structure in the nucleus and slight contraction in the nucleus membrane (Fig. 4b). The 16.25 μM CDDP + 127.5 μM ε-VNF combination showed degradation of core integrity and chromatin condensation (Fig. 4a). Moreover, cytoplasm integrity is disappearing after almost 48 h. At the dose of (13.25 CDDP + 95 μM ε-VNF), degradation of cytoplasmic organelles resulted in dense chromatin condensation and deterioration of the nucleus membrane (Fig. 4b).
Fig. 4.
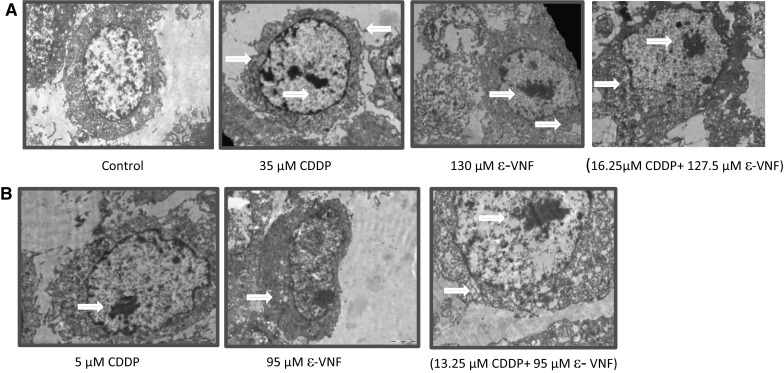
Under electron microscope, the morphological changes of C6 cells were observed after treatment of cisplatin (CDDP), ε-viniferin (ε-VNF), alone, or the combination of both drugs for 48 h compared to control group (a, b). (16.25 μM CDDP + 127.5 μM ε-VNF) and (13.25 μM CCDP + 95 μM ε-VNF) doses showed chromatin condensation and degradation of the nuclear membrane (a, b)
Determination of DNA Fragmentation by TUNEL Method
The formation of apoptotic index in C6 cells incubated with CDDP, ε-VNF and combined drugs (CDDP + ε-VNF) for 12, 24 and 48 h was determined with TUNEL assay. Apoptotic index in the combination group was found to be 67.7% after 12 h of incubation. However, this rate decreased by 41% at low doses when CDDP + ε-VNF were applied at the end of the 24-hour incubation (Table 2). At 48 h, in the untreated control group, no apoptotic index was observed (Fig. 5a); however, apoptotic index was seen after the treatment of C6 cells with 35 μM CDDP (77.8%) (Fig. 5b), 130 μM ε-VNF (50%) (Fig. 5b) and combined (16.25 μM CDDP + 127.5 μM ε-VNF) (84.2%) (Fig. 5f) and (13.25 μM CDDP + 95 μM ε-VNF) (91.6%) (Fig. 5g). As a result, C6 cells were found to be directed to undergo apoptosis due to DNA fragmentation detected after incubation for 48 h with different doses of CDDP, ε-VNF and combined agents (CDDP + ε-VNF) (Fig. 5, Table 2).
Table 2.
TUNEL assay: apoptotic index of C6 cells treated for 12, 24 and 48 h by CDDP, ε-VNF and combination of CDDP + ε-VNF
| Apoptotic index (%) | 12 h | 24 h | 48 h |
|---|---|---|---|
| Control | 5.45 | 6.1 | 12.1 |
| CDDP (35 μΜ) | 57.5 | 37.2 | 77.8 |
| ε-VNF (130 μM) | 34.1 | 40.0 | 50.0 |
| CDDP/ε-VNF (16.25 + 127.5 μM) | 55.0 | 43.5 | 84.2 |
| CDDP (5 μM) | 23.9 | 21.7 | 42.2 |
| ε-VNF (95 μM) | 20.5 | 35.8 | 47.6 |
| CDDP/ε-VNF (13.25 + 95 μM) | 67.7 | 41.0 | 91.6 |
The highest apoptotic index data determined as a result of low-dose drug administration are indicated in bold
Fig. 5.

Apoptotic cells were detected by green fluorescence. A small number of apoptotic cells was identified in the untreated cells (a) or the cells treated with CDDP alone (b, c), ε-VNF (d, e) and combined treatment (f, g). The highest mean number of apoptotic cells was observed in the CDDP and ε-VNF (13.25 + 95 μM) combination treatment group (g) at 48 h. Arrows point to cells with fragmented DNA which occured actively during the treatment and to apoptotic bodies at 48 h. (Magnification ×40). (Color figure online)
Caspase -3, -8, -9 activity
Caspase activation plays a central role in the execution of apoptosis. In this study, caspase-3, -8 and -9 activities were determined after incubation with different concentrations of CDDP,ε-VNF and combination of both for different duration. C6 cells treated with different concentrations for 12, 24, 48 and 72 h incubation were harvested for caspases-3 activity determination. After 72 h incubation in (13.25 μM CDDP + 95 μM ε-VNF) combination group, caspase-3 activation was found to be maximal in C6 cells (15.5%). The caspase-3 activations of 5 μM CDDP and 95 μM ε-VNF used alone were 14.6 and 15.4%, respectively (Table 3). C6 cells treated with different concentrations for 3, 6, and 12 h were investigated for caspases-8 activity determination. In our study, caspase-8 activation from the initiator of apoptotic cell death was increased (12.4%) after 6 h incubation in the combination group (13.25 μM CDDP + 95 μM ε-VNF). Activation of caspase-8 in the combination group (16.25 CDDP + 127.5 μM ε-VNF) showed an increase of 33.4% (Table 4). Caspase-9 activity of C6 cells was investigated for 12 and 24 h. It was found that 44.5% of cells treated with a combination of 13.25 μM CDDP and 95 μM ε-VNF showed activation of caspase 9 after 24 h of incubation. This ratio is higher than when incubated with CDDP alone (14.2%) and ε-VNF alone (43.3%) for 24 h. This increase in caspase-9 activation suggests that the use of ε-vinifinin in combination with CDDP is effective (Table 5).
Table 3.
Percentage of caspase-3 activity of glioblastoma (C6) cells after CCDP (cisplatin), ε-VNF (ε-viniferin) and CDDP/ε-VNF (cisplatin + ε-viniferin) treatment at different times and concentrations
| 12 h | 24 h | 48 h | 72 h | |||||
|---|---|---|---|---|---|---|---|---|
| Viability (%) | Caspase activity (%) | Viability (%) | Caspase activity (%) | Viability (%) | Caspase activity (%) | Viability (%) | Caspase activity (%) | |
| Control | 99.6 | 0.4 | 95.3 | 4.6 | 94.7 | 5.3 | 93.9 | 6.0 |
| CDDP (35 µΜ) | 99.6 | 0.4 | 91.2 | 8.8 | 95.5 | 4.5 | 85.6 | 14.4 |
| CDDP (5 μM) | 99.7 | 0.3 | 94.7 | 5.3 | 89.4 | 10.6 | 95.3 | 14.6 |
| ε-VNF (130 μM) | 99.4 | 0.6 | 86.1 | 13.9 | 94.4 | 5.6 | 85 | 14.9 |
| ε-VNF (95 μM) | 99.2 | 0.8 | 96.1 | 3.9 | 95.7 | 4.4 | 84.5 | 15.4 |
| CDDP/ε-VNF (16.25 + 127.5 μM) | 99.3 | 0.7 | 91.0 | 9.0 | 98.1 | 1.9 | 89.6 | 10.3 |
| CDDP/ε-VNF (13.25 + 95 μM) | 99.4 | 0.6 | 93.7 | 6.3 | 95.7 | 4.4 | 84.5 | 15.5 |
Table 4.
Percentage of caspase-8 activity of glioblastoma (C6) cells after CDDP (cisplatin), ε-VNF (ε-viniferin) and CDDP/ε-VNF (cisplatin + ε-viniferin) treatment at different times and concentrations
| 3 h | 6 h | 12 h | ||||
|---|---|---|---|---|---|---|
| Viability (%) | Caspase activity (%) | Viability (%) | Caspase-activity (%) | Viability (%) | Caspase activity (%) | |
| Control | 94.2 | 5.8 | 94.6 | 5.4 | 99.6 | 0.3 |
| CDDP (35 µΜ) | 87.4 | 12.6 | 91.9 | 8.1 | 98.5 | 1.5 |
| CDDP (5 μM) | 93.4 | 6.6 | 95.1 | 4.9 | 99.7 | 0.3 |
| ε-VNF (130 μM) | 85.5 | 15.5 | 84.2 | 15.8 | 85.5 | 14.4 |
| ε-VNF (95 μM) | 92.4 | 7.6 | 90.4 | 9.6 | 91.7 | 8.3 |
| CDDP/ε-VNF (16.25 + 127.5 μM) | 87.6 | 12.4 | 66.5 | 33.4 | 72.3 | 27.7 |
| CDDP/ε-VNF (13.25 + 95 μM) | 92.9 | 7.1 | 87.6 | 12.4 | 93.5 | 6.4 |
Bold letters indicate maximum caspase activities depending on drug concentrations
Table 5.
Percentage of caspase-9 activity of glioblastoma (C6) cells after CCDP (cisplatin), ε-VNF (ε-viniferin) and CDDP/ε-VNF (cisplatin + ε-viniferin) treatment at different times and concentrations
| 12 h | 24 h | |||
|---|---|---|---|---|
| Viability (%) | Caspase activity (%) | Viability (%) | Caspase activity (%) | |
| Control | 95.1 | 4.9 | 95.7 | 4.4 |
| CDDP (35 µΜ) | 94.1 | 5.9 | 85.9 | 14.1 |
| CDDP (5 μM) | 97.1 | 2.9 | 85.9 | 14.2 |
| ε-VNF (130 μM) | 72.0 | 28 | 35.3 | 64.7 |
| ε-VNF (95 μM) | 61.1 | 38.8 | 56.6 | 43.3 |
| CDDP/ε-VNF (16.25 + 127.5 μM) | 86.3 | 13.7 | 43.4 | 56.6 |
| CDDP/ε-VNF (13.25 + 95 μM) | 70.7 | 29.2 | 55.4 | 44.5 |
Bold letters indicate maximum caspase activities depending on drug concentrations
Discussion
Glioblastoma is characterized by aggressive and rapid cell growth that manifests itself with the local spread. A multimodal treatment strategy is often used rather than chemotherapy alone. Many of the chemotherapy drugs for glioblastoma therapy are insufficient to pass through the blood–brain barrier, and therefore have low efficacy for apoptosis induction. Hence, the choice of an active drug is limited. Many clinical studies have been conducted to evaluate novel therapeutic agents for treating newly diagnosed glioblastoma or recurrent disease (Das et al. 2010).
Most clinical anticancer drugs to date are derived from natural sources such as vinca alkaloids and taxanes. Therefore, some recent studies focus on herbal medicinal products. Natural products are important sources of anticancer precursor molecules. Many successful anticancer drugs, many of which are still under clinical trials, are derived from natural products (Wang et al. 2014). Consequently, the interest in the use of natural compounds as potential cancer therapeutics and cancer prevention agents has been ever increasing (Xue et al. 2014).
ε-VNF was initially isolated from Vitis vinifera (Vitaceae) and classified as a model for resveratrol biosynthesis. Many studies have been conducted on ε-VNF and its antioxidant and anticancer activities. The antioxidant activity of ε-VNF is essential in inhibiting cancer formed due to chemicals and oxidative damage through inhibition of cancer initiation and progression. ε-VNF has also exhibited a direct cytotoxic effect on various cancer cells. ε-VNF was reported to kill C6, Hep G2 (Ozdemir et al. 2014), HeLa, and MCF-7 cancer cells depending on the dose (Xue et al. 2014).
Apoptosis is the balance between cell proliferation and cell death. The distinctive feature of cancer cells is the imbalance between cell proliferation and apoptosis (Jiang et al. 2012).
Apoptosis is evaluated using transmission electron microscopy, a method by which morphological changes are most accurately observed. Shrinkage, chromatin condensation, and fragmentation can be observed in the cytoplasm, whereas the mitochondrion status can be examined in subcellular details, such as the cell membrane or the deterioration of the nuclear membrane. The nucleus and cell membrane, as well as the endoplasmic reticulum and mitochondria, were smooth and the cristae could be distinguished in the rat C6 glioma cells, which were not treated for 48 h, in the present study (control group). Cells treated with 35 μM CDDP appeared to have impaired core and cytoplasm integrity after 48 h. Cells treated with 5 μM CDDP were less susceptible to damage, but apoptosis was distinguished by slight condensation of chromatin structure in the nucleus and slight contraction in the nuclear membrane. An excessive number of microvillus protrusions were observed in the nuclear membrane treated with (16.25 μM CDDP + 127.5 μM ε-VNF) doses. However, the cytoplasmic integrity disappeared after almost 48 h. Degradation of cytoplasmic organelles, intense chromatin condensation, and deterioration of the nucleus membrane were observed after administration of [13.25 μM CDDP + 95 μM ε-VNF] dose. In a study with findings consistent with the results of the present study, Apigenin (AP) and Hydroxygenkwanin (HGK), which are two natural flavonoid compounds, were given to the C6 glioma cells separately and in combination as (AP + HGK), and the mitochondrial damage of this combination group was observed to be serious (Wang et al. 2014). The present study found that the cytoplasmic integrity was completely lost in the combination (16.25 μM CDDP + 127.5 μM ε-VNF) group after 48 h. WST-1 assay demonstrated that using combined drugs resulted in 20.8% cell viability at 48 h and is consistent with the TEM results.
Loss of mitochondrial membrane potential (MMP, Ψm) is a crucial step in the apoptotic process that kills cells because it leads to the release of various proapoptotic factors from the mitochondria to the cytoplasm (Cao et al. 2011). Numerous studies evaluated MMP using flow cytometry in C6 cells (Bobermin et al. 2017; Murota et al. 2016; Geng et al. 2016). The integrity of the mitochondrial membrane was analyzed using JC-1, a cationic dye, in the present study. JC-1 dye transforms into green color as a marker of ΔΨm impairment in apoptotic cells. Changes in MMP are observed during an interruption in the cell cycle, apoptosis or necrosis. A depolarized mitochondrial membrane generally indicates that the cell is in the early apoptosis process (Darzynkiewicz et al. 2001). Further, in the present study, 31.7 and 32% depolarization was achieved upon treatment of the cells with 35 μM CDDP and 130 μM ε-VNF, respectively, followed by 12-h incubation. However, it was observed that the combined use of 16.25 μM CDDP + 127.5 μM ε-VNF increased depolarization (44.8%). Combined drug use causes an effective response to lower doses of CDDP. A study reported that the treatment of C6 astroglial cells with reseveratrol inhibited the reduction in MMP (Bobermin et al. 2017). Also, 98.3 μM ε-VNF, 52.5 μM vincristine, and a 11.25 μM vincristine + 15.8 μM ε-VNF combination were compared with the control group in a study performed on HepG2 cells, the ΔΨm change after six hours was found to be 19.5% 5.5%, 24.6%, and 3.5%, respectively. This finding suggested that vincristine + ε-VNF combination (24.6%) resulted in early apoptosis of the cell at 6 h (Ozdemir et al. 2016).
Many biochemical and morphological changes are observed in the cell after receiving the signal for apoptosis. Various methods have been developed to detect these changes. One of the methods showing apoptotic index in apoptotic cells is the TUNEL assay (Tdt-mediated dUTP nick end labelling). CDDP as an anticancer drug, ε-VNF as an antioxidant and the combination of these two drugs were administered to C6 glioma cells for 12, 24, and 48 h. Apoptotic cells could not be detected in the C6 glioma cells without administering any drugs. After 48 h of incubation, a high fluorecence intesity of DNA (91.6%) was observed in the 13.25 μM CDDP + 95 μM ε-VNF combination group. After 12 h of incubation, the apoptotic index was determined as 67.7% in the 13.25 μM CDDP + 95 μM ε-VNF combined group. However, as a result of 24-h incubation, this rate decreased by 41% at low doses on CDDP + ε-VNF application. A study conducted by Sun and colleagues examined the role of resveratrol in RG2 and C6 human and rat glioblastoma cells, this is in agreement with the present study (Sun et al. 2013). The growth of RG2 and C6 cells was suppressed by 100 μM resveratrol treatment for 48 h and percentage of apoptotic cells increased in RG2 and C6 cells treated with 100 μM resveratrol to 15.4 and 12.6%, respectively. TUNEL assay showed significant growth inhibition in RG2 and C6 cells treated with 100 μM resveratrol (Sun et al. 2013).
The caspases, primarily synthesized as inactive proteins, are enzymes of cysteine protease group. These are composed of multigene family members playing important roles during apoptotic cell death and are activated in a variety of ways (Yamaguchi and Miura 2015; Mukherjee and Williams 2017). The role of caspases 3, 8, and 9, which are parts of the caspase cascade system in apoptosis were examined in the present study. Caspase 8 activation increased (12.5%) after 6 h of incubation in the 13.25 μM CDDP + 95 μM ε-VNF combination group in C6 cells. A 33.4% caspase 8 activation was observed in 16.25 μM CDDP + 127.5 μM ε-VNF combination group. Several studies on different cell lines have demonstrated that resveratrol dimers induce apoptosis through the extrinsic pathway, depending on the active caspase (Byun et al. 2008; Murias et al. 2008).
Caspase-9 was active at 44.5% in the 13.25 μM CDDP + 95 μM ε-VNF combination group after 24 h of incubation. This ratio was higher when CDDP (14.2%) and ε-VNF (43.3%) were used individually. This indicated that ε-VNF was effective in increasing caspase 9 activation. After 72 h of incubation in the 13.25 μM CDDP + 95 μM ε-VNF combination group, caspase 3 activation was found to be maximum in C6 cells (15%). The caspase 3 activation upon treatment with 5 μM CDDP and 95 μM ε-VNF individually was 14.6 and 15.4%, respectively. Many studies have indicated that resveratrol-induced apoptosis is associated with the activation of the activated effector caspase 3 and subsequent mitochondrial membrane breakdown via the activation of caspase 9 (Billard et al. 2002; Ferry-Dumazet et al. 2002; Park et al. 2001; Roman et al. 2002; Surh et al. 1999). Jakubowicz-Gil et al. (2013) reported that quercetin alone and in combination with temozolomide significantly increased the activity of caspases 3 and 9.
Antioxidants used as cancer treatment and prevention (anticarcinogenic) agents have gained interest, and new antitumor strategies are being developed for cancer treatment and prevention. Recent studies have shown that combination use of ε-VNF with antitumor drug CDDP showed cytotoxic and antiproliferative effects on various cancer cell types such as C6 rat glioma, HepG2 human liver cells, HeLa human cervical cells, MCF-7 human breast cells and HT-29 human colon cells.
In conclusion, this study demonstrated a strong apoptotic effect of the combination of CDDP and ε-VNF. Therefore, it is concluded that the combined use of CDDP and ε-VNF in C6 cells may be useful in treating glioblastoma. This study may serve as the basis for further studies on the use of these two drug combinations in clinical practice.
Acknowledgements
This work was funded by a grant from the Anadolu University (Project No. 1207S137).
Contributor Information
Filiz Özdemir, Phone: +90 222 3350580, Email: fozdemir3@anadolu.edu.tr.
Elif Apaydın, Phone: +90 222 3350580, Email: elifapaydin0607@gmail.com.
Nur İpek Önder, Phone: +90 222 3350580, Email: nuripekonder@gmail.com.
Mesut Şen, Phone: +90 222 3350580, Email: mesutsen88@gmail.com.
Aysun Ayrım, Phone: +90 222 3350580, Email: aayrim@anadolu.edu.tr.
Yüksel Öğünç, Phone: +90 222 3350580, Email: yuksel.ogunc@gmail.com.
Zerrin İncesu, Phone: +90 222 3350580, Email: zseller@anadolu.edu.tr.
References
- Billard C, Izard JC, Roman V, Kern C, Mathiot C, Mentz F, Kolb JP. Comparative antiproliferative and apoptotic effects of resveratrol, epsilon-viniferin and vine-shots derived polyphenols (vineatrols) on chronic B lymphocytic leukemia cells and normal human lymphocytes. Leuk Lymphoma. 2002;43:1991–2002. doi: 10.1080/1042819021000015952. [DOI] [PubMed] [Google Scholar]
- Bobermin LD, Souza DO, Gonçalves CA, Santos AQ. Resveratrol prevents ammonia-induced mitochondrial dysfunction and cellular redox imbalance in C6 astroglial cells. Nutr Neurosci. 2017;6:1–10. doi: 10.1080/1028415X.2017.1284375. [DOI] [PubMed] [Google Scholar]
- Byun HS, Song JK, Kim YR, Piao L, Won M, Park KA, Choi BL, Lee H, Hong JH, Park J, et al. Caspase-8 has an essential role in resveratrol-induced apoptosis of rheumatoid fibroblast-like synoviocytes. Rheumatology. 2008;47:301–308. doi: 10.1093/rheumatology/kem368. [DOI] [PubMed] [Google Scholar]
- Cao MR, Li Q, Liu ZL, Liu HH, Wang W, Liao XL, Pan YL, Jiang JW. Harmine induces apoptosis in HepG2 cells via mitochondrial signaling pathway. Hepatobiliary Pancreat Dis Int. 2011;10:599–604. doi: 10.1016/S1499-3872(11)60102-1. [DOI] [PubMed] [Google Scholar]
- Chen Y, Huang H, Yao C, Su F, Guan W, Yan S, Ni Z. Antitumor activity of combined endostatin and thymidine kinase gene therapy in C6 glioma models. Cancer Med. 2016;5:2477–2486. doi: 10.1002/cam4.798. [DOI] [PMC free article] [PubMed] [Google Scholar]
- Colin D, Lancon A, Delmas D, Delmas D, Lizard G, Abrossinow J, Kahn E, Jannin B, Latruffe N. Antiproliferative activities of resveratrol and related compounds in human hepatocyte derived HepG2 cells are associated with biochemical cell disturbance revealed by fluorescence analyses. Biochimie. 2008;90:1674–1684. doi: 10.1016/j.biochi.2008.06.006. [DOI] [PubMed] [Google Scholar]
- Darzynkiewicz Z, Bedner E, Smolewski P. Flow cytometry in analysis of cell cycle and apoptosis. Semin Hematol. 2001;38:179. doi: 10.1016/S0037-1963(01)90051-4. [DOI] [PubMed] [Google Scholar]
- Das A, Banik NL, Ray SK. Flavonoids activated caspases for apoptosis in human glioblastoma T98G and U87MG cells but not in human normal astrocytes. Cancer. 2010;1:164–176. doi: 10.1002/cncr.24699. [DOI] [PMC free article] [PubMed] [Google Scholar]
- Ferry-Dumazet H, Garnier O, Mamani-Matsuda M, Vercauteren J, Belloc F, Billiard C, Dupouy M, Thiolat D, Kolb JP, Marit G, Reiffers J, Mossalayi MD. Resveratrol inhibits the growth and induces the apoptosis of both normal and leukemic hematopoietic cells. Carcinogenesis. 2002;23:1327–1333. doi: 10.1093/carcin/23.8.1327. [DOI] [PubMed] [Google Scholar]
- Geng J, Li J, Huang T, Zhao K, Chen Q, Guo W, Gao J. A novel manganese complex selectively induces malignant glioma cell death by targeting mitochondria. Mol Med Rep. 2016;14:1970–1978. doi: 10.3892/mmr.2016.5509. [DOI] [PMC free article] [PubMed] [Google Scholar]
- Hu S, Li X, Xu R, Ye L, Kong H, Zeng X, Wang H, Xie W. The synergistic effect of resveratrol in combination with cisplatin on apoptosis via modulating autophagy in A549 cells. Acta Biochim Bıophys Sin. 2016;48:528–535. doi: 10.1093/abbs/gmw026. [DOI] [PMC free article] [PubMed] [Google Scholar]
- Ignarro RS, Facchini G, Melo DR, Juliane PRK, Ferreira CV, Castilho RF, Rogerio F. Characteristics of sulfasalazine-induced cytotoxicity in C6 rat glioma cells. Neurosci Lett. 2017;638:189–195. doi: 10.1016/j.neulet.2016.12.035. [DOI] [PubMed] [Google Scholar]
- Jakubowicz-Gil J, Langner E, Bądziul D, Wertel I, Rzeski W. Apoptosis induction in human glioblastoma multiforme T98G cells upon temozolomide and quercetin treatment. Tumour Biol. 2013;34:2367–2378. doi: 10.1007/s13277-013-0785-0. [DOI] [PMC free article] [PubMed] [Google Scholar]
- Jiang CP, Ding H, Shi DH, Wang YR, Li EG, Wu JH. Pro-apoptotic effects of tectorigenin on human hepatocellular carcinoma HepG2 cells. World J Gastroenterol. 2012;18:1753–1764. doi: 10.3748/wjg.v18.i15.1753. [DOI] [PMC free article] [PubMed] [Google Scholar]
- Johnson JE. Fine structure of IMR-90 cells in culture as examined by scanning and transmission electron microscopy. Mech Age Dev. 1979;10:405–443. doi: 10.1016/0047-6374(79)90022-8. [DOI] [PubMed] [Google Scholar]
- Lee YJ, Lee YJ, Im JH, Im JH, Won SY, Kim YB, Cho MK, Nam HS, Choi YJ, Lee SH. Synergistic anti-cancer effects of resveratrol and chemotherapeutic agent clofarabine against human malignant mesothelioma MSTO-211H cells. Food Chem Toxicol. 2013;52:61–68. doi: 10.1016/j.fct.2012.10.060. [DOI] [PubMed] [Google Scholar]
- Lee YJ, Lee GJ, Yi SS, Heo SH, Park CR, Nam HS, Cho MK, Lee SH. Cisplatin and resveratrol induce apoptosis and autophagy following oxidative stress in malignant mesothelioma cells. Food Chem Toxicol. 2016;97:96–107. doi: 10.1016/j.fct.2016.08.033. [DOI] [PubMed] [Google Scholar]
- Ma J, Yang YR, Chen W, Chen M-H, Wang H, Wang XD, Sun LL, Wang FZ, Wang DC. Fluoxetine synergizes with temozolomide to induce the CHOP-dependent endoplasmic reticulum stress-related apoptosis pathway in glioma cells. Oncol Rep. 2016;36:676–684. doi: 10.3892/or.2016.4860. [DOI] [PMC free article] [PubMed] [Google Scholar]
- Mukherjee A, Williams DW. More alive than dead: non-apoptotic roles for caspases in neuronal development, plasticity and disease. Cell Death Differ. 2017;24:1411–1421. doi: 10.1038/cdd.2017.64. [DOI] [PMC free article] [PubMed] [Google Scholar]
- Murias M, Luczak MW, Niepsuj A, Krajka-Kuzniak V, Zielinska-Przyjemska M, Jagodzinski PP, Jäger W, Szekeres T, Jodynis-Liebert J. Cytotoxic activity of 3,3′,4,4′,5,5′-hexahydroxystilbene against breast cancer cells is mediated by induction of p53 and downregulation of mitochondrial superoxide dismutase. Toxicol In Vitro. 2008;22:1361–1370. doi: 10.1016/j.tiv.2008.03.002. [DOI] [PubMed] [Google Scholar]
- Murota Y, Tabu K, Taga T. Requirement of ABC transporter inhibition and Hoechst 33342 dye deprivation for the assessment of side population-defined C6 glioma stem cell metabolism using fluorescent probes. BMC Cancer. 2016;16:847. doi: 10.1186/s12885-016-2895-8. [DOI] [PMC free article] [PubMed] [Google Scholar]
- Ozdemir F, Akalın G, Sen M, Onder NI, Işcan A, Kutlu HM, Incesu Z. Towards novel anti-tumor strategies for hepatic cancer: ɛ-viniferin in combination with vincristine displays pharmacodynamic synergy at lower doses in HepG2 cells. OMICS. 2014;18:324–334. doi: 10.1089/omi.2013.0045. [DOI] [PMC free article] [PubMed] [Google Scholar]
- Ozdemir F, İncesu Z, Şen M, Onder Nİ, Dikmen M. Implications of enhanced effectiveness of vincristine sulfate/ε-viniferin combination compared to vincristine sulfate only on HepG2 cells. Dicle Med J. 2016;43:534–541. doi: 10.5798/diclemedj.0921.2016.01.0664. [DOI] [Google Scholar]
- Park JW, Choi YJ, Suh SI, Baek WK, Suh MH, Jin IN, Min DS, Woo JH, Chang JS, Passaniti A, Lee YH, Kwon TK. Bcl-2 overexpression attenuates resveratrol-induced apoptosis in U937 cells by inhibition of caspase-3 activity. Carcinogenesis. 2001;22:1633–1639. doi: 10.1093/carcin/22.10.1633. [DOI] [PubMed] [Google Scholar]
- Rahim S, Üren A. A real-time electrical impedance based technique to measure invasion of endothelial cell monolayer by cancer cells. J Vis Exp. 2011;50:2792. doi: 10.3791/2792. [DOI] [PMC free article] [PubMed] [Google Scholar]
- Rai G, Mishra S, Suman S, Shukla Y. Resveratrol improves the anticancer effects of doxorubicin in vitro and in vivo models: a mechanistic insight. Phytomedicine. 2016;23:233–242. doi: 10.1016/j.phymed.2015.12.020. [DOI] [PubMed] [Google Scholar]
- Roman V, Billard C, Kern C, Ferry-Dumazet H, Izard JC, Mohammad R, Mossalayi DM, Kolb JP. Analysis of resveratrol-induced apoptosis in human B-cell chronic leukaemia. Br J Haematol. 2002;117:842–851. doi: 10.1046/j.1365-2141.2002.03520.x. [DOI] [PubMed] [Google Scholar]
- Rüweler M, Gülden M, Maser MM, Seibert H. Cytotoxic, cytoprotective and antioxidant activities of resveratrol and analogues in C6 astroglioma cells in vitro. Chem Biol Interact. 2009;182:128–135. doi: 10.1016/j.cbi.2009.09.003. [DOI] [PubMed] [Google Scholar]
- Su XY, Yin HT, Li SY, Huang XE, Tan HY, Dai HY, Shi FF. Intervention effects of nedaplatin and cisplatin on proliferation and apoptosis of human tumour cells in vitro. Asian Pac J Cancer Prev. 2012;13:4531–4536. doi: 10.7314/APJCP.2012.13.9.4531. [DOI] [PubMed] [Google Scholar]
- Sun Z, Shi S, Li H, Shu XH, Chen XY, Kong QY, Liu J. Evaluation of resveratrol sensitivities and metabolic patterns in human and rat glioblastoma cells. Cancer Chemother Pharmacol. 2013;72:965–973. doi: 10.1007/s00280-013-2274-y. [DOI] [PubMed] [Google Scholar]
- Sun C, Yu Y, Wang L, Wu B, Xia L, Feng F, Ling Z, Wang S. Additive antiangiogenesis effect of ginsenoside Rg3 with low-dose metronomic temozolomide on rat glioma cells both in vivo and in vitro. J Exp Clin Cancer Res. 2016;35:32. doi: 10.1186/s13046-015-0274-y. [DOI] [PMC free article] [PubMed] [Google Scholar]
- Surh YJ, Hurh YJ, Kang JY, Lee E, Kong G, Lee SJ. Resveratrol, an antioxidant present in red wine, induces apoptosis in human promyelocytic leukemia (HL-60) cells. Cancer Lett. 1999;140:1–10. doi: 10.1016/S0304-3835(99)00039-7. [DOI] [PubMed] [Google Scholar]
- Tianqin G, Chunlei C, Jingjing W. Synergistic anti-glioma effects in vitro and in vivo of enediyne antibiotic neocarzinostatin and paclitaxel via enhanced growth delay and apoptosis-induction. Biol Pharm Bull. 2016;39:1623–1630. doi: 10.1248/bpb.b16-00285. [DOI] [PubMed] [Google Scholar]
- Wang G, Wang JJ, Yang GY, Du SM, Zeng N, Li DS, Li RM, Chen JY, Feng JB, Yuan SH, Ye F. Effects of quercetin nanoliposomes on C6 glioma cells through induction of type III programmed cell death. Int J Nanomed. 2012;7:271–280. doi: 10.2217/nnm.11.186. [DOI] [PMC free article] [PubMed] [Google Scholar] [Retracted]
- Wang Y, Xu YS, Yin LH, Xu LN, Peng JY, Zhou H, Kang W. Synergistic anti-glioma effect of Hydroxygenkwanin and Apigenin in vitro. Chem Biol Interact. 2013;206:346–355. doi: 10.1016/j.cbi.2013.10.009. [DOI] [PubMed] [Google Scholar]
- Wang X, Feng Y, Wang N, Cheung F, Tan HY, Zhong S, Li C, Kobayashi S. Chinese medicines induce cell death: the molecular and cellular mechanisms for cancer therapy. Biomed Res Int. 2014;2014:530342. doi: 10.1155/2014/530342. [DOI] [PMC free article] [PubMed] [Google Scholar]
- Xue YQ, Di JM, Luo Y, Cheng KJ, Wei X, Shi Z. Resveratrol oligomers fort he prevention and treatment of cancers. Oxid Med Cell Longev. 2014;2014:765832. doi: 10.1155/2014/765832. [DOI] [PMC free article] [PubMed] [Google Scholar]
- Yamaguchi Y, Miura M. Programmed cell death and caspase functions during neural development. Curr Top Dev Biol. 2015;114:159–184. doi: 10.1016/bs.ctdb.2015.07.016. [DOI] [PubMed] [Google Scholar]
- Yang C, Lei D, Ouyang W, Ren J, Li H, Hu J, Huang S. Conditioned media from human adipose tissue-derived mesenchymal stem cells and umbilical cord-derived mesenchymal stem cells efficiently induced the apoptosis and differentiation in human glioma cell lines in vitro. Biomed Res Int. 2014;2014:109389. doi: 10.1155/2014/109389. [DOI] [PMC free article] [PubMed] [Google Scholar]
- Zghonda N, Yoshida S, Araki M, Kusunoki M, Mliki A, Ghorbel A, Miyaza H. Greater effectiveness of ε-viniferin in red wine than its monomer resveratrol for inhibiting vascular smooth muscle cell proliferation and migration. Biosci Biotechnol Biochem. 2011;75:1259–1267. doi: 10.1271/bbb.110022. [DOI] [PubMed] [Google Scholar]