

Abstract
Despite recent progress in diagnosis and treatment, survival for children with high-risk metastatic neuroblastoma is still poor. Prostaglandin E2 (PGE2)-driven inflammation promotes tumor growth, immune suppression, angiogenesis and resistance to established cancer therapies. In neuroblastoma, cancer-associated fibroblasts (CAFs) residing in the tumor microenvironment are the primary source of PGE2. However, clinical targeting of PGE2 with current non-steroidal anti-inflammatory drugs or cyclooxygenase inhibitors has been limited due to risk of adverse side effects. By specifically targeting microsomal prostaglandin E synthase-1 (mPGES-1) activity with a small molecule inhibitor we could block CAF-derived PGE2 production leading to reduced tumor growth, impaired angiogenesis, inhibited CAF migration and infiltration, reduced tumor cell proliferation and a favorable shift in the M1/M2 macrophage ratio. In this study, we provide proof-of-principle of the benefits of targeting mPGES-1 in neuroblastoma, applicable to a wide variety of tumors. This non-toxic single drug treatment targeting infiltrating stromal cells opens up for combination treatment options with established cancer therapies.
Keywords: Tumor microenvironment, Cancer-associated fibroblasts, mPGES-1, PGE2
Graphical Abstract

Highlights
-
•
Prostaglandin E2 nourishes neuroblastoma tumor growth via cancer-associated fibroblasts.
-
•
mPGES-1 inhibitor limits tumor growth, angiogenesis, infiltration of cancer-associated fibroblasts and immune suppression.
-
•
mPGES-1 constitutes a drug target for neuroblastoma treatment.
Cancer is the leading cause of death in children in high-income countries and the survival rate has almost been unchanged during the last decade. Further treatment intensification to improve survival rate may further increase the risk of side-effects. Therapies targeting the microenvironment have been suggested to improve survival and quality of life for these children. High-risk neuroblastomas present an immunosuppressive microenvironment and infiltrating cancer-associated fibroblasts are responsible for oncogenic prostaglandin E2 production. Here we show that selective inhibition of prostaglandin E2 biosynthesis and its role in the crosstalk between cells of the microenvironment provides a promising therapeutic strategy in neuroblastoma.
1. Introduction
Cancer-related inflammation is a complex tumor-promoting interaction between cancer cells and stromal cells of the microenvironment. These interactions contribute to tumor progression by inducing angiogenesis, providing the tumor with growth factors, and by impairing anti-tumor immunity by immunosuppressive mechanisms [[1], [2], [3]]. Neuroblastomas are neural crest derived embryonic tumors of the sympathetic nervous system that are amongst the most common and deadliest tumors in young children. Children with high-risk neuroblastoma still have a poor prognosis and despite intensified multi-modal therapy only 40% -50% of these children survive their disease [4,5]. High-risk neuroblastomas include tumors harboring an amplification of the neuroblastoma MYC (MYCN) oncogene often present in younger children, and another subset of tumors with a deletion of the long arm of chromosome 11 (11q-deletion) usually presenting in children older at diagnosis [6]. An immunosuppressive microenvironment has been described in neuroblastoma and recent studies have shown that the high-risk tumors possess a microenvironment with pro-inflammatory features [5,[7], [8], [9], [10]].
Prostaglandin E2 (PGE2) is a bioactive lipid mediator. Dysregulation of PGE2 biosynthesis has been found in a variety of malignancies. Through its pro-inflammatory actions PGE2 contributes to a tumor-promoting microenvironment by inducing growth factors and angiogenic factors that stimulate tumor growth. At the same time PGE2 contributes to an immunosuppressive milieu leading to inhibition of anti-tumor immunity [[11], [12], [13]]. In addition, PGE2 contributes to resistance to radiation and chemotherapy where PGE2 released from dying cells sustains tumor repopulation [14,15]. PGE2 is formed by the conversion of arachidonic acid by the cyclooxygenases (COX-1 and COX-2) into prostaglandin H2 that is further converted to PGE2 by the terminal synthase, microsomal prostaglandin E synthase-1 (mPGES-1). The biological effect of PGE2 is conducted via four G-protein coupled receptors EP1-EP4. Clinical use of COX inhibitors in oncology, i.e. non-steroidal anti-inflammatory drugs (NSAIDs) and COX-2 inhibitors (Coxibs), which reduce the production of PGE2 and other prostanoids important for normal cellular functions, has been hampered by severe side effects on the gastrointestinal and cardiovascular systems. This has led to the development of mPGES-1 inhibitors that selectively target PGE2 production as a strategy to achieve the anti-tumorigenic properties of PGE2-blockade [[16], [17], [18], [19], [20], [21]]. Due to phenotypic differences between murine and human mPGES-1, inhibitors developed towards the human enzyme are ineffective towards the murine enzyme hindering pre-clinical studies in mouse models [22]. However, recently dual murine and human mPGES-1 inhibitors have been characterized in mouse models of inflammation [23,24].
We have reported that high-risk neuroblastomas present an immunosuppressive microenvironment and that infiltrating cancer-associated fibroblasts (CAFs) are responsible for the mPGES-1 expression in these tumors [25]. Drugs that specifically target non-neoplastic cells within the microenvironment have been suggested as a treatment option to further improve survival and quality of life [5,9,26]. In the present study, we investigated the significance of PGE2 producing CAFs and the specific effects of pharmacological mPGES-1 inhibition in the neuroblastoma microenvironment.
2. Materials and Methods
2.1. Patient Material
Neuroblastoma tumor tissues were obtained at Astrid Lindgren Children's Hospital, Karolinska University Hospital, Sweden, and were immediately (<60 min) fresh frozen at surgery after a minimal of two weeks after any treatment. Relevant informed consent was obtained according to the ethical approval from the Karolinska University Hospital Research Ethics Committee (approval no 2009/1369–31/1 and 03/736).
2.2. Chemicals
The mPGES-1 inhibitor Compound III (CIII) [23] was synthesized by NovaSAID AB. CIII was resuspended (1% Tween80, 0.5% carboxymethyl cellulose, 0.9% NaCl) at a final concentration of 4 mg/ml before use.
2.3. Cell Lines
The human neuroblastoma cell lines SK-N-AS (ATCC Cat# CRL-2137, RRID:CVCL_1700) were cultured as previously described [27] and authenticated using short tandem repeat analysis. The normal human dermal fibroblast cell line (NHDF, Cat# C-12300, PromoCell) was grown in RPMI supplemented with 10% FBS, L-glutamate and antibiotics. All cell lines were tested for Mycoplasma using PCR analysis.
2.4. Immunohistochemical Analysis of Neuroblastoma Tumor Tissue
Frozen tumors were sectioned in 7 μm thin sections using a cryostat and fixed in 2% formaldehyde for 20 min. Dilutions and washes were performed using PBS containing 0.1% saponin, pH 7.4. Endogenous peroxidase activity was blocked using 1% H2O2 and biotin was blocked using an avidin/biotin blocking kit (Vector Laboratories). Tumor sections were incubated with primary antibody dilutions, containing 3% normal serum (human or mouse depending on tissue origin), overnight in room temperature (RT). Primary antibody concentrations are listed in supplementary Table S1. Following incubation with 1% goat serum (or horse serum depending on secondary antibody) for 15 min, sections were incubated with biotin-conjugated secondary antibody, containing 1% goat or horse serum and 3% normal serum, for 30 min in RT (goat α-rabbit IgG, 1:1600, Vector Laboratories Cat# BA-1000, RRID:AB_2313606; horse α-goat IgG, 1:300, Vector Laboratories Cat# BA-9500, RRID:AB_2336123; goat α-rat IgG, 1:200, Vector Laboratories Cat# BA-9400, RRID:AB_2336202). After incubation with ABC complex (Elite ABC kit, Vector Laboratories) the sections were developed for 6 min using Diaminobenzidine (DAB Peroxidase Substrate Kit, Vector Laboratories) as chromogen. Sections were counterstained with Mayer's Hematoxylin (Histolab). At least three tumors from each treatment group were quantified for CD206, CD31, Ki-67 and PDGFRβ expression using Leica Qwin IM500 software as described previously (39). For immunofluorescent staining, sections were washed for 10 min and blocked in 20% normal serum for 45 min in RT. Sections were then incubated with primary antibody mixture over night in RT. Slides were washed and incubated with secondary antibodies conjugated with fluorescent dye in RT for 30 min (goat α-rabbit IgG (H+L), Alexa Fluor 488, 1:1000, Thermo Fisher Scientific Cat# A-11070, RRID:AB_2534114; goat α-mouse IgG (H+L), Alexa Fluor 594, 1:1000, Thermo Fisher Scientific Cat# A-11020, RRID:AB_2534087). Following additional washes, the sections were counterstained with Hoechst diluted 1:1000 for 30 s and washed in PBS. Sections were finally mounted in glycerol with PBS. Dilutions and washes were performed using PBS containing 0.1% saponin, pH 7.4.
2.5. Analysis of Prostanoids and CIII by Liquid Chromatography Tandem Mass Spectrometry
Prostanoids and CIII in plasma and tumors were extracted and analyzed to a large extent according to [28]. Working on ice, plasma (100 μl) and tumor tissue (200–400 mg) were spiked with 100 μl deuterated internal standards of 6-keto-PGF1α-d4, PGF2α-d4, PGE2-d4, PGD2-d4, TxB2-d4, and 15-deoxy-Δ12,14PGJ2-d4 (Cayman Chemical) in ethanol and made acidic with 500 μl 1% formic acid (FA) in methanol. The tumors were homogenized by mechanical force with a pellet pestle (Kontes) and liquid extraction was performed by addition of 400 μl 1% FA in methanol followed by centrifugation at 2500 g for 5 min (4 °C) and collection of supernatants. The liquid extraction was repeated once. The extracted supernatants were evaporated to dryness under vacuum and then reconstituted in 1 ml 0.05% FA, 10% methanol in MilliQ water. Solid-phase extraction (SPE) was performed by loading samples on Oasis HLB 1cm3 30 mg cartridges (Waters) that had been preconditioned with 100% methanol and 0.05% FA in MilliQ. The SPE columns were washed once with 10% methanol in MilliQ followed by elution in 1 ml 100% methanol. The samples were evaporated to dryness under vacuum and stored at −20 °C until reconstituted in 30 μl 20% acetonitrile prior to analysis with liquid chromatography tandem mass spectrometry (LC-MS/MS). The injection volume was 10 μl and analytes of interest were quantified using a triple quadrupole mass spectrometer (Acquity TQ detector, Waters) equipped with an Acquity H-class UPLC (Waters). Separation was performed on a 50 × 2.1 mm Acquity UPLC BEH C18 column 1.7 μm (Waters) with a 12 min stepwise linear gradient (20–95%) at a flowrate of 0.6 ml/min with 0.05% FA in acetonitrile as mobile phase B and 0.05% FA in MilliQ as mobile phase A. Individual prostanoids were measured in negative mode [28] and CIII (m/z 384 > 341, Fig. S2) in positive mode with multiple reaction monitoring method. Data were analyzed using MassLynx software, version 4.1, with internal standard calibration and quantification to external standard curves.
2.6. Inhibition of mPGES-1 in Xenograft Tumor Bearing Mice
4–8 weeks old female NMRI nu/nu mice obtained from Taconic Laboratories, were maintained under pathogen free conditions and given sterile water and food ad libitum. The xenograft mice experiments were approved by the regional ethics committee for animal research (approval N231/14) in accordance with the Animal Protection Law (SJVFS 2012:26).
Each mouse was inoculated with 107 or 106 SK-N-AS cells in the right flank. When tumors from mice inoculated with 107 cells reached a volume of 150 mm3 the animals were randomized by lottery assignment, either receiving 50 mg/kg CIII (n = 6), 100 mg/kg CIII (n = 6), Vehicle (0.5% Carboxymethyl cellulose, n = 5) or no treatment (n = 5). The drugs were administered intraperitoneal (i.p.) and the animals were treated for eight consecutive days. 30 mice were inoculated with 106 cells, 10 animals were randomized to receive 50 mg/kg from the day of injection, referred to as early treatment of CIII (CIII-ET). The remaining 20 mice were randomized by lottery assignment when tumors reached a volume of 200 mm3 to either receive 50 mg/kg CIII (n = 10) or no treatment (n = 10). CIII was administered i.p. daily. All the animals were sacrificed nine days after they reached a volume of 200 mm3 (tumor take). Tumors were measured every day and the volume was calculated as (width)2 × length×0.44. At sacrifice, tumor tissue was snap frozen for ex vivo studies.
All mice experiments were conducted according to the Animal Protection Regulation (SFS 1988:539) and the Regulation for the Swedish National Board for Laboratory Animals (SFS 1988:541).
2.7. Inhibition of mPGES-1 in MYCN-Driven Transgenic Mice
The tgTH-MYCN+/+ mice were obtained from the Mouse Model of Human Cancer Consortium Repository as an N16 backcross to the 129X1/ SvJ background and have been kept as a continuous inbreeding. All transgenic animal experiments were approved by the regional ethics committee for animal research (ethical permit N26/11 and N42/14) in accordance with the Animal Protection Law (SFS1988:534).
Homozygous mice were randomized by lottery at 4.5 weeks of age to receive either no treatment (control, n = 17) or daily CIII treatment (50 mg/kg, n = 15), by i.p. injections for 10 consecutive days, and sacrificed at the age of 6 weeks. At 4 weeks of age homozygous mice were randomized to receive no treatment (control, n = 20) or diclofenac (10 mg/l, n = 12) in the drinking water for 14 days. Animals were sacrificed at the age of 6 weeks.
2.8. Western Blot
To extract proteins, 20–60 cryostat sections (40 μm thick) were incubated on ice for 30 min with 70–200 μl T-PER (Thermo Fisher Scientific) and protease inhibitor (Roche Complete Mini EDTA-free, 1 tablet to 10 ml buffer) followed by sonication and centrifugation. 80 μg of extracted proteins were separated using SDS-PAGE and transferred to PVDF membranes. Membranes were incubated over night at 4 °C with primary anti-mPGES-1 antibody (1:250, rabbit, Cayman Chemical Cat# 160140, RRID:AB_10079429) and anti-COX-1 antibody (rabbit, 1:250, Cayman Chemical Cat# 160109, RRID:AB_10077936). After incubation with secondary anti-rabbit antibody (GE Healthcare Cat# NA934, RRID:AB_772206) membranes were developed with ECL substrate (GE Healthcare). GAPDH was used as loading control (mouse, 1:5000, Thermo Fisher Scientific Cat# 39–8600, RRID:AB_2533438). X-ray films were developed, scanned and quantified using Quantity One software (Bio-Rad) and levels of mPGES-1 and COX-1 were normalized to GAPDH content.
2.9. Flow Cytometric Analysis
Freshly collected tumor and spleen tissue were mechanically dissociated through a 70 μm cell strainer. Red blood cells were lysed using Lysing buffer (BD Pharm Lyse, BD Pharmingen). Flow cytometry stainings were performed in 96-well V bottom plates. Up to 1 × 10⁶ cells were placed in 96-well plates, washed two times with PBS and stained for 20 min at room temperature with pre-mixed surface marker antibodies and life dead markers, near infra-red or Live/Dead fixable blue (Invitrogen) in 50 μl PBS. After washing in PBS, cells were resuspended in FACS buffer (PBS + 10% heat-inactivated FCS) and stored at 4 °C before measurements. After a final wash, cells were acquired at the BD LSRII cytometer (BD Bioscience) and analyzed by FlowJo software (Tristar Inc.). All antibodies used were diluted 1:200 and are listed in supplementary Table S2.
2.10. Migratory Effect on Fibroblasts by mPGES-1 Inhibition in vitro
Boyden Chamber Cell Migration Assay, was used to analyze the effect of mPGES-1 inhibition on fibroblast (NHDF) migration when co-cultured with neuroblastoma cells (SK-N-AS). 24-transwell plates with 8 μm pore size and polycarbonate membranes were purchased from Corning. NHDF cells (2 × 10⁴) were seeded in the upper chamber and SK-N-AS cells (3 × 10⁴) were seeded in the lower chamber in RPMI medium. Before transferring the NHDF containing transwell inserts to the SK-N-AS wells the NHDF were stimulated with IL-1β (5 ng/ml, R&D systems) for 24 h. The co-cultures were then treated with either CIII (10 μM), vehicle (DMSO) control or EP-4 antagonist (L-161,982; Cayman Chemicals). Untreated transwell cultures with NHDF and SK-N-AS cells were used as positive control. As a negative control we monitored NHDF migration without the presence of SK-N-AS cells. Cells were allowed to migrate for 24 h. Cells were fixed in 4% phosphate-buffered formaldehyde (PFA) and non-migrating cells in the upper chamber were removed with a cotton swab, whereas migrated cells adhering to the lower surface of the membrane were stained with Mayer's Hematoxylin and quantified using Leica Qwin IM500 software as described previously [29].
2.11. Statistics
All statistics and graphs were prepared using GraphPad prism, version 5 (GraphPad software Inc.). All comparisons between two groups were performed using unpaired two-tailed t-tests. Survival was calculated using Kaplan-Meier analysis and significance was calculated using Log-rank test (Mantel-Cox). From previous experience with the mouse models used in this study sample size was estimated to obtain biological and clinical significant differences.
3. Results
3.1. COX/mPGES-1/PGE2 Pathway in Preclinical Mouse Models Resembles High-Risk Primary Neuroblastoma
To mimic human high-risk neuroblastoma in two preclinical in vivo models, we established xenografts in NMRI mice using SK-N-AS cells derived from a high-risk neuroblastoma with confirmed 11q-deletion, and also used the TH-MYCN transgenic mouse model developing aggressive MYCN-driven neuroblastoma closely resembling high-risk neuroblastoma [25,[30], [31], [32]]. Since we previously revealed a highly activated mPGES-1/PGE2 pathway in high-risk neuroblastoma [25] we investigated the expression of PGE2 receptors, EP1-EP4, in the microenvironment of two subtypes of high-risk neuroblastoma, namely 11-q deleted and MYCN-amplified human tumors, using immunohistochemistry. The PGE2 receptors showed the same abundant expression in both human high-risk neuroblastoma and the corresponding mouse models. EP3 was primarily expressed by tumor cell, while EP4 was predominantly expressed in the stromal cells of the tumors (Fig. 1).
Fig. 1.

Expression of PGE2 receptors in human and murine tumors. (a) Immunohistochemical staining of EP1-EP4 (DAB, brown staining) in primary human high-risk neuroblastoma tumors: MYCN-amplified and 11q-deleted (11q-), respectively. (b) Immunohistochemical analysis of EP1-EP4 in tumors from two different mouse models of neuroblastoma: a transgenic MYCN-driven model (tgTH-MYCN) and a xenograft model inoculated with the 11q-deleted human neuroblastoma cell line SK-N-AS (SK-N-AS xenograft). Sections were counterstained with Mayer's hematoxylin. Scale bars indicate 50 μm. (c) Dual labeling of PGE2 receptors, EP3 and EP4 (green), with neuroblastoma marker GD2 and CAF marker PDGFRβ (red) respectively in primary human neuroblastoma tumors. Sections were counterstained with nuclear dye Hoechst (blue).
Similar to human neuroblastoma tumors, mPGES-1 expression was detected exclusively in stromal cells [25]. COX-1 was expressed mostly in stromal cells and only a few cells were positive for COX-2 (Fig. 2). The abundant expression of mPGES-1 in stromal cells coincided with the expression of the CAF marker, platelet-derived growth factor receptor β (PDGFRβ) (Fig. 2). Investigation of tumors also revealed a nuclear expression of active signal transducer and activator of transcription 3 (STAT3), one of the major mediators of tumor-promoting inflammation and suppression of anti-tumor immunity [33], in the mPGES-1 expressing cells (Figs. 2 and S1).
Fig. 2.
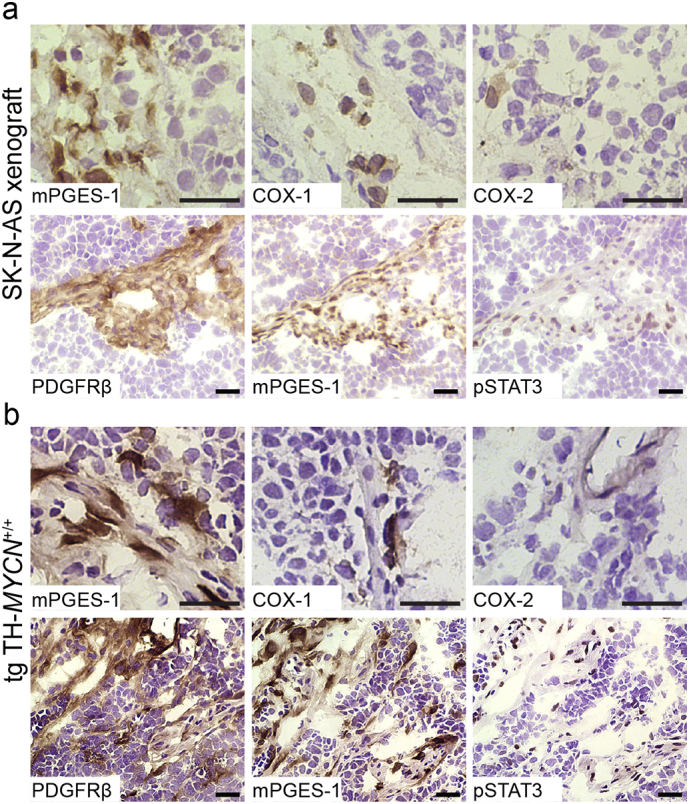
Expression of COX/mPGES-1/PGE2 pathway enzymes in mouse models of high-risk neuroblastoma. Representative images from immunohistochemical staining of enzymes responsible for PGE2 biosynthesis, mPGES-1, COX-1 and COX-2, CAF marker PDGFRβ and phosphorylated STAT3 (DAB, brown staining) in (a) xenograft tumors generated from an 11q-deleted neuroblastoma cell line (SK-N-AS) and (b) MYCN-driven transgenic neuroblastoma model (tgTH-MYCN). Sections were counterstained with Mayer's hematoxylin (blue staining). Scale bars indicate 50 μm.
3.2. mPGES-1 Inhibition Reduces PGE2 Concentration in Tumors of Neuroblastoma Xenograft Model
Compound III (CIII) constitutes a benzoimidazole with a molar mass of 383 g/mol, previously characterized as a selective mPGES-1 inhibitor by us [23,34]. CIII inhibits recombinant human and rat mPGES-1 with an IC50 of 0.09 μM and 0.9 μM respectively, with <20% inhibition of COX-1, COX-2, prostacyclin synthase and hematopoietic prostaglandin D synthase at 50 μM [23]. In order to study the pharmacokinetics of this compound a targeted LC-MS/MS method was established and validated in plasma from mice (Fig. S2). We obtained close to full recovery of CIII from SPE when CIII was spiked in plasma before (96 ± 5%, mean ± SEM, n = 6) or after (100 ± 1%, n = 6) SPE. We observed a minor suppression in signal due to matrix effects (88 ± 1%, n = 6). Our method gave good linearity (R2 = 0.98) in both plasma and in solution for the dynamic range of 0.1–20 ng injected on column. The limit of quantification (signal-to-noise >10) in solution was 4 pg injected on column. This method enabled us to simultaneously measure CIII and prostanoids within the same sample injection. CIII was detected in both plasma and tumor tissue and revealed a rapid uptake with the highest concentration of CIII in plasma and tumor tissues at around 2 h post injection (Fig. 3a and b). The reduction of PGE2 concentration followed the same profile as the concentration of inhibitor with the highest effect on PGE2 inhibition 2 h after administration of CIII (Fig. 3c). We did not detect any other prostanoids in the tumors and protein levels of mPGES-1 and COX-1 in tumor tissue were not altered in CIII treated mice (Fig. S3).
Fig. 3.

Effect of pharmacological mPGES-1 inhibition on PGE2 concentration in xenografted tumors. LC-MS/MS analysis of CIII in plasma (a) and tumor tissue (b) 2, 4 and 6 h after a single i.p. injection of CIII into xenografted tumor-bearing mice (mean ± SEM, n = 5–6 for each time point). (c) LC-MS/MS analysis of PGE2 in tumor tissue of xenografted mice 2, 4 and 6 h after a single injection of CIII or vehicle. Data is represented as a Box and whiskers plot showing minimum to maximum range and each mouse as an individual data point (n = 5–6 for each group).
3.3. mPGES-1 Inhibition Reduces Tumor Growth in High-Risk Neuroblastoma Models
The therapeutic effect of the mPGES-1 inhibitor CIII was assessed in an 11q-deleted neuroblastoma xenograft model. Mice were treated with CIII (50 mg/kg) daily from the day of tumor cell injection (CIII-early treatment (ET)) or left untreated (CTRL) until appearance of palpable xenograft tumors (200 mm3) when the untreated control mice were randomized into receiving CIII (50 mg/kg) for 9 days or left untreated. All animals were sacrificed 10 days after reaching the threshold volume of 200 mm3 (Fig. 4a). The early initiated prophylactic treatment of the animals did not show a significant delay of early tumor development (Fig. S4), while the treatment significantly delayed establishment of large macroscopic tumors with a volume of ≥1000 mm3 (Fig. 4b). Treatment of mice with established tumors, starting at 200 mm3, reduced tumor volume already at day 4 compared to the control group and tumor weights at sacrifice were reduced in both treatment groups (CTRL: 0.91 ± 0.11 g, n = 10; CIII: 0.53 ± 0.10 g, n = 9; CIII-ET: 0.54 ± 0.10 g, n = 9 (mean ± SEM), Fig. 4c–e). Proliferation was measured in the xenograft tumors using immunohistochemical staining of Ki-67. Proliferation was significantly reduced in both early initiated treatment with CIII (CIII-ET) and CIII treatment of established tumors (CIII) compared to control tumors (CTRL) (Fig. 4f).
Fig. 4.

Inhibition of mPGES-1 and its impact on tumor growth in a preclinical neuroblastoma mouse model. (a) Schematic overview of an in vivo xenograft experiment: 1. Mice were injected with the human 11q-deleted cell line SK-N-AS (n = 30, 106 cells) and randomized into daily CIII-treatments from the day of injection (n = 10, CIII-ET) or left untreated (n = 20, CTRL). 2. At tumor take (200 mm3) the control animals were randomized to daily CIII-treatment (n = 10, CIII) or left untreated (n = 10, CTRL). 3. Animals in all three groups were followed until sacrifice 9 days post tumor take. (b) Kaplan-Meier analysis of tumor development comparing tumor free (<1.0 ml) survival probability from tumor cell injection, of CIII treated mice (CIII-ET) or untreated mice (CTRL), (P = 0.0094, Log-rank test (Mantel-Cox)). (c) Effect of daily CIII-treatment (9 consecutive days after tumor take, n = 9) on established tumors compared to untreated tumors (n = 10). Data is represented as mean tumor volume (calculated as (width)2 × length × 0.44) ± SEM, day 4–9 P < 0.05, unpaired t-test). (d) Weight of tumors and representative image (e) of mice at the day of sacrifice (9 days post tumor take) from mice receiving treatment from the day of injection (P = 0.022, CIII-ET), from mice receiving treatment from tumor take (P = 0.019, CIII) compared to untreated mice (CTRL), unpaired t-test. Data is represented as a Box and whiskers plot showing minimum to maximum range and each mouse as an individual data point. (f) Quantification of immunohistochemical Ki-67 staining in SK-N-AS xenograft tumors from at least four mice in each group. Data is presented as mean ± SEM and P-value calculated using unpaired t-test.
An increased dose of CIII revealed no differences in tumor weights and growth between mice administered with 50 mg/kg or 100 mg/kg compared to controls (Fig. S5a and b). The treated mice showed no sign of toxicity, and the treatment did not affect mouse weight (Fig. S5c). However, the animals treated with the 100 mg/kg dose displayed transient signs of discomfort, i.e. stretching. Control mice were treated with either vehicle or were left untreated but no difference in tumor weight was detected (vehicle: 1.06 ± 0.15 g, n = 5; untreated: 1.18 ± 0.26 g, n = 5 (mean ± SEM), Fig. S5d).
To investigate the effect of mPGES-1 inhibition on an intact neuroblastoma microenvironment we used the immunocompetent transgenic MYCN-driven neuroblastoma model (tgTH-MYCN) [32]. These animals spontaneously develop an extremely aggressive form of neuroblastoma [31]. Homozygous animals were randomized at 4.5 weeks of age, when only small tumor lesions are present [35], to receive CIII-treatment (50 mg/kg) daily until sacrifice at 6 weeks or left untreated as control animals (Fig. 5a). Inhibition of mPGES-1 significantly reduced tumor weight compared to untreated animals (untreated: 1.4 ± 0.1 g, n = 17, CIII: 0.7 ± 0.1 g, n = 15 (mean ± SEM), Fig. 5b and c). To compare the effect of the selective mPGES-1 inhibitor CIII with a non-selective COX-inhibitor, tgTH-MYCN mice were treated with diclofenac for 14 days (10 mg/l drinking water).
Fig. 5.
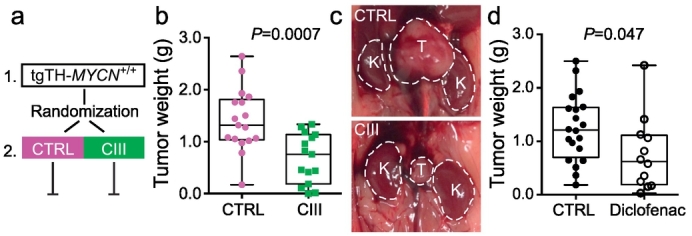
Inhibition of mPGES-1 and its impact on tumor growth in a transgenic neuroblastoma mouse model. (a) Schematic overview of an in vivo transgene experiment: 1. At the age of 4.5 weeks mice were randomized into treatment (n = 15, CIII) or left untreated (n = 17, CTRL). 2. Mice were treated daily (10 consecutive days) until the age of 6 weeks when they were sacrificed. (b) Weight of tumors and representative image (c) from untreated (CTRL) and CIII treated (CIII) tgTH-MYCN mice. Data is represented as a Box and whiskers plot showing minimum to maximum range and each mouse as an individual data point (P = 0.0007, unpaired t-test). T = tumor, K = kidney. (d) Weight of tumors from untreated (CTRL) and diclofenac treated (Diclofenac) tgTH-MYCN mice. Data is represented as a Box and whiskers plot showing minimum to maximum range and each mouse as an individual data point (P = 0.047, unpaired t-test).
The reduction in tumor weight was comparable with the results seen with CIII (untreated: 1.2 ± 0.1 g, n = 20, diclofenac: 0.75 ± 0.2, n = 12, Fig. 5d). Due to gastrointestinal side effects the diclofenac dose normally used (250 mg/l drinking water) in mice studies had to be substantially reduced [25,36].
3.4. mPGES-1 Inhibition Induces M1 Macrophage Polarization Supporting Host Immune Response
To evaluate the immunomodulatory effect on the microenvironment by PGE2 we assessed macrophage polarization markers, CD86 (classically activated, M1) and CD206 (alternatively activated, M2) in tumor and spleen from CIII treated immunocompetent tgTH-MYCN mice. Immunohistochemical staining revealed a decrease in CD206 positive tumor-promoting M2 macrophages in tumors from CIII treated mice (Fig. 6a and b). In addition, using flow-cytometry we analyzed CD86+ and CD206+ subpopulations of CD45 + F4/80+ macrophages in tumors and spleens of untreated and CIII treated mice. The calculated ratio of CD86+/CD206+ showed a significant shift towards M1 polarization in mice treated with CIII (Fig. 6c), while total macrophage frequencies remained unchanged (Fig. S6). No significant differences were found on T cell, NK cell or myeloid derived suppressor cell infiltration.
Fig. 6.

The effect of mPGES-1 inhibition on the tumor microenvironment. Representative images from immunohistochemical analysis of (a) M2 macrophage polarization marker CD206, (d) endothelial cell marker CD31 and (g) CAF marker PDGFRβ in tumors from untreated (CTRL) or CIII treated tgTH-MYCN mice (CIII). Sections were developed with DAB (brown staining) and counterstained with hematoxylin (blue staining). Scale bars indicate 50 μm. Quantification of (b) CD206 staining, (e) CD31 staining and (h) PDGFRβ in tumors from at least three mice in each group. Data is presented as mean ± SEM and P-value calculated using unpaired t-test. (c) Flow cytometry analysis of macrophage polarization markers in CD45 + F4/80+ population of cells in tumors and spleen from untreated and CIII treated tgTH-MYCN mice. Ratio of CD86+/CD206+ in spleen and tumors is presented as a Box and whiskers plot showing minimum to maximum range and each mouse as an individual data point (P = 0.019 and P = 0.004 respectively, unpaired t-test). For individual data points for CD86, CD206 and total macrophages see Fig. S6. Quantification of immunohistochemical staining of (f) CD31 and (i) PDGFRβ in tumors from untreated xenograft mice (n = 5, CTRL), xenograft mice treated with CIII from tumor take (n = 4, CIII) or xenograft mice treated with CIII from the day of tumor cell inoculation (n = 4–5, CIII-ET). Data are presented as mean ± SEM.
3.5. mPGES-1 Inhibition Reduces Angiogenesis in Tumors
The pharmacological impact of mPGES-1 inhibition on angiogenesis was assessed by immunohistochemical analysis of the endothelial marker CD31 in tumors from CIII treated and untreated tgTH-MYCN mice. Quantification of the CD31 staining revealed a significant reduction of angiogenesis in the CIII treated tumors compared to untreated controls (Fig. 6d and e). There were no significant differences in CD31 staining in tumors from CIII treated xenograft mice compared to controls, although there was a trend towards reduced angiogenesis in xenograft tumors receiving early initiated CIII treatment (Fig. 6f).
3.6. Infiltration and Migration of CAFs Are Suppressed by mPGES-1 Inhibition
Since mPGES-1 was expressed by CAFs in the experimental models (Fig. 2) similar to human neuroblastomas [25], we analyzed the effect of CIII on CAFs in the tumor microenvironment. Immunohistochemical analysis showed that CIII significantly reduced the presence of PDGFRβ positive CAFs in tgTH-MYCN mice tumors compared to controls (Fig. 6g and h). PDGFRβ staining was also reduced in xenograft tumors from mice receiving early initiated CIII treatment compared to controls but not in tumors where CIII was administered to mice carrying established tumors (Fig. 6i).
In the xenograft model the mPGES-1 positive CAFs expressed EP4 (Fig. 1c). They also expressed the interleukin (IL) receptor, IL-1RI (Fig. 7a) allowing mPGES-1 induction [37]. To investigate the influence of PGE2 on migration of CAFs we next studied the effect of mPGES-1 inhibition on tumor-induced fibroblast migration in vitro. Human dermal fibroblasts seeded in Boyden chambers were induced with IL-1β to produce PGE2 and transferred to SK-N-AS containing wells. Fibroblasts were allowed to migrate towards tumor cells for 24 h in the presence of CIII or vehicle control. In the presence of CIII there was significantly reduced migration of fibroblasts towards tumor cells compared to vehicle control (Fig. 7b). Reduced fibroblast migration was also seen using an EP4 antagonist. In the absence of tumor cells only few fibroblasts migrated.
Fig. 7.
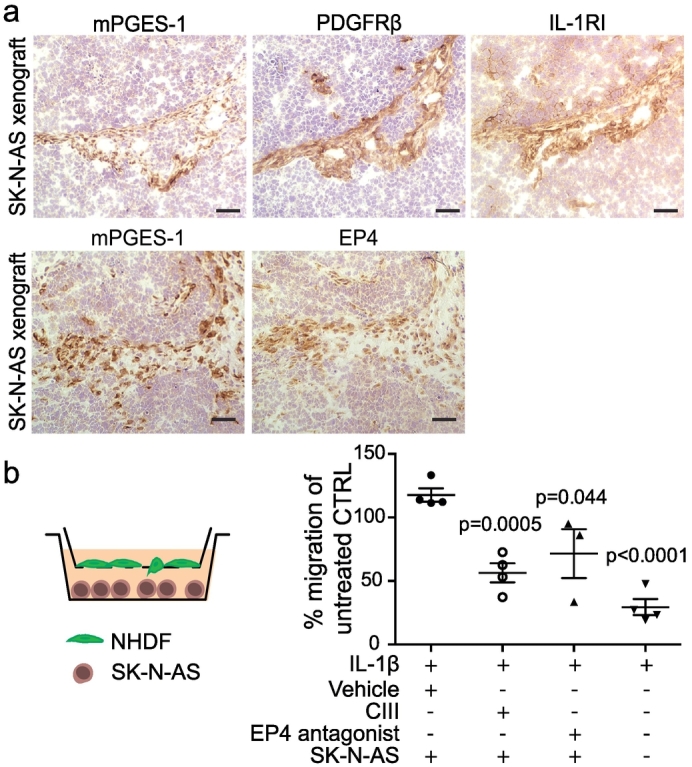
The effect of selective mPGES-1 inhibition on CAF migration. (a) Representative images of immunohistochemical staining of mPGES-1, PDGFRβ and the IL-1 receptor type I (IL-1RI) and mPGES-1 and EP4 in tumors from untreated xenografted mice 9 days post tumor take. Scale bars indicate 100 μm. (b) Schematic representation and quantification of fibroblast migration towards SK-N-AS cells in the presence of CIII, vehicle (DMSO) control or EP4 antagonist. PGE2 production was induced in fibroblasts by adding IL-1β prior to migration. Data is normalized to migration of untreated control represented as mean ± SEM. P-values are calculated using unpaired t-test. Each data point represents an individual experiment.
4. Discussion
We recently described the microenvironment of high-risk neuroblastoma with high infiltration of pro-tumorigenic M2 macrophages and cancer-associated fibroblasts (CAFs). CAFs were the main source of mPGES-1, the key enzyme for PGE2 synthesis [25]. This unraveled a relevant uninvestigated drug target in high-risk neuroblastoma.
To evaluate pharmacological mPGES-1 inhibition we used preclinical models mimicking two high-risk neuroblastoma subsets. Characterization of these models revealed a close resemblance to the human high-risk neuroblastomas in regards to COX and mPGES-1 expression. Also, the PGE2 receptors showed the same expression pattern in high-risk neuroblastoma and in the corresponding models. This emphasizes the relevance of these neuroblastoma models for preclinical studies of mPGES-1 inhibition [38].
Pharmacokinetics studies of the mPGES-1 inhibitor CIII revealed a rapid uptake with the highest concentration in plasma and tumor tissues at 2 h post injection. The CIII concentration then declined with time. The reduction in PGE2 concentration followed the same profile with the highest effect on PGE2 inhibition 2 h after administration of CIII. Even so, this transient reduction in PGE2 concentration had a distinct impact on tumor growth.
By targeting the PGE2 production in CAFs through selective inhibition of mPGES-1 we significantly reduced tumor growth of established tumors in the 11q-deleted neuroblastoma xenograft mouse model. Even though the early initiated treatment with CIII did not significantly delay tumor establishment, the early treatment significantly hampered the aggressive tumor growth rate seen in the untreated mice once tumors were established. This prophylactic treatment with CIII resulted in the same tumor weight at sacrifice as the treatment of established tumors. This could mean that inhibition of mPGES-1 at an early time point leads to an altered microenvironment resulting in a slow growing tumor or even inhibiting the development of macroscopic tumor growth. At the same time, treatment of the already existing tumor with an established immunosuppressive and PGE2 dependent microenvironment is enough to halt tumor growth.
Treatment with CIII of TH-MYCN transgenic mice significantly reduced tumor growth. This model is known for its extremely aggressive growth pattern and once the tumor is established it is difficult to suppress its progression [31]. We were able to control the tumor growth with a single targeted treatment, without any toxic side effects, targeting only non-malignant stromal cells of the microenvironment. Comparison of mPGES-1 and COX inhibition revealed that in the TH-MYCN model, mPGES-1 inhibition recapitulated the anti-tumor benefits of COX inhibition without the side effects caused by the systemic and unspecific reduction of prostanoid production. mPGES-1 inhibition in the xenograft model also recapitulated the anti-tumor effect seen with diclofenac as reported previously [25].
High-risk neuroblastoma presents an immunosuppressive microenvironment with higher infiltration of alternatively activated macrophages (M2) compared with low-risk neuroblastoma [7,10,25,39]. Studies of the tgTH-MYCN mice have also revealed a gradual transition of tumor-associated macrophages (TAMs) in the microenvironment from an M1 towards a pro-tumorigenic M2 phenotype during tumor development [9,35]. We therefore evaluated the immunomodulatory effect of mPGES-1 inhibition on the microenvironment. Treatment with CIII resulted in the education of tumor-associated macrophages towards an M1 phenotype supporting host immune response.
During tumor development, formation of new vessels is crucial for cancer progression and maintenance. Several studies have shown the importance of PGE2 in promoting angiogenic factors in several solid tumors including neuroblastoma [11,[40], [41], [42]]. The pharmacological impact of mPGES-1 inhibition on angiogenesis was assessed in tumors from CIII treated mice. Angiogenesis was significantly reduced after early intervention in angiogenic-driven tgTH-MYCN mice tumors and a trend was observed towards reduced angiogenesis upon early CIII treatment in the less angiogenic 11q-deleted xenograft tumors. This suggests that selective mPGES-1 inhibition at an early state hampers angiogenesis and thereby tumor progression, in particular in MYCN-driven tumors.
Recent reports demonstrate that CAFs mediate tumor-enhancing inflammation [43,44]. Here we show that the inflammatory regulator STAT3 is activated in mPGES-1 expressing CAFs. By breaking the PGE2 linked crosstalk between CAFs and the microenvironment with CIII we significantly reduced the presence of PDGFRβ positive CAFs in the treated tumors compared to controls. This suggests that targeting mPGES-1 not only inhibits the function of the enzyme but also results in the reduction of the cellular source of mPGES-1 in the microenvironment. We therefore aimed to further investigate the importance of PGE2 in the tumor-driven recruitment of CAFs.
In a transwell assay, migration of fibroblasts towards tumor cells was inhibited in the presence of CIII. The same result was obtained with an EP4 antagonist. In the experimental models, stromal cells predominantly expressed EP4. A similar pattern was detected in human high-risk neuroblastoma suggesting that autocrine signaling through PGE2-EP4 is crucial for migration of CAFs in high-risk neuroblastoma.
To date, the majority of cancer therapies target the proliferating, genetically unstable cancer cells of the tumor, leading to development of resistance and relapse due to selective pressure and clonal evolution. To overcome these limitations of established therapies, targeting of non-neoplastic cells in the tumor microenvironment has been suggested. Here we show that selective inhibition of mPGES-1 modulates the microenvironment and significantly inhibits tumor growth by impaired angiogenesis, inhibited migration and infiltration of CAFs, reduced cancer cell proliferation and a favorable shift in the M1/M2 macrophage ratio. The fact that we could recapitulate the anti-tumor effect of COX inhibition without side effects strengthen our hypothesis that mPGES-1 inhibition is an alternative to NSAIDs. We therefore conclude that a non-toxic treatment targeting stromal cells in the tumor may constitute an additional clinical therapeutic approach for children with high-risk neuroblastoma.
Funding Sources
The funders had no role in study design, data collection, analysis, interpretation of results, writing of the manuscript or the decision to submit and publish.
Conflict of Interest
P-J.J. is member of the board of directors of Gesyntha pharma, a company that develops anti-inflammatory drugs. All other authors declare no conflict of interest.
Author Contributions
A.K., K.L., F.B., M.K., J.I.J., P-J.J. and P.K. designed research, A.K., K.L., F.B., N.E., L.E. and J.R. performed research, A.K., K.L., F.B., N.E., M.K., J.I.J., P-J.J. and P.K. analyzed data and A.K., K.L., F.B., P-J.J. and P.K. wrote the paper. All authors approved the final version of the paper.
Acknowledgments
This work was supported by grants from the Swedish Childhood Cancer Foundation (grant no: PR2015-0057, TJ2017-0040, PR2017-0122, PR2017-0082, TJ2014-0055, TJ2012-0010, NCP 2015-0072, PR2015-0098), the Swedish Research Council (grant no: 2017-02577, 2014-4988), The Swedish Cancer Society (grant no: CAN2016/739, CAN2015/633, CAN2016/839), Swedish Foundation for Strategic Research (grant no: RB13-0204), The Swedish Rheumatism Association (grant no: R-755861), King Gustaf V 80 Years Foundation, Märta and Gunnar V Philipson Foundation, Radiumhemmets forskningsfonder (grant no: 151132, 161123), Innovative Medicines Initiative (EU/EFPIA) (ULTRA-DD grant no: 115766) and The Stockholm County Council (grant no: 20160378, 20170505).
Footnotes
Supplementary data to this article can be found online at https://doi.org/10.1016/j.ebiom.2018.05.008.
Appendix A. Supplementary data
Supplementary material
References
- 1.Hanahan D., Weinberg R.A. Hallmarks of cancer: The next generation. Cell. 2011;144(5):646–674. doi: 10.1016/j.cell.2011.02.013. [DOI] [PubMed] [Google Scholar]
- 2.Mantovani A., Allavena P., Sica A., Balkwill F. Cancer-related inflammation. Nature. 2008;454(7203):436–444. doi: 10.1038/nature07205. [DOI] [PubMed] [Google Scholar]
- 3.Vesely M.D., Schreiber R.D. Cancer immunoediting: Antigens, mechanisms, and implications to cancer immunotherapy. Ann N Y Acad Sci. 2013;1284(1):1–5. doi: 10.1111/nyas.12105. [DOI] [PMC free article] [PubMed] [Google Scholar]
- 4.Maris J.M. Recent advances in neuroblastoma. N Engl J Med. 2010;362(23):2202–2211. doi: 10.1056/NEJMra0804577. [DOI] [PMC free article] [PubMed] [Google Scholar]
- 5.Matthay K.K., Maris J.M., Schleiermacher G., Nakagawara A., Mackall C.L., Diller L. Neuroblastoma. Nat Rev Dis Primers. 2016;2 doi: 10.1038/nrdp.2016.78. (Article:16078) [DOI] [PubMed] [Google Scholar]
- 6.Carén H., Kryh H., Nethander M., Sjoberg R.M., Trager C., Nilsson S. High-risk neuroblastoma tumors with 11q-deletion display a poor prognostic, chromosome instability phenotype with later onset. Proc Natl Acad Sci USA. 2010;107(9):4323–4328. doi: 10.1073/pnas.0910684107. [DOI] [PMC free article] [PubMed] [Google Scholar]
- 7.Asgharzadeh S., Salo J.A., Ji L., Oberthuer A., Fischer M., Berthold F. Clinical significance of tumor-associated inflammatory cells in metastatic neuroblastoma. J Clin Oncol. 2012;30(28):3525–3532. doi: 10.1200/JCO.2011.40.9169. [DOI] [PMC free article] [PubMed] [Google Scholar]
- 8.Cheung N.K., Dyer M.A. Neuroblastoma: Developmental biology, cancer genomics and immunotherapy. Nat Rev Cancer. 2013;13(6):397–411. doi: 10.1038/nrc3526. [DOI] [PMC free article] [PubMed] [Google Scholar]
- 9.Mao Y., Eissler N., Blanc K.L., Johnsen J.I., Kogner P., Kiessling R. Targeting suppressive myeloid cells potentiates checkpoint inhibitors to control spontaneous neuroblastoma. Clin Cancer Res. 2016;22(15):3849–3859. doi: 10.1158/1078-0432.CCR-15-1912. [DOI] [PubMed] [Google Scholar]
- 10.Pistoia V., Morandi F., Bianchi G., Pezzolo A., Prigione I., Raffaghello L. Immunosuppressive microenvironment in neuroblastoma. Front Oncol. 2013;3 doi: 10.3389/fonc.2013.00167. (Article:167) [DOI] [PMC free article] [PubMed] [Google Scholar]
- 11.Liu B., Qu L., Yan S. Cyclooxygenase-2 promotes tumor growth and suppresses tumor immunity. Cancer Cell Int. 2015;15(1) doi: 10.1186/s12935-015-0260-7. (Article:106) [DOI] [PMC free article] [PubMed] [Google Scholar]
- 12.Nakanishi M., Rosenberg D.W. Multifaceted roles of PGE2 in inflammation and cancer. Semin Immunopathol. 2013;35(2):123–137. doi: 10.1007/s00281-012-0342-8. [DOI] [PMC free article] [PubMed] [Google Scholar]
- 13.Sinha P., Clements V.K., Fulton A.M., Ostrand-Rosenberg S. Prostaglandin E2 promotes tumor progression by inducing myeloid-derived suppressor cells. Cancer Res. 2007;67(9):4507–4513. doi: 10.1158/0008-5472.CAN-06-4174. [DOI] [PubMed] [Google Scholar]
- 14.Brocard E., Oizel K., Lalier L., Pecqueur C., Paris F., Vallette F.M. Radiation-induced PGE2 sustains human glioma cells growth and survival through EGF signaling. Oncotarget. 2015;6(9):6840–6849. doi: 10.18632/oncotarget.3160. [DOI] [PMC free article] [PubMed] [Google Scholar]
- 15.Kurtova A.V., Xiao J., Mo Q., Pazhanisamy S., Krasnow R., Lerner S.P. Blocking PGE2-induced tumour repopulation abrogates bladder cancer chemoresistance. Nature. 2015;517(7533):209–213. doi: 10.1038/nature14034. [DOI] [PMC free article] [PubMed] [Google Scholar]
- 16.Finetti F., Terzuoli E., Bocci E., Coletta I., Polenzani L., Mangano G. Pharmacological inhibition of microsomal prostaglandin E synthase-1 suppresses epidermal growth factor receptor-mediated tumor growth and angiogenesis. PLoS One. 2012;7(7) doi: 10.1371/journal.pone.0040576. [DOI] [PMC free article] [PubMed] [Google Scholar]
- 17.Hanaka H., Pawelzik S.C., Johnsen J.I., Rakonjac M., Terawaki K., Rasmuson A. Microsomal prostaglandin E synthase 1 determines tumor growth in vivo of prostate and lung cancer cells. Proc Natl Acad Sci USA. 2009;106(44):18757–18762. doi: 10.1073/pnas.0910218106. [DOI] [PMC free article] [PubMed] [Google Scholar]
- 18.Kamei D., Murakami M., Sasaki Y., Nakatani Y., Majima M., Ishikawa Y. Microsomal prostaglandin E synthase-1 in both cancer cells and hosts contributes to tumour growth, invasion and metastasis. Biochem J. 2010;425(2):361–371. doi: 10.1042/BJ20090045. [DOI] [PMC free article] [PubMed] [Google Scholar]
- 19.Samuelsson B., Morgenstern R., Jakobsson P.J. Membrane prostaglandin E synthase-1: A novel therapeutic target. Pharmacol Rev. 2007;59(3):207–224. doi: 10.1124/pr.59.3.1. [DOI] [PubMed] [Google Scholar]
- 20.Wang D., Dubois R.N. Eicosanoids and cancer. Nat Rev Cancer. 2010;10(3):181–193. doi: 10.1038/nrc2809. [DOI] [PMC free article] [PubMed] [Google Scholar]
- 21.Zelenay S., van der Veen A.G., Bottcher J.P., Snelgrove K.J., Rogers N., Acton S.E. Cyclooxygenase-dependent tumor growth through evasion of immunity. Cell. 2015;162(6):1257–1270. doi: 10.1016/j.cell.2015.08.015. [DOI] [PMC free article] [PubMed] [Google Scholar]
- 22.Pawelzik S.C., Uda N.R., Spahiu L., Jegerschold C., Stenberg P., Hebert H. Identification of key residues determining species differences in inhibitor binding of microsomal prostaglandin E synthase-1. J Biol Chem. 2010;285(38):29254–29261. doi: 10.1074/jbc.M110.114454. [DOI] [PMC free article] [PubMed] [Google Scholar]
- 23.Leclerc P., Idborg H., Spahiu L., Larsson C., Nekhotiaeva N., Wannberg J. Characterization of a human and murine mPGES-1 inhibitor and comparison to mPGES-1 genetic deletion in mouse models of inflammation. Prostaglandins Other Lipid Mediat. 2013;107:26–34. doi: 10.1016/j.prostaglandins.2013.09.001. [DOI] [PubMed] [Google Scholar]
- 24.Leclerc P., Pawelzik S.C., Idborg H., Spahiu L., Larsson C., Stenberg P. Characterization of a new mPGES-1 inhibitor in rat models of inflammation. Prostaglandins Other Lipid Mediat. 2013;102–103:1–12. doi: 10.1016/j.prostaglandins.2013.03.005. [DOI] [PubMed] [Google Scholar]
- 25.Larsson K., Kock A., Idborg H., Arsenian Henriksson M., Martinsson T., Johnsen J.I. COX/mPGES-1/PGE2 pathway depicts an inflammatory-dependent high-risk neuroblastoma subset. Proc Natl Acad Sci USA. 2015;112(26):8070–8075. doi: 10.1073/pnas.1424355112. [DOI] [PMC free article] [PubMed] [Google Scholar]
- 26.Gotwals P., Cameron S., Cipolletta D., Cremasco V., Crystal A., Hewes B. Prospects for combining targeted and conventional cancer therapy with immunotherapy. Nat Rev Cancer. 2017;17(5):286–301. doi: 10.1038/nrc.2017.17. [DOI] [PubMed] [Google Scholar]
- 27.Johnsen J.I., Lindskog M., Ponthan F., Pettersen I., Elfman L., Orrego A. Cyclooxygenase-2 is expressed in neuroblastoma, and nonsteroidal anti-inflammatory drugs induce apoptosis and inhibit tumor growth in vivo. Cancer Res. 2004;64(20):7210–7215. doi: 10.1158/0008-5472.CAN-04-1795. [DOI] [PubMed] [Google Scholar]
- 28.Idborg H., Olsson P., Leclerc P., Raouf J., Jakobsson P.J., Korotkova M. Effects of mPGES-1 deletion on eicosanoid and fatty acid profiles in mice. Prostaglandins Other Lipid Mediat. 2013;107:18–25. doi: 10.1016/j.prostaglandins.2013.07.004. [DOI] [PubMed] [Google Scholar]
- 29.Melin E., Lindroos E., Lundberg I.E., Borg K., Korotkova M. Elevated expression of prostaglandin E2 synthetic pathway in skeletal muscle of prior polio patients. J Rehabil Med. 2014;46(1):67–72. doi: 10.2340/16501977-1230. [DOI] [PubMed] [Google Scholar]
- 30.Kryh H., Carén H., Erichsen J., Sjöberg R.M., Abrahamsson J., Kogner P. Comprehensive SNP array study of frequently used neuroblastoma cell lines; copy neutral loss of heterozygosity is common in the cell lines but uncommon in primary tumors. BMC Genomics. 2011;12(1) doi: 10.1186/1471-2164-12-443. (Article:443) [DOI] [PMC free article] [PubMed] [Google Scholar]
- 31.Rasmuson A., Segerström L., Nethander M., Finnman J., Elfman L.H., Javanmardi N. Tumor development, growth characteristics and spectrum of genetic aberrations in the TH-MYCN mouse model of neuroblastoma. PLoS One. 2012;7(12) doi: 10.1371/journal.pone.0051297. [DOI] [PMC free article] [PubMed] [Google Scholar]
- 32.Weiss W.A., Aldape K., Mohapatra G., Feuerstein B.G., Bishop J.M. Targeted expression of MYCN causes neuroblastoma in transgenic mice. EMBO J. 1997;16(11):2985–2995. doi: 10.1093/emboj/16.11.2985. [DOI] [PMC free article] [PubMed] [Google Scholar]
- 33.Yu H., Pardoll D., Jove R. STATs in cancer inflammation and immunity: A leading role for STAT3. Nat Rev Cancer. 2009;9(11):798–809. doi: 10.1038/nrc2734. [DOI] [PMC free article] [PubMed] [Google Scholar]
- 34.Olesch C., Sha W., Angioni C., Sha L.K., Acaf E., Patrignani P. MPGES-1-derived PGE2 suppresses CD80 expression on tumor-associated phagocytes to inhibit anti-tumor immune responses in breast cancer. Oncotarget. 2015;6(12):10284–10296. doi: 10.18632/oncotarget.3581. [DOI] [PMC free article] [PubMed] [Google Scholar]
- 35.Carlson L.M., Rasmuson A., Idborg H., Segerstrom L., Jakobsson P.J., Sveinbjornsson B. Low-dose aspirin delays an inflammatory tumor progression in vivo in a transgenic mouse model of neuroblastoma. Carcinogenesis. 2013;34(5):1081–1088. doi: 10.1093/carcin/bgt009. [DOI] [PubMed] [Google Scholar]
- 36.Baryawno N., Sveinbjornsson B., Eksborg S., Orrego A., Segerstrom L., Oqvist C.O. Tumor-growth-promoting cyclooxygenase-2 prostaglandin E2 pathway provides medulloblastoma therapeutic targets. Neuro-Oncology. 2008;10(5):661–674. doi: 10.1215/15228517-2008-035. [DOI] [PMC free article] [PubMed] [Google Scholar]
- 37.Uracz W., Uracz D., Olszanecki R., Gryglewski R.J. Interleukin 1beta induces functional prostaglandin E synthase in cultured human umbilical vein endothelial cells. J Physiol Pharmacol. 2002;53(4):643–654. [PubMed] [Google Scholar]
- 38.Rasmuson A., Kock A., Fuskevag O.M., Kruspig B., Simon-Santamaria J., Gogvadze V. Autocrine prostaglandin E2 signaling promotes tumor cell survival and proliferation in childhood neuroblastoma. PLoS One. 2012;7(1) doi: 10.1371/journal.pone.0029331. [DOI] [PMC free article] [PubMed] [Google Scholar]
- 39.Borriello L., Seeger R.C., Asgharzadeh S., DeClerck Y.A. More than the genes, the tumor microenvironment in neuroblastoma. Cancer Lett. 2015;380(1):304–314. doi: 10.1016/j.canlet.2015.11.017. [DOI] [PMC free article] [PubMed] [Google Scholar]
- 40.Jain S., Chakraborty G., Raja R., Kale S., Kundu G.C. Prostaglandin E2 regulates tumor angiogenesis in prostate cancer. Cancer Res. 2008;68(19):7750–7759. doi: 10.1158/0008-5472.CAN-07-6689. [DOI] [PubMed] [Google Scholar]
- 41.Ponthan F., Wickstrom M., Gleissman H., Fuskevag O.M., Segerstrom L., Sveinbjornsson B. Celecoxib prevents neuroblastoma tumor development and potentiates the effect of chemotherapeutic drugs in vitro and in vivo. Clin. Cancer Res. 2007;13(3):1036–1044. doi: 10.1158/1078-0432.CCR-06-1908. [DOI] [PubMed] [Google Scholar]
- 42.Xu L., Stevens J., Hilton M.B., Seaman S., Conrads T.P., Veenstra T.D. COX-2 inhibition potentiates antiangiogenic cancer therapy and prevents metastasis in preclinical models. Sci Transl Med. 2014;6(242) doi: 10.1126/scitranslmed.3008455. [DOI] [PMC free article] [PubMed] [Google Scholar]
- 43.Gascard P., Tlsty T.D. Carcinoma-associated fibroblasts: Orchestrating the composition of malignancy. Genes Dev. 2016;30(9):1002–1019. doi: 10.1101/gad.279737.116. [DOI] [PMC free article] [PubMed] [Google Scholar]
- 44.Takahashi H., Sakakura K., Kudo T., Toyoda M., Kaira K., Oyama T. Cancer-associated fibroblasts promote an immunosuppressive microenvironment through the induction and accumulation of protumoral macrophages. Oncotarget. 2017;8(5):8633–8647. doi: 10.18632/oncotarget.14374. [DOI] [PMC free article] [PubMed] [Google Scholar]
Associated Data
This section collects any data citations, data availability statements, or supplementary materials included in this article.
Supplementary Materials
Supplementary material