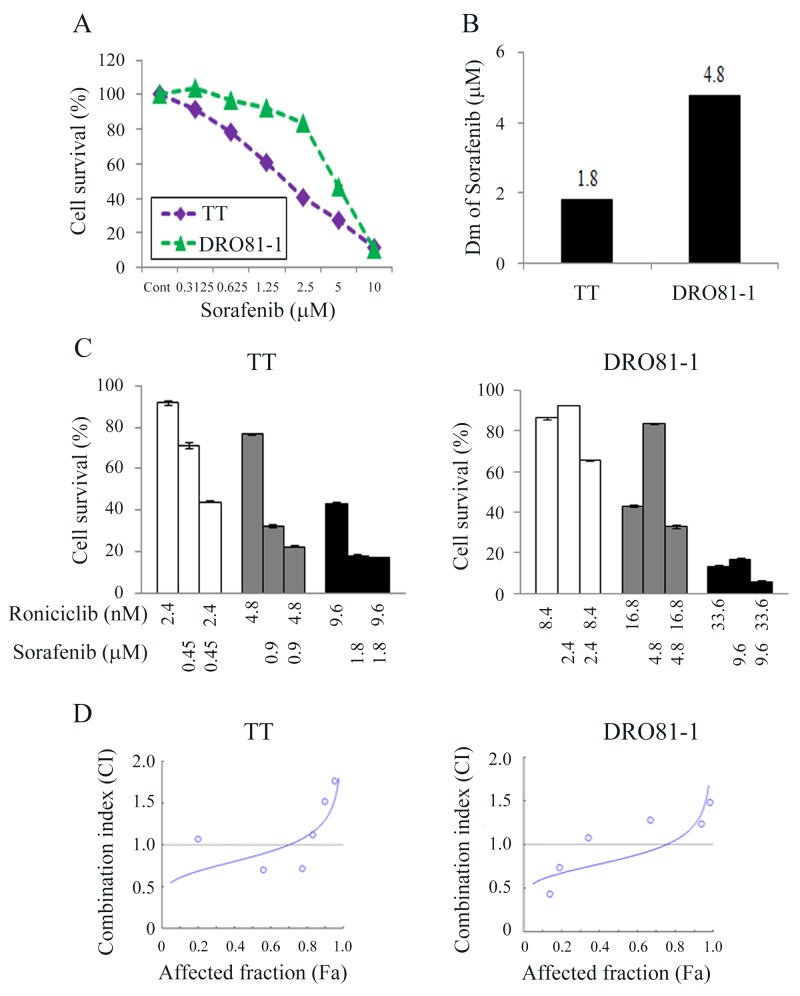
Figure 5. Combination therapy of roniciclib and sorafenib against MTC cells.
(A) Cytotoxicity was evaluated in cells treated with a series of six two-fold dilutions of sorafenib starting at 10 μmol/L in TT and DRO81-1 cells. Dose-response curves were obtained on day 4 using LDH assays. (B) Median-effect dose (Dm) of sorafenib on day 4 was calculated for each cell line using CompuSyn software. (C) The cytotoxic effects of roniciclib and sorafenib alone or in combination after a 4-day treatment in MTC cells were evaluated using LDH assays. (D) The combination index (CI) of roniciclib and sorafenib was calculated using CompuSyn software. Roniciclib and sorafenib had synergistic to antagonistic effects in TT and DRO81-1 cells. Synergistic effects were recognized when lower fractions of cells affected in TT (affected fraction ≤ 0.7) and DRO81-1 (affected fraction ≤ 0.75). Horizontal lines at CI = 1 were drawn for discrimination of synergism (CI < 1) and antagonism (CI > 1).

