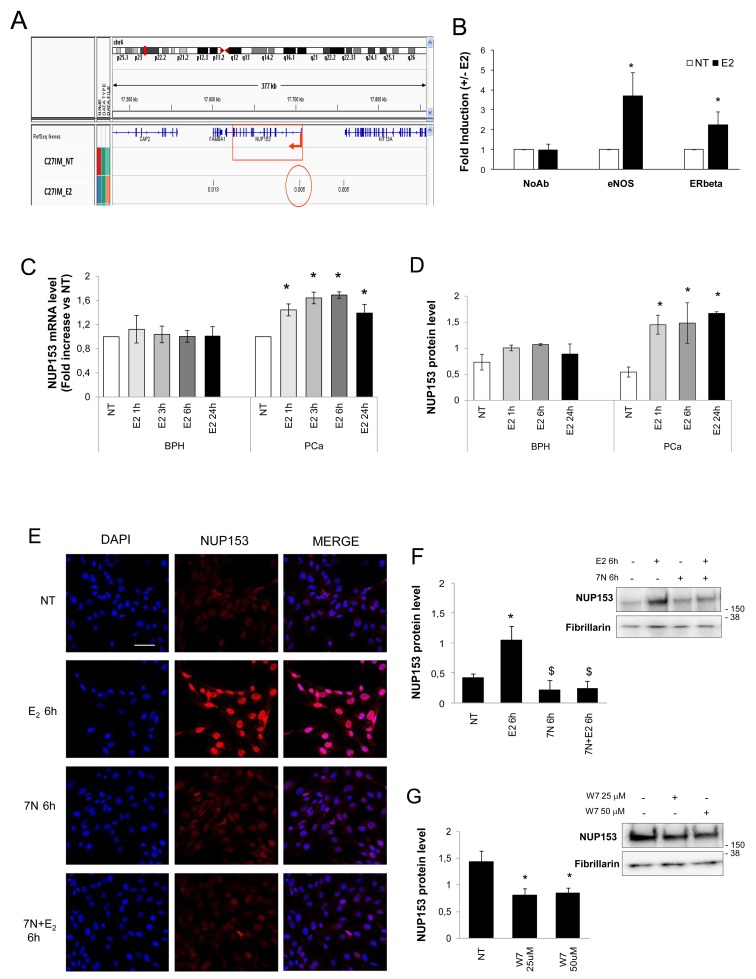
Figure 2. eNOS binds Nup153 promoter and regulates its expression in an estrogen-dependent manner.
(A) Integrated Genome Viewer (IGV 2.3) screenshot showing peaks of eNOS identified by ChIP–Seq at the genomic regions encoding Nup153 in PCa cells (C27IM) in the absence (NT) or presence of 17β-estradiol (E2, 10-7M, 45min). Region amplified in panel B is indicated with a red circle. (B) Recruitment of eNOS and ERβ on the promoter region of Nup153 by ChIPs in the presence or absence of E2 (45 min) in C27IM cells. The immunoprecipitations were performed using anti-eNOS (Type III, BD), anti-ERβ (L-20) or no antibody (NoAb) as a negative control. Values are represented as fold of induction (+/-E2) and as mean +/-SEM of 3 independent experiments. *p<0.05 E2 vs NT. (C) Nup153 mRNA levels quantified by qRT-PCR in PCa and BPH cells in basal condition (NT) and after E2 in a time course of 1, 3, 6 or 24 hours. The results are plotted as fold induction vs NT +/-SEM of 3 independent experiments.*p<0.05 E2 vs NT. (D) Nup153 protein levels were analysed by western blot in PCa and BPH cells in a time course of 1, 6 or 24 hours. Numbers represent optical density analysis of bands normalized to loading control. Data are mean +/-SEM of 3 and 4 independent experiments for BPH and PCa, respectively. *p< 0.05 vs NT. (E) Confocal analysis of Nup153 ([QE5]; red) in PCa cells untreated (NT) or treated with E2 (10-7M) and/or 7N (0.5 mM) for 6 hours. Nuclei were counterstained with DAPI (blue) and merged with the Nup153 signal (red). Scale bar 25μm. (F-G) Protein level analysis of Nup153 before and after E2 (10-7M, 6h) alone or in combination with 7N (0.5 mM, 6h) (F) and upon W7 (G) treatment (25 μM and 50μM, overnight). Right Panel: Representative western blot of Nup153. Fibrillarin served as loading control. Left Panel: Numbers represent optical density analysis of bands normalized to loading control. Data are mean +/-SEM of 3 for W7 and 4 for 7N independent experiments. *p< 0.05 vs NT; $ p< 0.05 vs E2.

