ABSTRACT
Aspergillus fumigatus causes life-threatening lung infections in immunocompromised patients. Mouse models are extensively used in research to assess the in vivo efficacies of antifungals. In recent years, there has been an increasing interest in the use of noninvasive imaging techniques to evaluate experimental infections. However, single imaging modalities have limitations concerning the type of information they can provide. In this study, magnetic resonance imaging and bioluminescence imaging were combined to obtain longitudinal information on the extent of developing lesions and fungal load in a leukopenic mouse model of invasive pulmonary aspergillosis (IPA). This multimodal imaging approach was used to assess changes occurring within lungs of infected mice receiving voriconazole treatment starting at different time points after infection. The results showed that IPA development depends on the inoculum size used to infect animals and that disease can be successfully prevented or treated by initiating intervention during early stages of infection. Furthermore, we demonstrated that a reduction in fungal load is not necessarily associated with the disappearance of lesions on anatomical lung images, especially when antifungal treatment coincides with immune recovery. In conclusion, multimodal imaging allows an investigation of different aspects of disease progression or recovery by providing complementary information on dynamic processes, which are highly useful for assessing the efficacy of (novel) therapeutic compounds in a time- and labor-efficient manner.
KEYWORDS: invasive pulmonary aspergillosis, mouse model, multimodal imaging, antifungal therapy
INTRODUCTION
Aspergillus fumigatus is an opportunistic pathogen which is ubiquitous in the environment (1). Inhalation of fungal spores can result in invasive pulmonary aspergillosis (IPA), especially in patients with prolonged neutropenia or underlying hematopoietic malignancies (2–5). Voriconazole and isavuconazole are recommended first-line treatment options for invasive aspergillosis (6, 7). In addition to antifungal treatment, reversal of the underlying immunosuppression is also a key element in the successful management of IPA (7). Preclinical research plays an important role in investigating the pathogenesis of IPA and in testing antifungal treatment strategies. In a previous study, we showed that anatomical imaging techniques, such as magnetic resonance imaging (MRI) and computed tomography (CT), are highly suitable for monitoring dynamic disease-related changes in a leukopenic mouse model of IPA (8). The noninvasive character of these techniques did not only allow for the longitudinal visualization of developing lung lesions, but also for the quantification of imaging-derived biomarkers, such as the lung tissue volume. However, besides obtaining insight into structural changes occurring in the lung upon infection, it is also crucial to obtain information on fungal growth in order to fully comprehend all aspects of developing disease and the treatment response. As an alternative to standard invasive techniques, such as CFU counting to assess infection, there has been great interest in using noninvasive imaging techniques to quantify the fungal load.
Bioluminescence imaging (BLI) is an optical technique based on the detection of photons, which are generated by an enzymatic reaction upon administration of luciferin substrate (9). To apply this imaging modality to the infectious diseases field, pathogens have to be genetically modified to express the luciferase enzyme. As only viable cells can produce bioluminescent signals, the detected signal can be used to determine dynamic changes in the microbial load of an organ. Therefore, the obtained readouts are comparable to the results obtained by conventional CFU counting (10). BLI has already been used extensively to study bacterial and viral infections in both superficially located organs, such as the skin, and deeply located organs, such as the lungs (11–19). Unfortunately, transforming fungi to express luciferase turned out to be more challenging. Initial studies focused on the transformation of Saccharomyces cerevisiae and Candida albicans (20, 21). In vivo, only partial success was obtained with the bioluminescent C. albicans strain using Renilla or surface-anchored Gaussia luciferase (22–25). It proved to be feasible to monitor superficial infections, but limitations in the availability of the substrate coelenterazine and absorption of the emitted light (480 nm) by hemoglobin hampered the detection of deep-seated infections. These difficulties were overcome by using a codon-optimized firefly luciferase, which enabled a study of disseminated candidiasis and revealed an unexpected persistence of C. albicans in the gallbladder under antifungal therapy (26).
The firefly luciferase has also been successfully used to monitor invasive aspergillosis caused by A. fumigatus (10). In a first approach of using the bioluminescent strain, it was possible to visualize the early stages of disease in a cortisone-induced mouse model of IPA. However, imaging of late-stage disease was hampered by restrictions in oxygen and substrate availability at the lesion site due to the strong inflammatory response and associated necrosis. Further studies revealed that the choice of immunosuppressive regimen has an important impact on the evolution of bioluminescence during the progression of the disease (27). In contrast to the cortisone model, disease progression in cyclophosphamide-induced mice was associated with a strong increase in BLI signal over time due to rapid fungal growth and lung tissue invasion. Furthermore, it was shown that animals treated with lipid amphotericin or voriconazole show a transient increase in BLI signal, followed by a clear decrease in cases of treatment success (28). These results highlight the added value of using BLI for obtaining information on changes in fungal burden occurring within the lungs of leukopenic mice suffering from IPA.
In most studies, single imaging techniques are used to assess disease progression and treatment response, which strongly limit the amount and type of acquired information (8, 10, 28). In this study, optical and anatomical imaging techniques were combined to noninvasively obtain complementary information on IPA development in a leukopenic mouse model. Furthermore, the influence of voriconazole treatment on both the fungal load and lesion size was longitudinally investigated. The aim of this study was to improve our knowledge on the relationship between detected lesions and fungal growth in a completely noninvasive manner.
RESULTS
Longitudinal assessment of fungal load and lung anatomy changes by combining MRI and BLI.
In this study, mice were rendered leukopenic by two injections of cyclophosphamide. All circulating white blood cells were depleted at the time of infection, meaning there were 37.0 ± 6.4 neutrophils, 96.3 ± 33.9 lymphocytes, 0 ± 0 monocytes, 3.7 ± 6.4 eosinophils, and 0 ± 0 basophils/μl present in the blood. In leukopenic mice, pulmonary infection is characterized by excessive hyphal growth (29). In order to mimic clinic management where reversal of immunosuppression is needed for clearance of the fungal infection, no additional boosters of cyclophosphamide postinfection were administered. Consequently, the immune system recovered by day 4, which was reflected by a mean neutrophil count of 162.9 ± 23.12 cells/μl blood.
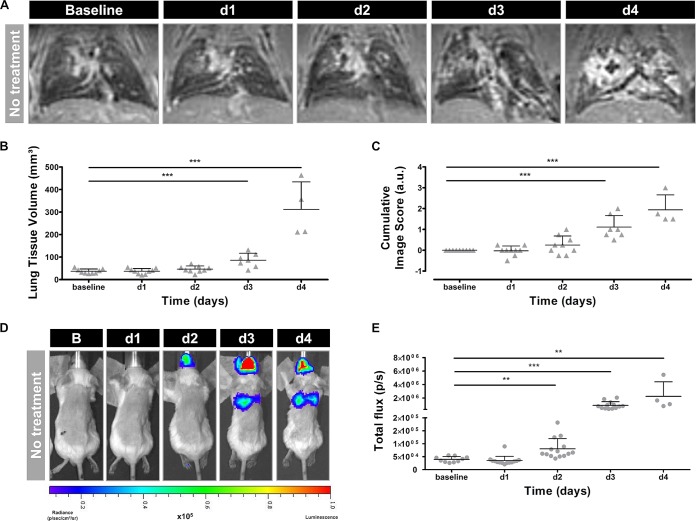
Visual assessment of the MR images revealed the presence of hyperintense lesions within the infected lungs on days 3 and 4 postinfection (Fig. 1A). Both the lung tissue volume and cumulative image scores quantified from these MR images increased over time, reaching significance on days 3 and 4 compared to baseline (Fig. 1B and C). Upon visual inspection of the corresponding bioluminescence images, high signal intensities emerged from the lung area on days 3 and 4 after instillation (Fig. 1D). Furthermore, a bioluminescent signal appeared in the nose region starting from day 2. The total photon flux quantified from the lung region increased over time, becoming significant from day 2 onwards (Fig. 1E). After comparing BLI- and MRI-derived parameters, a strong positive correlation was identified between the total photon flux and the lung tissue volume (R2 = 0.65) and between the total photon flux and cumulative image score (R2 = 0.76) (Fig. 2A and B). By performing in vivo BLI, longitudinal information was obtained on the amount of viable fungal cells present in the lesions detected on the anatomical MR images of infected mouse lungs.
FIG 1.
Multimodal imaging of nontreated mice infected with a high inoculum of A. fumigatus spores. (A) Representative 3D-UTE MR images of the lung before (baseline) and after infection. (B and C) Graphs representing the lung tissue volume and cumulative image score quantified from the 3D-UTE MR images. (D) Representative BL images acquired before (baseline) and after infection. (E) Graph representing the total photon flux quantified from the BL images based on a circular ROI covering the complete lung region. Error bars represent SD of the results from multiple mice (n = 10). *, P < 0.05; **, P < 0.01; ***, P < 0.001. a.u., arbitrary units; d1, d2, d3, and d4, days 1 to 4, respectively.
FIG 2.
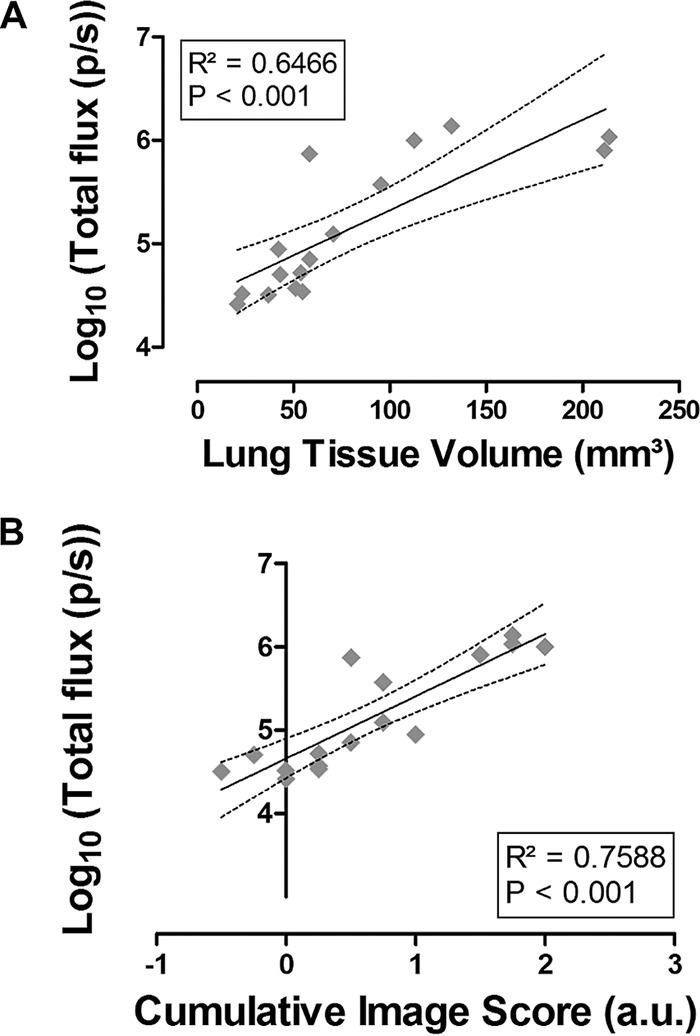
Agreement between biomarkers quantified from BLI and MRI. (A) Linear regression analysis of the BLI-derived total photon flux versus the MRI-derived lung tissue volume. (B) Linear regression analysis of the BLI-derived total photon flux versus the MRI-derived cumulative image score, expressed in arbitrary units. Dashed lines represent the 95% confidence band. p/s, photons per second.
Noninvasive detection of changes in lesion composition resulting from antifungal treatment.
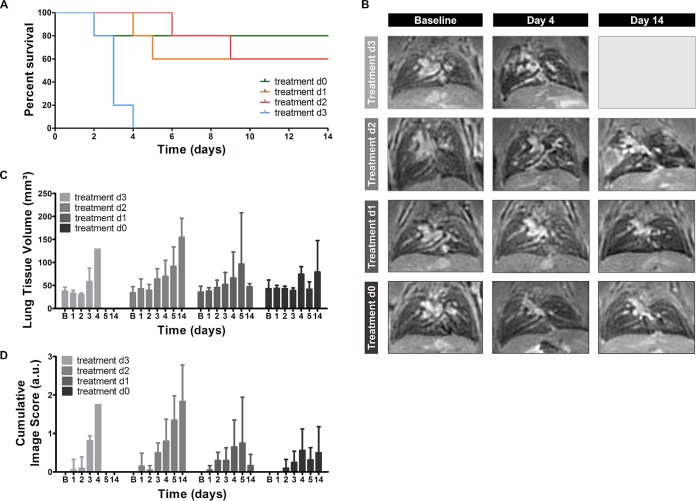
The combination of the two imaging modalities could also be used to obtain a better understanding of the effect of antifungal treatment on the development and composition of lung lesions. To assess differences in therapy response, voriconazole treatment was initiated on the day of infection (day 0) or on day 1, 2, or 3 after infection with a high inoculum. The general condition of each animal was monitored daily, and anatomical lung MR images were acquired on days 1 to 5 and 14. None of the animals receiving treatment starting at day 3 survived longer than 4 days postinfection (Fig. 3A). The lung MR images of these animals showed detectable lesions starting from day 3 (Fig. 3C and D, light-gray bars). Initiating treatment earlier after infection strongly improved the survival rates, as 60% of animals treated from day 2 survived until day 14 (Fig. 3A). However, the MRI scans revealed a gradual increase in lung lesions over time in all animals, proving that treatment did not prevent disease progression in this group (Fig. 3B to D; second row, medium-gray bars). Animals receiving treatment from day 1 postinfection also displayed an improved survival rate (Fig. 3A). Unlike the previous groups, most mice did not develop MR-detectable lesions within the lungs (Fig. 3B, third row). Only two out of five animals showed clear lesion development and needed to be sacrificed by day 4 or 5. As a result, both quantitative MRI-derived biomarkers increased on days 4 and 5, followed by a strong decrease by day 14 (Fig. 3C and D, dark-gray bars). When voriconazole treatment was started immediately after infection, 80% of the animals survived until day 14 (Fig. 3A). Only a limited amount of small lesions developed within the lungs of these animals (Fig. 3B to D; fourth row, black bars).
FIG 3.
MR imaging of animals infected with a high inoculum of A. fumigatus spores receiving voriconazole at different time points. (A) Survival curve including all treatment groups. (B) Representative 3D-UTE MR images of the lung before (baseline) and after infection of all treatment groups. (C and D) Graphs representing the lung tissue volume and cumulative image score quantified from the 3D-UTE MR images for all treatment groups. Error bars represent SD of the results from multiple mice (n = 5 per treatment group). *, P < 0.05; **, P < 0.01; ***, P < 0.001.
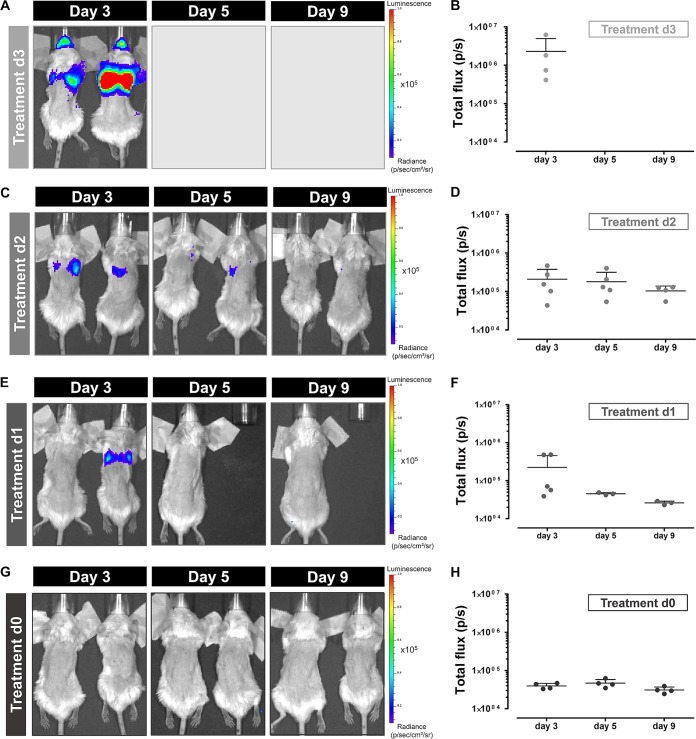
The MRI results of the different treatment groups demonstrated a clear relationship between the timing of treatment initiation and lesion development rate. To obtain information on potential changes in the fungal load during treatment, in vivo BLI scans were acquired on days 3, 5, and 9. Intense BLI signals were observed in the lung area of animals receiving treatment starting from day 3 (Fig. 4A). All animals of this treatment group needed to be sacrificed at the latest by day 4, explaining the lack of data for later time points (Fig. 4B). Animals receiving treatment starting from day 2 also showed clear BLI signal from the lung region on day 3 (Fig. 4C). This signal seemed to decrease by day 5 and returned to background levels by day 9 (Fig. 4D). The quantified values were an order of magnitude lower on day 3 than those of the group with treatment starting at day 3. The majority of animals in which treatment was initiated on day 1 did not show any bioluminescent signal on day 3, 5 or 9 (Fig. 4E and F). However, the two animals showing lesions on the lung MR images also displayed clear BLI signal originating from the lung region on day 3. As these animals had to be sacrificed by day 5, no BLI data were available for later time points. None of the animals receiving treatment from day 0 showed any detectable BLI signal from the lung area (Fig. 4G and H). Both MRI and BLI results indicate that initiation of treatment during the early stages of infection has a beneficial effect on both the survival and disease state of the animal.
FIG 4.
Bioluminescence imaging of animals infected with a high inoculum of A. fumigatus spores receiving voriconazole from different time points. Representative BL images and associated graphs showing the total photon flux of infected mice receiving treatment from day 3 (A and B), day 2 (C and D), day 1 (E and F), or immediately after infection (G and H). Error bars represent SD of the results from multiple mice (n = 5 per treatment group).
Improved treatment success in animals infected with a low inoculum of spores.
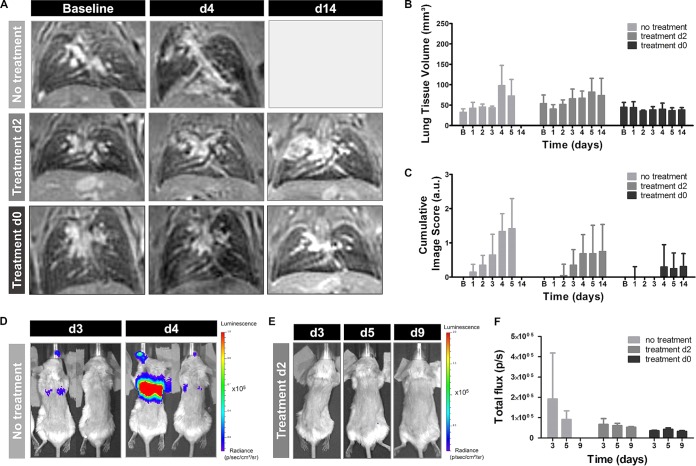
Therapy might affect disease progression differently when animals are infected with a low number of fungal spores, as this model is associated with a high interanimal variation in infection development (8). To further assess this hypothesis, leukopenic mice were instilled with 2 × 10⁵ spores, and voriconazole treatment was initiated on day 0 or day 2. The animals were followed-up by in vivo MRI (days 1 to 5 and 14) and in vivo BLI (days 3, 5, and 9) scans. A separate control group did not receive treatment and was scanned daily until day 7. Half of the nontreated mice needed to be sacrificed by day 4, while the remaining animals survived until day 7. Lesions could be visualized within the lungs of 80% of the nontreated mice and quantified as an increase in lung tissue volume and cumulative image score over time (Fig. 5A to C). Furthermore, BLI signal was detected from the lung region of the majority of animals by day 4, associated by a decrease in BLI signal in the surviving mice (Fig. 5D to F). Within the lungs of mice receiving treatment from day 2, small lesions could be detected on the MR images from day 4 onwards (Fig. 5A to C; second row). However, no BLI signal could be detected from the lung region of any animal from this group (Fig. 5E and F). Animals receiving treatment from day 0 did not develop any detectable lesions within the lungs (Fig. 5A to C and F). These results show an improved therapeutic response in animals infected with a low inoculum, even if treatment is initiated at later time points postinfection.
FIG 5.
Multimodal imaging of mice infected with a low inoculum of A. fumigatus spores. (A) Representative 3D-UTE lung MR images of nontreated animals and animals receiving voriconazole from day 2 or immediately after infection. (B and C) Graphs representing the lung tissue volume and cumulative image score quantified from the 3D-UTE MR images for all animal groups. (D) Representative BL images of nontreated animals on days 3 and 4 after infection. (E) Representative BL images of animals receiving treatment from day 2 on days 3, 5, and 9 after infection. (F) Graphs representing the total photon flux quantified from the BL images for all animal groups. Error bars represent SD of the results from multiple mice (n = 5 per animal group).
Ex vivo analysis of the lungs support the in vivo imaging findings.
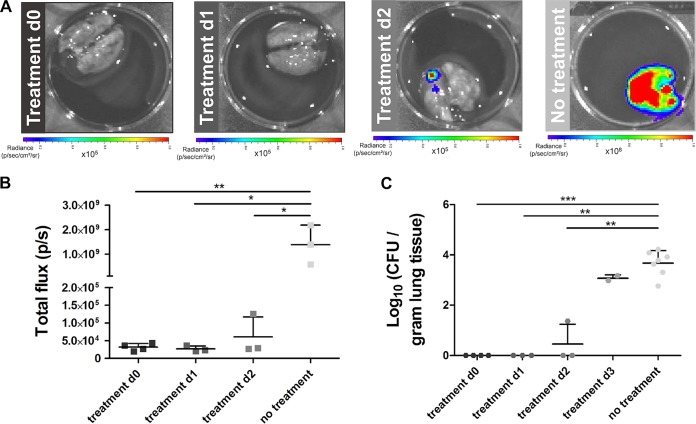
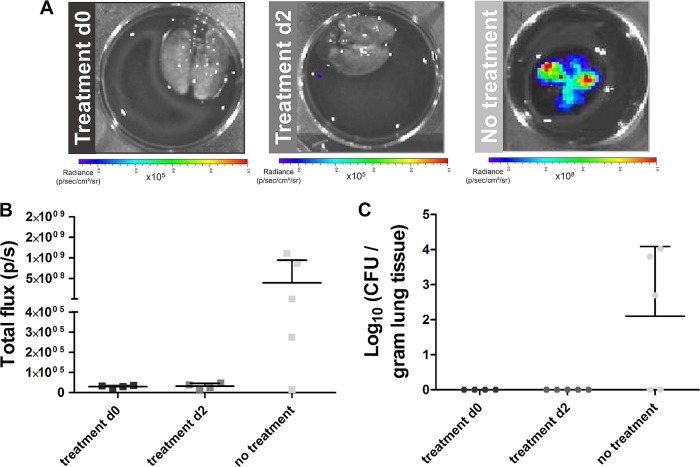
After the last in vivo imaging time point, animals were euthanized, and the lungs were isolated to perform ex vivo BLI, CFU counting, and histology. The lungs of nontreated mice infected with a high inoculum showed a strong BLI signal, which was associated with high total photon flux values and a large amount of counted colonies (Fig. 6A to C, light gray). Comparable CFU counting results were obtained for the animals where treatment commenced on day 3 (Fig. 6C). On the contrary, no BLI signal could be detected from the lungs of mice receiving treatment from day 0 or 1, and no colonies could be grown from their lung tissue (Fig. 6A to C, black and dark gray). Animals receiving treatment from day 2 displayed modest BLI signals in the lungs, and significantly smaller amounts of colonies could be grown from the tissue than from the nontreated group (Fig. 6A to C, medium gray). For animals infected with a low inoculum, the lack of treatment (control group) resulted in a strong BLI signal originating from the lungs (Fig. 7A and B, light gray). Furthermore, colonies could be grown from the lung tissue of most of the animals (Fig. 7C). In contrast, no clear BLI signal could be detected, nor could any colony be grown from the lungs for both treatment groups (Fig. 7A to C, black and medium gray).
FIG 6.
Ex vivo quantification of the fungal load for treated and nontreated animals infected with a high inoculum. (A) Representative ex vivo BL images of lungs isolated after the last imaging time point. (B) Graph representing the total photon flux quantified from the ex vivo BL images using a circular ROI covering the lungs. (C) Graph representing the amount of counted colonies per gram of lung tissue. Error bars represent SD. *, P < 0.05; **, P < 0.01; ***, P < 0.001.
FIG 7.
Ex vivo quantification of the fungal load for treated and nontreated animals infected with a low inoculum. (A) Representative ex vivo BL images of lungs isolated after the last imaging time point. (B) Graph representing the total photon flux quantified from the ex vivo BL images using a circular ROI covering the lungs. (C) Graph representing the amount of counted colonies per gram of lung tissue. Error bars represent SD.
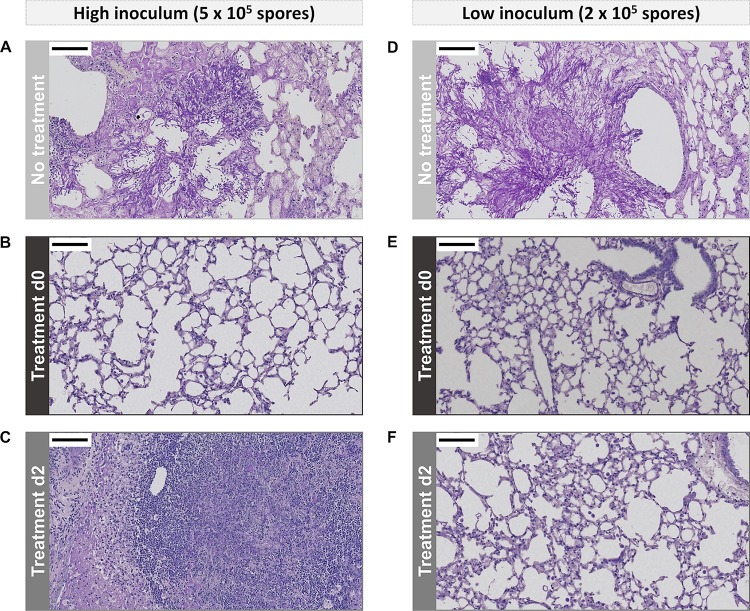
Histological analysis revealed the presence of large amounts of fungal elements within the lungs of nontreated animals infected with a high inoculum (Fig. 8A). Fungal hyphae invaded the airways and blood vessels, thereby destroying the bronchial lining and normal lung structure. Comparable results were obtained for the animals receiving treatment from day 3 onwards (data not shown). In contrast, no fungi were detectable within the lungs of animals receiving treatment during early stages of infection (Fig. 8B). Massive lung lesions were observed in the lungs of animals treated from day 2, which mainly consisted of immune cells and only a limited number of fungal elements (Fig. 8C). Infection with a low inoculum of fungal spores resulted in the development of lesions in the majority of nontreated animals, which contained large amounts of fungal elements (Fig. 8D). On the contrary, animals receiving treatment from days 0 and 2 did not show clear lesions on histological lung sections (Fig. 8E and F). In conclusion, the ex vivo analysis of the lungs confirmed the in vivo multimodal imaging results.
FIG 8.
Light microscopy images of PAS-stained lung sections. Representative images of mice infected with a high inoculum of fungal spores without treatment (A) or after receiving treatment from day 0 (B) or day 2 (C). Representative images of mice infected with a low inoculum of fungal spores without treatment (D) or after receiving treatment from day 0 (E) or day 2 (F). The scale bars (upper left corner) measure 100 μm. For both high- and low-inoculum groups, the lungs of nontreated animals were isolated on day 4 and the lungs of treated animals on day 14 postinfection.
DISCUSSION
This study revealed the potential of combining multimodal imaging approaches to study fungal disease development and treatment success. The acquired MR images revealed the development of extensive lesions within the lung, which is in line with our previously published results (8). In parallel, a strong increase in bioluminescence signal intensity was observed from the lung area during the course of disease. These observations indicate that the lung lesions detected by MRI are predominantly composed of viable fungal cells. Furthermore, a strong bioluminescence signal originating from the nose area likely resulted from fungal colonization or infection of the nasopharynx or sinuses (28). Switching from an intranasal to an intratracheal model could potentially avoid this secondary infection. Multimodal imaging allowed us to noninvasively obtain dynamic information on both fungal load and lesion size in a leukopenic IPA mouse model, which is of interest when assessing the effect of antifungals.
We also investigated the feasibility of noninvasively monitoring the effects of voriconazole treatment, including reductions in the fungal load and potential changes in lesion formation. Voriconazole was therefore administered at different time points after fungal spore instillation. Starting treatment at the latest stage of infection proved to be inefficient in counteracting disease progression. This conforms with the clinical situation, in which a late start of treatment is associated to a poor survival rate (6). On the contrary, initiating treatment during the very first stages of infection successfully prevented IPA development. The survival rates improved drastically, and no pathological changes could be detected within the lungs. These results support the clinical concept that early diagnosis and treatment administration are essential to successfully recover from IPA, and they underline the importance of preemptive antifungal treatment in high-risk patient populations. Furthermore, we showed that the treatment efficacy was higher in animals infected with a low inoculum, even when treatment was initiated as late as 48 h after instillation. Fungal burdens are generally lower in these mice, which facilitates control of the infection by administration of an antifungal compound in combination with restoration of the immune system.
Most preclinical studies initiate treatment immediately after inducing infection, because it increases the success rate for obtaining a positive response. However, studying the delayed therapeutic effect of a compound is much more relevant, as it facilitates the translation of preclinical results to a clinical setting. Previous studies showed that noninvasive imaging techniques can only detect infection as early as 48 h postinstillation in the cyclophosphamide mouse model (8, 28). Based on this information, a true therapeutic treatment strategy was assessed in our imaging study by initiating voriconazole administration on day 2 postinfection. The majority of animals survived for the total observation period of 2 weeks, which is indicative of treatment success. However, MR imaging revealed the clear development of lung lesions, which kept increasing in size over time. The associated BL images showed a transient increase in lung signal, meaning that the lesions detected by MRI still contained a large amount of viable fungal cells up to 24 h after the first administration of voriconazole. At later time points, the number of viable fungi decreased drastically, although lesions did not resolve on the MR images. Histopathological analysis of those lesions revealed a massive influx of immune cells at the lesion sites. All animals were rendered leukopenic at the time of infection, but no additional boosters of cyclophosphamide were administered. This resulted in the recovery of the immune system by day 4 and enabled the development of the observed inflammatory response (30). Altogether, these findings demonstrate that the improvements observed in animals treated from day 2 resulted from an interplay between the fungicidal effect of voriconazole and the inflammatory processes initiated upon the reversal of leukopenia. This slows lesion growth and leads to a change in lesion composition rather than the disappearance of induced lesions.
In clinical practice, decisions concerning discontinuation of antifungal treatment in IPA patients are based on several factors, including immune status and evidence of resolution of clinical signs and symptoms of disease (6, 7). In general, the improvement in lesions detected by CT is considered strong evidence of treatment success. However, multiple clinical studies revealed that a worsening of pulmonary lesions is not necessarily associated with progressing IPA (31–33). Antifungal treatment is, whenever possible, combined with a reduction of immunosuppressive therapy to improve patient outcome, but neutrophil recovery can potentially result in the development of a pulmonary immune reconstitution inflammatory syndrome (IRIS). This syndrome causes a massive influx of immune cells at the site of infection, leading to an increase in lesion size and thus a worsening of radiological findings (31, 32). Both IRIS and refractory IPA are associated with an increase in lesion volume on CT images, making it difficult to distinguish between these two different conditions, although the two require different treatment approaches. There is a need to gather more information on IRIS in the context of IPA management and its impact on disease recovery. Preclinical research could play a role in assessing new treatment and management options, as it was shown in our study that the potential development of IRIS can noninvasively be identified in a leukopenic IPA mouse model by the combined use of BLI and MRI. However, further in-depth studies are needed to confirm the development of IRIS and may require a larger number of animals and the use of additional markers. This can then be combined by the proposed multimodal imaging approach to longitudinally assess the impact of adapting the treatment regimen on the lesion composition and outcome of the subject.
In conclusion, we showed that the combination of BLI and MRI is highly suitable to evaluate different aspects of progressing IPA in leukopenic mice, as it provides complementary information on dynamic changes in fungal load as well as lung lesion development. Furthermore, we were able to gain insights into therapy-induced changes concerning both the extent and the composition of lesions, which is crucial to fully comprehend different aspects of disease recovery or deterioration. We believe that multimodal imaging will become increasingly important in future preclinical studies as a tool to evaluate the in vivo efficacy of therapeutic compounds in a time-efficient manner.
MATERIALS AND METHODS
Fungal strain.
The bioluminescent Aspergillus fumigatus strain 2/7/1 was used (28). The strain was cultured for 3 days at 42°C on diluted Sabouraud agar, containing 10% of the dextrose and peptone concentrations used in regular Sabouraud agar. Conidia were harvested by flooding the agar with saline–0.1% Tween 80 (Sigma-Aldrich, Diegem, Belgium) and gently scraping the surface. The collected suspension was shaken vigorously for 5 min, and spores were counted with a Neubauer hemocytometer. The suspension was diluted to a final concentration of 2.5 × 10⁷ spores/ml or 1.0 × 10⁷ spores/ml.
Mouse model.
All animal experiments were carried out in compliance with national and European regulations and were approved by the animal ethics committee of KU Leuven. Ten-week-old male BALB/c mice (Janvier, Le Genest, France) were rendered leukopenic by intraperitoneal (i.p.) injections of 150 mg/kg of body weight cyclophosphamide (Sigma-Aldrich, Diegem, Belgium) on days 4 and 1 prior to infection. To confirm leukopenia, blood was collected from a subset of animals by cardiac puncture, and 3.8% trisodium citrate dihydrate was added to the sample to prevent coagulation. White blood cells were counted on day 0 (n = 3) and day 4 (n = 3) using the Advia 2120i hematology system (Siemens Healthcare GmbH, Erlangen, Germany).
On day 0, the animals were anesthetized with 1.5 to 2% isoflurane (Abbott Laboratories, Queenborough, UK) in 100% oxygen and intranasally instilled with 20 μl of a suspension containing either 5 × 10⁵ (high inoculum) or 2 × 10⁵ (low inoculum) A. fumigatus spores, as previously described (8). Directly after instillation, the mice were positioned upright until normal breathing was resumed. In this paper, all times are stated relative to the day of inoculation, which we refer to as day 0.
All animals in the treatment groups received daily i.p. injections of 20 mg/kg voriconazole (Vfend; Pfizer, NY, USA) dissolved in saline. For the high-inoculum group, treatment was initiated either on the day of infection (day 0; n = 5) or on day 1 (n = 5), day 2 (n = 5), or day 3 (n = 5) postinfection (PI). Based on the data obtained for this high-inoculum group, treatment was initiated directly on the day of infection (day 0; n = 5) or on day 2 PI (n = 5) for the low-inoculum group. To prevent rapid metabolization of voriconazole, the drinking water was replaced by 100% grapefruit juice (Carrefour brand, Boulogne-Billancourt, France), as described before (34). The disease course was monitored by acquiring MRI scans before infection (baseline) and on days 1 to 5 and 14 PI. In addition, in vivo BLI scans were acquired on days 3, 5, and 9 PI. Nontreated animals (n = 10 for the high-inoculum group, n = 5 for the low-inoculum group) did not receive voriconazole or grapefruit juice. For these mice, daily MRI and in vivo BLI scans were acquired until day 4 PI for the high-inoculum group and until day 7 PI for the low-inoculum group.
During image acquisition, the mice were anesthetized with 1.5 to 2% isoflurane in 100% O2 administered via a nasal cone. Body weight, posture, and body temperature were monitored daily. The animals were sacrificed when humane endpoints were reached, including a strong loss of body weight (>25%), lethargy, and labored breathing. For all treatment groups, the remaining animals that did not reach the humane endpoints were euthanized after the last imaging time point. After sacrificing, ex vivo BLI scans of the isolated lungs were acquired.
Bioluminescence imaging.
Images were acquired using an IVIS Spectrum system (PerkinElmer). For in vivo imaging, anesthetized animals were placed in the flow chamber, and d-luciferin was injected subcutaneously (126 mg/kg). Next, images were acquired until the peak signal intensity was reached. For ex vivo imaging, the complete lungs were inflated with 500 μl d-luciferin (7.5 mg) by inserting a catheter (22-gauge) into the trachea, after which the tissue was isolated and immediately placed in the flow chamber to perform a scan. The BL images were processed using the Living Image software (version 4.5.4; PerkinElmer, Hopkinton, MA, USA). A circular region of interest (ROI) covering the complete lung area was used to measure the total photon flux.
Magnetic resonance imaging.
MR images were acquired on a 9.4T BioSpec small-animal MRI scanner (20-cm horizontal bore size; Bruker BioSpin, Ettlingen, Germany) using a gradient insert (maximal field strength, 1,200 milliteslas [mT]/m) and a 3.5-cm quadrature resonator. Body temperature and breathing rate were continuously monitored and kept at physiological values during the scans by using a physiological monitoring system (SAII, Stony Brook, NY, USA). A three-dimensional (3D) prospectively respiratory gated ultrashort-echo-time (UTE) pulse sequence was used with following parameters: 0.03-ms echo time (TE), 15-ms repetition time (TR), 5° flip angle (FA), 3.5-cm isotropic field of view (FOV), 128 by 128 by 128 matrix, 273-μm isotropic resolution, and a total acquisition time of 18 min (8).
The acquired MR images were analyzed using an in-house-written MeVisLab module (version 2.6.1; MeVisLab Medical Solutions and Fraunhofer MEVIS, Bremen, Germany). The lung tissue volume was quantified based on a volume of interest (VOI) covering the complete lung by manually delineating a ROI on each image slice, excluding the heart and main pulmonary vessels. Based on the receiver gain value of an individual scan, a variable threshold was used to select all voxels with a signal intensity above this threshold. Furthermore, a cumulative image score was determined to semiquantitatively describe lesion development and progression by applying a previously described scoring system (8).
Fungal load quantification.
After the last imaging time point, all animals were euthanized by an overdose of pentobarbital (Nembutal; CEVA Santé Animale, Diegem, Belgium). After performing ex vivo BLI, the right lung lobes were removed for fungal load quantification by CFU counting. The lungs were weighed and homogenized in 600 μl phosphate-buffered saline (PBS). Fivefold dilution series were prepared and plated on Sabouraud agar, followed by 3 days incubation at 30°C and manual counting of CFU (35).
Histological analysis.
The left lung lobe was isolated, postfixed (24 h in 10% formalin), and embedded in paraffin. The entire lung was sectioned (5 μm) and stained with periodic acid-Schiff (PAS), staining fungi in red (36).
Statistics.
The data were analyzed using Prism (version 5.04; GraphPad software, San Diego, CA). Repeated-measures analysis of variance (ANOVA) with a Tukey's posttest were used to investigate changes in total photon flux (BLI), lung tissue volume, and cumulative image score (MRI) over time in the nontreated high-inoculum group. Linear regression analysis was performed to assess the correlation between BLI- and MRI-derived biomarkers. Student's t test was used to evaluate differences in total photon flux (ex vivo BLI) and CFU counts between the treated and nontreated groups. Differences were considered statistically significant if P value was <0.05. In all figures, the data are represented as mean ± standard deviation (SD).
ACKNOWLEDGMENTS
This work was supported by funding provided by the Flemish Research Foundation (FWO; grants G.0691.15N and 1506114N) and KU Leuven IF and BOF (grants CREA/14/015, STG/15/024, and C24/17/061). J.P. and B.H. received a Ph.D. grant for strategic basic research from the Agency for Innovation by Science and Technology (IWT). L.V. is a SB Ph.D. fellow at FWO. The work of M.B. was supported by the Transregio 124 FungiNet project A3 from the German Science Foundation (DFG). G.V.V. received a postdoctoral fellowship from the FWO.
Use of the bioluminescent Aspergillus fumigatus 2/7/1 strain was granted by the Leibniz Institute for Natural Product Research and Infection Biology (Hans Knöll Institute, Jena, Germany). All preclinical imaging was performed at the Molecular Small Animal Imaging Centre of KU Leuven.
REFERENCES
- 1.Pasqualotto AC. 2010. Aspergillosis: from diagnosis to prevention, 1st ed Springer, Dordrecht, The Netherlands. [Google Scholar]
- 2.Pagano L, Caira M, Candoni A, Offidani M, Martino B, Specchia G, Pastore D, Stanzani M, Cattaneo C, Fanci R, Caramatti C, Rossini F, Luppi M, Potenza L, Ferrara F, Mitra ME, Fadda RM, Invernizzi R, Aloisi T, Picardi M, Bonini A, Vacca A, Chierichini A, Melillo L, de Waure C, Fianchi L, Riva M, Leone G, Aversa F, Nosari A. 2010. Invasive aspergillosis in patients with acute myeloid leukemia: a SEIFEM-2008 registry study. Haematologica 95:644–650. doi: 10.3324/haematol.2009.012054. [DOI] [PMC free article] [PubMed] [Google Scholar]
- 3.Feldmesser M. 2006. Role of neutrophils in invasive aspergillosis. Infect Immun 74:6514–6516. doi: 10.1128/IAI.01551-06. [DOI] [PMC free article] [PubMed] [Google Scholar]
- 4.Silveira F, Paterson DL. 2005. Pulmonary fungal infections. Curr Opin Pulm Med 11:242–246. doi: 10.1097/01.mcp.0000159832.20648.70. [DOI] [PubMed] [Google Scholar]
- 5.Smith JA, Kauffman CA. 2012. Pulmonary fungal infections. Respirology 17:913–926. doi: 10.1111/j.1440-1843.2012.02150.x. [DOI] [PubMed] [Google Scholar]
- 6.Walsh TJ, Anaissie EJ, Denning DW, Herbrecht R, Kontoyiannis DP, Marr KA, Morrison VA, Segal BH, Steinbach WJ, Stevens DA, van Burik JA, Wingard JR, Patterson TF, Infectious Diseases Society of America . 2008. Treatment of aspergillosis: clinical practice guidelines of the Infectious Diseases Society of America. Clin Infect Dis 46:327–360. doi: 10.1086/525258. [DOI] [PubMed] [Google Scholar]
- 7.Patterson TF, Thompson GR III, Denning DW, Fishman JA, Hadley S, Herbrecht R, Kontoyiannis DP, Marr KA, Morrison VA, Nguyen MH, Segal BH, Steinbach WJ, Stevens DA, Walsh TJ, Wingard JR, Young JA, Bennett JE. 2016. Practice guidelines for the diagnosis and management of aspergillosis: 2016 update by the Infectious Diseases Society of America. Clin Infect Dis 63:e1–e60. doi: 10.1093/cid/ciw326. [DOI] [PMC free article] [PubMed] [Google Scholar]
- 8.Poelmans J, Hillen A, Vanherp L, Govaerts K, Maertens J, Dresselaers T, Himmelreich U, Lagrou K, Vande Velde G. 2016. Longitudinal, in vivo assessment of invasive pulmonary aspergillosis in mice by computed tomography and magnetic resonance imaging. Lab Invest 96:692–704. doi: 10.1038/labinvest.2016.45. [DOI] [PubMed] [Google Scholar]
- 9.Gammon ST, Foje N, Brewer EM, Owers E, Downs CA, Budde MD, Leevy WM, Helms MN. 2014. Preclinical anatomical, molecular, and functional imaging of the lung with multiple modalities. Am J Physiol Lung Cell Mol Physiol 306:L897–L914. doi: 10.1152/ajplung.00007.2014. [DOI] [PubMed] [Google Scholar]
- 10.Brock M, Jouvion G, Droin-Bergere S, Dussurget O, Nicola MA, Ibrahim-Granet O. 2008. Bioluminescent Aspergillus fumigatus, a new tool for drug efficiency testing and in vivo monitoring of invasive aspergillosis. Appl Environ Microbiol 74:7023–7035. doi: 10.1128/AEM.01288-08. [DOI] [PMC free article] [PubMed] [Google Scholar]
- 11.Demidova TN, Gad F, Zahra T, Francis KP, Hamblin MR. 2005. Monitoring photodynamic therapy of localized infections by bioluminescence imaging of genetically engineered bacteria. J Photochem Photobiol B 81:15–25. doi: 10.1016/j.jphotobiol.2005.05.007. [DOI] [PMC free article] [PubMed] [Google Scholar]
- 12.Lu Z, Dai T, Huang L, Kurup DB, Tegos GP, Jahnke A, Wharton T, Hamblin MR. 2010. Photodynamic therapy with a cationic functionalized fullerene rescues mice from fatal wound infections. Nanomedicine (Lond) 5:1525–1533. doi: 10.2217/nnm.10.98. [DOI] [PMC free article] [PubMed] [Google Scholar]
- 13.Engelsman AF, van Dam GM, van der Mei HC, Busscher HJ, Ploeg RJ. 2010. In vivo evaluation of bacterial infection involving morphologically different surgical meshes. Ann Surg 251:133–137. doi: 10.1097/SLA.0b013e3181b61d9a. [DOI] [PubMed] [Google Scholar]
- 14.Francis KP, Yu J, Bellinger-Kawahara C, Joh D, Hawkinson MJ, Xiao G, Purchio TF, Caparon MG, Lipsitch M, Contag PR. 2001. Visualizing pneumococcal infections in the lungs of live mice using bioluminescent Streptococcus pneumoniae transformed with a novel Gram-positive lux transposon. Infect Immun 69:3350–3358. doi: 10.1128/IAI.69.5.3350-3358.2001. [DOI] [PMC free article] [PubMed] [Google Scholar]
- 15.Smith MW, Schmidt JE, Rehg JE, Orihuela CJ, McCullers JA. 2007. Induction of pro- and anti-inflammatory molecules in a mouse model of pneumococcal pneumonia after influenza. Comp Med 57:82–89. [PMC free article] [PubMed] [Google Scholar]
- 16.Hertlein T, Sturm V, Jakob P, Ohlsen K. 2013. 19F magnetic resonance imaging of perfluorocarbons for the evaluation of response to antibiotic therapy in a Staphylococcus aureus infection model. PLoS One 8:e64440. doi: 10.1371/journal.pone.0064440. [DOI] [PMC free article] [PubMed] [Google Scholar]
- 17.Luker KE, Hutchens M, Schultz T, Pekosz A, Luker GD. 2005. Bioluminescence imaging of vaccinia virus: effects of interferon on viral replication and spread. Virology 341:284–300. doi: 10.1016/j.virol.2005.06.049. [DOI] [PubMed] [Google Scholar]
- 18.Luker GD, Prior JL, Song J, Pica CM, Leib DA. 2003. Bioluminescence imaging reveals systemic dissemination of herpes simplex virus type 1 in the absence of interferon receptors. J Virol 77:11082–11093. doi: 10.1128/JVI.77.20.11082-11093.2003. [DOI] [PMC free article] [PubMed] [Google Scholar]
- 19.Cook SH, Griffin DE. 2003. Luciferase imaging of a neurotropic viral infection in intact animals. J Virol 77:5333–5338. doi: 10.1128/JVI.77.9.5333-5338.2003. [DOI] [PMC free article] [PubMed] [Google Scholar]
- 20.Vieites JM, Navarro-Garcia F, Perez-Diaz R, Pla J, Nombela C. 1994. Expression and in vivo determination of firefly luciferase as gene reporter in Saccharomyces cerevisiae. Yeast 10:1321–1327. doi: 10.1002/yea.320101009. [DOI] [PubMed] [Google Scholar]
- 21.McNabb DS, Reed R, Marciniak RA. 2005. Dual luciferase assay system for rapid assessment of gene expression in Saccharomyces cerevisiae. Eukaryot Cell 4:1539–1549. doi: 10.1128/EC.4.9.1539-1549.2005. [DOI] [PMC free article] [PubMed] [Google Scholar]
- 22.Srikantha T, Chandrasekhar A, Soll DR. 1995. Functional analysis of the promoter of the phase-specific WH11 gene of Candida albicans. Mol Cell Biol 15:1797–1805. doi: 10.1128/MCB.15.3.1797. [DOI] [PMC free article] [PubMed] [Google Scholar]
- 23.Srikantha T, Klapach A, Lorenz WW, Tsai LK, Laughlin LA, Gorman JA, Soll DR. 1996. The sea pansy Renilla reniformis luciferase serves as a sensitive bioluminescent reporter for differential gene expression in Candida albicans. J Bacteriol 178:121–129. doi: 10.1128/jb.178.1.121-129.1996. [DOI] [PMC free article] [PubMed] [Google Scholar]
- 24.Nakayama H, Mio T, Nagahashi S, Kokado M, Arisawa M, Aoki Y. 2000. Tetracycline-regulatable system to tightly control gene expression in the pathogenic fungus Candida albicans. Infect Immun 68:6712–6719. doi: 10.1128/IAI.68.12.6712-6719.2000. [DOI] [PMC free article] [PubMed] [Google Scholar]
- 25.Enjalbert B, Rachini A, Vediyappan G, Pietrella D, Spaccapelo R, Vecchiarelli A, Brown AJ, d'Enfert C. 2009. A multifunctional, synthetic Gaussia princeps luciferase reporter for live imaging of Candida albicans infections. Infect Immun 77:4847–4858. doi: 10.1128/IAI.00223-09. [DOI] [PMC free article] [PubMed] [Google Scholar]
- 26.Jacobsen ID, Luttich A, Kurzai O, Hube B, Brock M. 2014. In vivo imaging of disseminated murine Candida albicans infection reveals unexpected host sites of fungal persistence during antifungal therapy. J Antimicrob Chemother 69:2785–2796. doi: 10.1093/jac/dku198. [DOI] [PubMed] [Google Scholar]
- 27.Ibrahim-Granet O, Jouvion G, Hohl TM, Droin-Bergere S, Philippart F, Kim OY, Adib-Conquy M, Schwendener R, Cavaillon JM, Brock M. 2010. In vivo bioluminescence imaging and histopathopathologic analysis reveal distinct roles for resident and recruited immune effector cells in defense against invasive aspergillosis. BMC Microbiol 10:105. doi: 10.1186/1471-2180-10-105. [DOI] [PMC free article] [PubMed] [Google Scholar]
- 28.Galiger C, Brock M, Jouvion G, Savers A, Parlato M, Ibrahim-Granet O. 2013. Assessment of efficacy of antifungals against Aspergillus fumigatus: value of real-time bioluminescence imaging. Antimicrob Agents Chemother 57:3046–3059. doi: 10.1128/AAC.01660-12. [DOI] [PMC free article] [PubMed] [Google Scholar]
- 29.Dagenais TR, Keller NP. 2009. Pathogenesis of Aspergillus fumigatus in invasive aspergillosis. Clin Microbiol Rev 22:447–465. doi: 10.1128/CMR.00055-08. [DOI] [PMC free article] [PubMed] [Google Scholar]
- 30.Huyan XH, Lin YP, Gao T, Chen RY, Fan YM. 2011. Immunosuppressive effect of cyclophosphamide on white blood cells and lymphocyte subpopulations from peripheral blood of BALB/c mice. Int Immunopharmacol 11:1293–1297. doi: 10.1016/j.intimp.2011.04.011. [DOI] [PubMed] [Google Scholar]
- 31.Miceli MH, Maertens J, Buve K, Grazziutti M, Woods G, Rahman M, Barlogie B, Anaissie EJ. 2007. Immune reconstitution inflammatory syndrome in cancer patients with pulmonary aspergillosis recovering from neutropenia: proof of principle, description, and clinical and research implications. Cancer 110:112–120. doi: 10.1002/cncr.22738. [DOI] [PubMed] [Google Scholar]
- 32.Jung J, Hong HL, Lee SO, Choi SH, Kim YS, Woo JH, Kim SH. 2015. Immune reconstitution inflammatory syndrome in neutropenic patients with invasive pulmonary aspergillosis. J Infect 70:659–667. doi: 10.1016/j.jinf.2014.12.020. [DOI] [PubMed] [Google Scholar]
- 33.Caillot D, Couaillier JF, Bernard A, Casasnovas O, Denning DW, Mannone L, Lopez J, Couillault G, Piard F, Vagner O, Guy H. 2001. Increasing volume and changing characteristics of invasive pulmonary aspergillosis on sequential thoracic computed tomography scans in patients with neutropenia. J Clin Oncol 19:253–259. doi: 10.1200/JCO.2001.19.1.253. [DOI] [PubMed] [Google Scholar]
- 34.Sugar AM, Liu XP. 2000. Effect of grapefruit juice on serum voriconazole concentrations in the mouse. Med Mycol 38:209–212. doi: 10.1080/mmy.38.3.209.212. [DOI] [PubMed] [Google Scholar]
- 35.Gupta VK, Tuohy MG. 2013. Laboratory protocols in fungal biology: current methods in fungal biology. Springer, New York, NY. [Google Scholar]
- 36.Roden AC, Schuetz AN. 2017. Histopathology of fungal diseases of the lung. Semin Diagn Pathol 34:530–549. doi: 10.1053/j.semdp.2017.06.002. [DOI] [PubMed] [Google Scholar]


