

Abstract
This is the first sensory study to evaluate the effects of ethanol concentration on flavor perception of distilled spirits. Dilution series of two rums (R1 and R2) were evaluated to gain insight into the effects of ethanol concentration on the flavor perception of distilled spirits. Rums were diluted 1:2 (v/v) either with pure water to a final alcohol by volume (ABV) of 20% (R1‐W and R2‐W) or with an aqueous 40% ABV solution (R1‐E and R2‐E). The later dilution accounted for the flavor dilution effect while keeping the ethanol concentration the same as the original liquors. Descriptive sensory analysis was conducted on both dilution series and the original rums. Twenty‐three attributes were evaluated consisting of eight aroma, four aroma‐by‐mouth, four mouthfeel, two taste, and five aftertaste terms. Results revealed 18 significant attributes for the R1 series. With the exception of silky mouthfeel, all attributes were rated highest in R1 and lowest in R1‐E. The R2 series contained sixteen significant attributes, all of which were rated higher in R2 compared with R2‐E. The flavor profiles of the original rums and those diluted with water were very similar, with the diluted rums generally having slightly lower attribute intensities. In contrast, the rums diluted with 40% ABV had significantly different flavor profiles than the original rums. Results indicate that diluting spirits with water may reduce the odor suppression effects of ethanol or enhance flavor release which appears to counteract the flavor dilution effect.
Keywords: alcoholic beverage, descriptive analysis, ethanol, flavor, rum
1. INTRODUCTION
Ethanol is arguably the most important component of alcoholic beverages, particularly distilled spirits. Alcoholic beverages span a wide range of alcohol concentrations from beers (3%–10% ABV) to distilled spirits (usually 40% ABV). Furthermore, ethanol concentration plays an important role in the flavor perception of alcoholic beverages. Molecular interactions, flavor partitioning, and sensory perceptions have all been shown to be affected by ethanol concentration.
In terms of the physicochemical properties of ethanol, the water–ethanol structure greatly changes as the system goes from 100% aqueous to 100% ethanolic (Cipiciani, Onori, & Savelli, 1988; Conner, Birkmyre, Paterson, & Piggott, 1998; D'Angelo, Onori, & Santucci, 1994a,b; Franks & Ives, 1966; Onori & Santucci, 1996; Parke & Birch, 1999; Petrillo, Onori, & Sacchetti, 1989; Wakisaka, Komatsu, & Usui, 2001). In 100% aqueous systems, the water molecules exist in short‐range hydrogen‐bonded structures that are highly fluid, continuously breaking and reforming hydrogen bonds (Franks & Ives, 1966). As the ethanol concentration initially increases, the ethanol molecules are monodispersed within the aqueous matrix (D'Angelo et al., 1994a,b; Conner et al., 1998). This behavior continues until the ethanol concentration reaches approximately 15% alcohol by volume (ABV). Above this concentration, ethanol molecules begin to form aggregates or micelles (Cipiciani et al., 1988; D'Angelo et al., 1994a,b; Onori & Santucci, 1996). Once the solution reaches an ethanol concentration of 57% ABV, a final structural shift in the water/ethanol matrix occurs where the water molecules become monodispersed within the ethanolic matrix (D'Angelo et al., 1994a,b).
Previous research on how ethanol concentration affects aroma and sensory perception in alcoholic beverages has mainly approached the problem from an analytical perspective. Additionally, studies have mainly focused on how ethanol affects the headspace concentration of volatiles in static systems. As the ethanol concentration of solutions increases, the headspace concentration has been shown to decrease (Athès, Pena‐Lillo, Bernard, Perez‐Correa, & Souchon, 2004; Aznar, Tsachaki, Linforth, Ferreira, & Taylor, 2004; Boothroyd, Linforth, & Cook, 2012; Conner et al., 1998; Escalona‐Buendia, Piggott, Conner, & Paterson, 1998; Tsachaki, Aznar, Linforth, & Taylor, 2006). The decrease in headspace concentration is typically attributed to an increase in the solubility of aroma compounds as the ethanol concentration increases. Ickes and Cadwallader (2017a, b) reviewed the current research on ethanol's effects on flavor perception, and their paper provides a more detailed evaluation of the analytical research that has been performed to date.
Overall, sensory research exploring the effects of ethanol concentration on the perception of alcoholic beverages is lacking. The majority of studies have evaluated ethanol's effect on wine or wine model systems (Escudero, Campo, Fariña, Cacho, & Ferreira, 2007; Goldner, Zamora, Di Leo, Gianninoto, & Bandoni, 2009; Guth, 1998; Jones, Gawel, Francis, & Waters, 2008; King, Dunn, & Heymann, 2013; Le Berre, Atanasova, Langlois, Etiévant, & Thomas‐Danguin, 2007). While these studies demonstrate that ethanol concentration can impact flavor perception, the alcohol content of wine is very different from that of distilled spirits.
To date, the only sensory study to include distilled spirits was carried out in the 1970s by Williams (1972). Williams dealcoholized five different alcoholic beverages and observed the sensory changed compared with the original beverage. The study showed that de‐ethanolized whiskey was perceived as drier and had less bite than the full alcohol whiskey. Aside from this work, no sensory research has been conducted to provide insights into how ethanol's concentration may affect flavor perception during the consumption of distilled spirits.
While some consumers will only drink distilled spirits neat, others typically dilute their drink before consumption. A common practice is to consume spirits on the rocks, where the ice both cools and dilutes the beverage. Some people insist that a small splash of water is needed to open up the flavor. Still others state that distilled spirits need to be diluted to ~23% ABV to get the best flavor perception of the beverage. This has been the traditional practice in the whiskey industry for years, and a common reason given for this practice is to reduce the pungency of the alcohol (Smith & Roskrow, 2012).
Descriptive analysis (DA) panels allow researchers to identify and quantitate the sensory differences between products (Lawless & Heymann, 1999a; Meilgaard, Civille, & Carr, 2007; Stone & Sidel, 1993). Panelists develop terms, corresponding definitions and references for the sensory attributes they perceive in the product for the modalities of aroma, aroma‐by‐mouth, taste, mouthfeel, and aftertaste. Panelists rate the determined references and then use those as anchor points on the scale when evaluating the samples. Panelist finally rates the product in individual booths for all the attributes that were previously identified. The collected data are then subjected to statistical analysis to evaluate the samples using methods such as analysis of variance and principle component analysis.
The goal of this study was to evaluate using a descriptive sensory analysis the effects of ethanol concentration on the perceived sensory attributes of distilled spirits (rum) by comparing the original rums to those diluted 1:2 (v/v) with water or 1:2 (v/v) with aqueous 40% ethanol. The 1:2 (v/v) dilution with water dilutes both the congeners and ethanol strength while the 1:2 dilution with 40% ethanol dilutes only the congeners without changing the strength of the ethanol. The different dilutions allow the changes that may be attributed to the change in ethanol concentration versus the change in congener concentration to be assessed. It was hypothesized that changes in ethanol concentration would significantly affect the perceived sensory attributes, especially the aroma, of the rums, causing the dilutions to have significantly different profiles from the original full strength rum.
2. MATERIALS AND METHODS
2.1. Sample Selection
Two commercially available rums, Diplomatica Reserva Exclusiva (Destilería Unidas S.A., Venezuela) and Ron Abuelo: Añejo 7 years (Varela Hermanos, Panama), designated as rum 1 (R1) and rum 2 (R2), respectively, were purchased at a local liquor store (Champaign, IL). Both rums had a reported ethanol concentration of 40% alcohol by volume (ABV). Mention of the brand name of these rums does not imply any research contact or sponsorship and is not for advertisement or endorsement purposes.
2.2. Sample and Sensory Reference Preparation
Two dilutions of each rum were prepared, a 1:2 (v/v) dilution with pure water (Ice Mountain 100% Natural Spring Water, Nestlé Waters North America, Stamford, CT) (R1‐W and R2‐W), and a 1:2 (v/v) dilution with 40% ethanol (R1‐E and R2‐E). The 40% ethanol solution was prepared by diluting 190 proof (95% ABV) ethanol (USP Grade, Decon Labs, Inc., King of Prussia, PA) with pure water. Prior to testing (no more than 1 hr), 20 mL of each sample was measured into a black‐tinted double old‐fashion glass (Threshold, Target, USA) and the glass covered with a glass petri dish.
Attribute references were prepared daily and placed into 2 or 4 oz. lidded plastic soufflé cups (Dart Container Corporation, Mason, MI) and labeled with the reference identity. References were prepared fresh (no more than 24 hr) prior to evaluation. A complete list of attributes, definitions, references, reference scores, and preparation procedures is shown in Table 1.
Table 1.
List of final attributes, definitions, references, reference scores, and reference preparations determined for the descriptive analysis panel on ethanol's effect on the flavor perception of rums
| Modality | Attribute | Definition | Reference | Reference Score | Preparation |
|---|---|---|---|---|---|
| Aroma | Alcohol | Aroma associated with ethanol | 71 proof alcohol (Decon Labs, Inc.; King of Prussia, PA) | 11.5 | 10 oz. of (125 mL water + 75 ml 190 alcohol) in 2 oz. cup |
| Caramel | Aroma of caramelized sugar | Caramel syrup (The J.M. Smucker Company; Orrville, OH) | 12.5 | 2 g in 2 oz. cup | |
| Dark fruit | Aroma associated with dried dark fruits | Prunes (Sunsweet Growers Inc.; Yuba City, CA) | 14 | 0.4 g (~1/8) prune in a 2 oz. cup | |
| Maple | Aroma of maple syrup | Maple extract (McCormick & Co., Inc.; Hunt Valley, MD) | 13.5 | one teaspoon in 500 mL volumetric flask, dilute to volume, 10 mL in 2 oz. cup | |
| Roasted | Aroma of medium roasted malted barley | Brown‐roasted barley (The Country Malt Group; Castleford, West Yorkshire, UK) | 15 | 0.2 g in a 2 oz. cup | |
| Toasted | A browned sweet aroma associated with toasted marshmallow | Toasted marshmallow (Jet Puffed, Kraft Foods Group; Northfield, IL) | 13 | preheat boiler in oven, cut marshmallow in 1/8's, toast for 30 seconds and place 1/8 marshmallow in 4 oz. cup | |
| Vanilla | Aroma of natural vanilla extract | Natural vanilla extract (McCormick & Co., Inc.; Hunt Valley, MD) | 11 | 1/4 teaspoon in 500 mL volumetric flask, dilute to volume, 10 mL in 2 oz. cup | |
| Woody | Aroma of a wood barrel | Oak wood chips (LD Carlson Company; Kent, OH) | 10 | 0.5 g in 2 oz. cup | |
| Mouthfeel | Astringent | A drying sensation in the mouth associated with a high tannin wine | Overbrewed green tea (Lipton, Unilever; Englewood Cliffs, NJ) | 12 | steep one tea bag in 300 mL of boiling water for 5 min, place ~15 mL in a 2 oz cup |
| Silky | An uninhibited flow of liquid over the tongue, with a smooth feeling in the mouth | Almond milk (Silk, WhiteWave Foods; Broomfield, CO) | 13 | ~15 mL in a 2 oz. cup | |
| Slick | A smooth tongue coating | Glycerin (Heritage Store; Virginia Beach, VA) | 13.5 | 20 g of glycerin + 60 g water, ~10 g in a 2 oz. cup | |
| Warming | The increase in temperature perception in the mouth as a result of alcohol concentration | 71 proof alcohol (Decon Labs, Inc.; King of Prussia, PA) | 14 | 10 oz. of (125 mL water + 75 ml 190 alcohol) in 2 oz. cup | |
| Taste | Bitter | Taste associated with a caffeine solution | Caffeine solution (Fisher Scientific; Fair Lawn, NJ) | 12.5 | 1 g caffeine in 500 mL of hot water, stir until dissolved, ~15 mL in each cup |
| Sweet | Taste associated with a sucrose solution | Cane sugar solution (C&H, Domino Foods, Inc.; Yonkers, NY) | 11.5 | 4 g in 200 mL of water, stir, ~15 mL per cup | |
| Aroma‐by‐mouth | Alcohol | Aroma‐by‐mouth associated with 40% or greater alcohol | 71 proof alcohol (Decon Labs, Inc.; King of Prussia, PA) | 14.5 | 10 oz. of (125 mL water + 75 ml 190 alcohol) in 2 oz. cup |
| Caramel | Aroma‐by‐mouth of caramelized sugar | Caramel syrup (The J.M. Smucker Company; Orrville, OH) | 10.5 | caramel solution, 10 g of caramel dissolved in 200 mL of water, ~10 mL in a 2 oz. cup. Make daily | |
| Maple | Aroma‐by‐mouth of maple syrup | Maple extract (McCormick & Co., Inc.; Hunt Valley, MD) | 12 | one teaspoon in 500‐mL volumetric flask, dilute to volume, 10 mL in 2 oz. cup | |
| Vanilla | Aroma‐by‐mouth of natural vanilla extract | Natural vanilla extract (McCormick & Co., Inc.; Hunt Valley, MD) | 12.5 | 1/4 teaspoon in 500‐mL volumetric flask, dilute to volume, 10 mL in 2 oz. cup | |
| Woody | Aroma‐by‐mouth of a woody barrel | Oak wood chips (LD Carlson Company; Kent, OH) | 10.5 | 0.5 g in 2 oz. cup | |
| Aftertaste | Bitter | Aftertaste associated with a caffeine solution | Caffeine solution (Fisher Scientific; Fair Lawn, NJ) | 12.5 | 1 g caffeine in 500 mL of hot water, stir until dissolved, ~15 mL in each cup |
| Brown spice | Aftertaste associated with brown spices such as clove, and nutmeg | Ground nutmeg (McCormick & Co., Inc.; Hunt Valley, MD) | 10 | 1 g in 600 mL of water, stir 5 min, filter, 10 mL in 2 oz. cup | |
| Plastic | Aftertaste associated with PVC plastic | Vinyl shower curtain (Maytex Mills, Inc.; China) | 11 | 1 in × 1 in piece, place on tongue | |
| Vanilla | Aftertaste associated with natural vanilla extract | Natural vanilla extract (McCormick & Co., Inc.; Hunt Valley, MD) | 10 | 1/4 teaspoon in 500‐mL volumetric flask, dilute to volume, 10 mL in 2 oz. cup |
2.3. Panelists
All materials related to panelist recruitment and test design were approved by the Institutional Review Board (IRB) at the University of Illinois Urbana‐Champaign (IRB Protocol Number: 16854). Eight panelists, (four men and four women, age range 23–66 years) participated in the descriptive analysis panel. Panelists were selected based on interest, sensory acuity, and availability. Panelists were University of Illinois Students and members of the local community who all had 20 + hr of previous sensory training with distilled spirits. Panelists were also required to present a valid form of identification at the screening to verify that they were over 21 years of age.
2.4. Test design
A hybrid of Qualitative Descriptive Analysis® (Stone, 1992) and the Spectrum™ method (Meilgaard et al., 2007; Muñoz & Civille, 1992) was used (Ickes & Cadwallader, 2017a). Two rums were evaluated as a dilution series. At each session, panelists received one dilution series consisting of three samples: straight rum, a 1:2 dilution with 40% ABV ethanol, and a 1:2 dilution with water (e.g., R1, R1‐E and R1‐W, respectively). On the first day of the panel, the panelists were refreshed about the DA method to be used in the study. The first four sessions (1 hr each) consisted of term and reference generation, followed by reference refinement. Panelists were presented with a dilution series of samples labeled with random three‐digit codes and asked to generate the attributes they perceived in the rum samples for aroma, aroma‐by‐mouth, mouthfeel, taste, and aftertaste modalities. Panelists were provided with a rum flavor wheel (Ickes, Lee, & Cadwallader, 2017) to aid in term generation. Through group discussion, panelists identified the terms to be used, developed a precise definition of each attribute, and determined a corresponding reference.
After the terms and references were established, panelists then spent two sessions (1 hr each) determining the reference intensities of each attribute. Panelists were asked to scale the references based on a 15 point scale, where zero is no perception of a given attribute and 15 is the strongest perception of that attribute in the rum samples. Panelists then spent 6 days (1 hr each) practicing scoring the rums, using the references as anchor points for the scale to aid in panel uniformity. On one of the days, panelists conducted individual booth practice sessions in Bevier Hall on the University of Illinois at Urbana‐Champaign campus for one 30‐min session using the Compusense five (Version 5.0: Guelph ON, Canada) data acquisition system. Panelists were routinely provided with their scoring results from the previous day to help identify and correct for attributes they were rating inconsistently with the rest of the group.
The panel concluded with 2 days of individual booth testing. Panelists attended two 30‐min sessions per day, evaluating one dilution series of three samples at each session. Testing took place in a room with partitioned booths maintained at 22°C. Rum samples were presented in black‐tinted double old‐fashion glasses covered with glass petri dishes and labeled with random three‐digit codes. Sample presentation was randomized among all panelists. Samples were evaluated under red lighting to mask the color differences between the dilutions. Compusense five software was used to record panelists’ responses. Panelists were provided with a reference tray when they arrived and encouraged to evaluate all references before proceeding into the booth for testing. Panelists were free to leave the booth at any time to re‐evaluate a reference.
2.5. Statistical analysis
Statistical analysis of the data was performed using Statistical Analysis System (SAS)® (Version 9.4, SAS Institute Inc., Cary, NC, USA). Analysis of variance (ANOVA) was conducted on each of the 23 attributes evaluated during the DA panel to determine the presence of overall significant differences (p < .05) using the PROC GLM function for variations within the dilutions, panelists, replications, and their corresponding interactions: dilution by panelist (D × P), dilution by replication (D × R), and replications by panelist (R × P). Each rum dilution series was analyzed separately. The calculated probabilities were compared with significance levels α = .05, .01, and .001. When significant D × P interactions existed, adjusted F‐ratios were calculated using Microsoft® Excel® 2016 (Version 16: Microsoft Corporation, Redmond, WA) by dividing the dilution mean square by the D × P interaction mean square and calculating the new probability using the F.DIST function. Fisher's least significant difference (LSD) test was conducted on all attributes determined as significant by ANOVA.
Principle component analysis (PCA) biplots were produced using SAS and Microsoft Excel to create a visual representation of the data to allow further examination of the relationship of the rums to individual attributes that characterized the samples. Pearson correlations were calculated using the same SAS software, with significance determined at α = .05, .01, and .001.
3. RESULTS AND DISCUSSION
This is the first sensory study to examine the effects of ethanol concentration on flavor perception in distilled beverages. Sensory descriptive analysis was performed to characterize the effect of ethanol concentration on flavor perception. A series of three samples was evaluated for each rum consisting of the straight rum (directly from the bottle, 40% ABV), a 1:2 (v/v) dilution with water (creating a 20% AVB sample) to mimic how samples are routinely evaluated in industry, and a 1:2 (v/v) dilution with 40% ethanol to account for the flavor dilution effect while allowing alcohol concentration to remain constant. Two different rums were evaluated to assess whether the effects were sample specific or possibly applicable to a wider range of distilled spirits. Additionally, samples were evaluated in black glasses and under red lights to reduce any bias that might be caused by differences in color between the dilutions.
The panelists generated 23 attributes to describe the two different dilution series. The generated terms, term definitions, selected references, reference scores, and reference preparations are shown in Table 1. Reference scores are an average of individual panelist's ratings. All panelists had previous training evaluating the sensory properties of distilled beverages.
Analysis of variance (ANOVA) was conducted on the dilution series for each rum (R1 and R2) separately for all 23 attributes identified and rated by the panelists. The results are shown in Tables 2 and 3. In general, sample replication was not a significant source of error (p > .05) for either the R1 dilution series (except silky mouthfeel and sweet taste) or the R2 dilution series (except toasted aroma, woody aroma, sweet taste, and plastic aftertaste). This lack of variation shows the panelists were able to rate the sample attributes across replications consistently.
Table 2.
Analysis of variance (ANOVA) F‐ratios for sensory attributes rated for dilutions of rum 1a
| Modality | Attribute | Dilution | Panelist | Rep | D × Pb | D × Rb | R × Pb | Adjusted Sample F |
|---|---|---|---|---|---|---|---|---|
| Aroma | Alcohol | 8.54** | 2.16 | 0.12 | 0.81 | 1.33 | 0.12 | |
| Caramel | 5.67* | 4.18* | 0.14 | 1.37 | 3.26 | 0.79 | ||
| Maple | 4.51* | 11.48*** | 0.21 | 1.48 | 2.91 | 1.23 | ||
| Vanilla | 5.64* | 5.43** | 0.5 | 1.19 | 1.51 | 0.7 | ||
| Dark Fruit | 1.26 | 8.29*** | 0.07 | 0.82 | 0.38 | 0.53 | ||
| Roasted | 6.32* | 8.15*** | 0.07 | 0.71 | 0.46 | 1.19 | ||
| Toasted | 2.88 | 2.87* | 0.03 | 0.59 | 0.52 | 0.97 | ||
| Woody | 8.15** | 6.46** | 3.02 | 1.49 | 2.77 | 1.62 | ||
| Mouthfeel | Astringent | 22.04*** | 5.59** | 0.64 | 0.82 | 0.28 | 1.53 | |
| Silky | 22.41*** | 6.62** | 6.67* | 3.94** | 2.43 | 0.73 | 5.69* | |
| Slick | 14.6*** | 3.81* | 0.97 | 1.81 | 0.11 | 2.1 | ||
| Warming | 24.47*** | 3.09* | 0.27 | 0.62 | 0.12 | 0.37 | ||
| Taste | Bitter | 20.56*** | 5.9** | 2.6 | 1.23 | 0.87 | 1.72 | |
| Sweet | 5.31* | 11.47*** | 5.3* | 4.67** | 1.68 | 2.69 | 1.14 | |
| Aftertaste | Bitter | 21.35*** | 7.62*** | 1.75 | 0.69 | 1.19 | 0.19 | |
| Brown Spice | 11.1** | 6.32** | 0 | 0.9 | 0.54 | 1.05 | ||
| Vanilla | 2.3 | 3.47* | 0.1 | 1.02 | 0.44 | 1.01 | 1.69 | |
| Plastic | 7.22** | 3.06* | 1.56 | 4.28** | 0.48 | 2.56 | ||
| Aroma‐by‐mouth | Alcohol | 36.25*** | 2.81* | 0.06 | 0.93 | 0.36 | 0.35 | |
| Caramel | 7.43** | 3.09* | 0.04 | 0.48 | 0.61 | 1.29 | ||
| Maple | 4.65* | 2.88* | 2.19 | 0.53 | 0.49 | 0.52 | ||
| Vanilla | 3.79* | 5.47** | 1.51 | 1.59 | 1.92 | 0.59 | ||
| Woody | 4.47* | 3.29* | 4.18 | 0.72 | 0.17 | 0.25 |
*, **, *** stand for significance at p < .05, p < .01, and p < .001, respectively.
F‐ratios are shown as a source of variation.
D × P, R × P, and D × R represent the interaction between dilution samples and panelists, replications, and panelists, and dilution samples and replications, respectively.
Table 3.
Analysis of variance (ANOVA) F‐ratios for sensory attributes rated for dilutions of rum 2a
| Modality | Attribute | Dilution | Panelist | Rep | D × Pb | D × Rb | R × Pb | Adjusted sample F |
|---|---|---|---|---|---|---|---|---|
| Aroma | Alcohol | 40.85*** | 8.71*** | 0.23 | 2.03 | 1.22 | 2.37 | |
| Caramel | 5.94* | 11.54*** | 0.81 | 1.20 | 0.15 | 1.08 | ||
| Maple | 3.66 | 8.94*** | 1.06 | 0.94 | 0.67 | 2.30 | ||
| Vanilla | 5.36* | 8.96*** | 2.64 | 1.37 | 1.48 | 1.10 | ||
| Dark Fruit | 3.98* | 12.04*** | 0.16 | 1.48 | 0.66 | 0.80 | ||
| Roasted | 2.38 | 4.15* | 0.52 | 1.42 | 0.51 | 1.68 | ||
| Toasted | 0.72 | 15.38*** | 5.56*** | 4.18** | 1.17 | 1.58 | 0.17 | |
| Woody | 0.18 | 9.18*** | 4.61*** | 1.94 | 0.08 | 1.89 | ||
| Mouthfeel | Astringent | 15.17*** | 15.17*** | 0.24 | 1.56 | 0.47 | 2.18 | |
| Silky | 10.09*** | 6.85*** | 1.04 | 3.19*** | 2.01 | 1.18 | 3.17 | |
| Slick | 20.36*** | 7.36*** | 0.51 | 2.96* | 4.44* | 2.68 | 6.87** | |
| Warming | 59.21*** | 11.57*** | 0.06 | 1.17 | 1.20 | 3.02*** | ||
| Taste | Bitter | 49.87*** | 13.75*** | 0.08 | 0.78 | 0.84 | 6.62*** | |
| Sweet | 3.60 | 7.58*** | 6.62* | 3.26* | 1.00 | 4.73** | 1.11 | |
| Aftertaste | Bitter | 29.14*** | 11.98*** | 2.28 | 1.11 | 0.77 | 2.30 | |
| Brown Spice | 11.79** | 5.91** | 2.51 | 1.53 | 0.01 | 1.25 | ||
| Vanilla | 5.62* | 11.8*** | 0.34 | 1.80 | 0.26 | 1.28 | ||
| Plastic | 4.34* | 12.72*** | 6.42* | 2.23 | 3.26 | 3.38* | ||
| Aroma‐by‐mouth | Alcohol | 47.80*** | 7.54*** | 2.29 | 0.57 | 1.37 | 0.66 | |
| Caramel | 16.90*** | 9.47*** | 0.01 | 2.08 | 1.50 | 0.37 | ||
| Maple | 26.65*** | 17.89*** | 1.18 | 3.41* | 0.68 | 3.72* | 7.81** | |
| Vanilla | 23.49*** | 33.16*** | 1.20 | 2.58* | 0.93 | 1.57 | 9.10** | |
| Woody | 1.56 | 13.48*** | 0.38 | 1.77 | 0.43 | 0.78 |
*, **, *** stand for significance at p < .05, p < .01, and p < .001, respectively.
F‐ratios are shown as a source of variation.
D × P, R × P, and D × R represent the interaction between dilution samples and panelists, replications and panelists, and dilution samples and replications, respectively.
Significant panelist variation did exist (p < .05) for all attributes for the R1 dilution series (except alcohol aroma) and R2 dilution series. This type of variation is typical of descriptive analysis panels and is most likely a result of panelists not using the entire scale or using different parts of the scale to rate the samples (Lawless & Heymann, 1999a, b; Stone, Sidel, Oliver, Woolsey, & Singleton, 1974). R × P interactions were not significant (p > .05) for any attributes in the R1 series nor for most attributes in the R2 series, with the exception of warming mouthfeel, bitter taste, sweet taste, plastic aftertaste, and maple aroma‐by‐mouth. The lack of interaction indicates that panelists were able to agree on the intensity of the attributes in the samples across replications. There were no D × R effects in either series (except for slick mouthfeel in R2 series) indicating that panelists rated the samples similarly across replications.
Significant D × P interactions (p < .05) did exist for the R1 series (except for silky mouthfeel, sweet taste, and vanilla aftertaste) and the R2 series (except for toasted aroma, silky mouthfeel, slick mouthfeel, sweet taste, maple aroma‐by‐mouth, and vanilla aroma‐by‐mouth). These interactions indicate that panelists were not able to agree on the order of the intensity of the attributes across samples. Adjusted F‐vales were calculated for attributes that had significant D × R interactions to account for the variation. The adjusted F‐values are shown in Tables 2 and 3. Based on the adjusted F‐values and initial F‐values for the dilutions, eighteen of the attributes in the R1 series were determined to be significantly different (p < .05) including alcohol aroma, caramel aroma, maple aroma, vanilla aroma, roasted aroma, woody aroma, astringent mouthfeel, silky mouthfeel, slick mouthfeel, warming mouthfeel, bitter taste, bitter aftertaste, brown spice aftertaste, alcohol aroma‐by‐mouth, caramel aroma‐by‐mouth, maple aroma‐by‐mouth, vanilla aroma‐by‐mouth, and woody aroma‐by‐mouth. For the R2 dilution series, sixteen attributes were determined to be significantly different (p < .05) including alcohol aroma, caramel aroma, vanilla aroma, dark fruit aroma, astringent mouthfeel, slick mouthfeel, warming mouthfeel, bitter taste, bitter aftertaste, brown spice aftertaste, vanilla aftertaste, plastic aftertaste, alcohol aroma‐by‐mouth, caramel aroma‐by‐mouth, maple aroma‐by‐mouth, and vanilla aroma‐by‐mouth. Of the 23 attributes evaluated, all terms (except toasted aroma) were statistically different for at least one of the rum series, indicating that proper attributes were chosen for evaluation.
3.1. Effect of dilution on sensory profiles
The dilution of the rum samples, either with water or ethanol (40% ABV), caused significant changes to the sensory profiles of the rums. The results indicated that rum samples diluted with ethanol (R1‐E and R2‐E) had the lowest intensities for all attributes (except silky mouthfeel in the R1 series).
For the R1 dilution series, R1 was significantly different from R1‐E for all attributes, having higher intensities for all attributes except silky mouthfeel (Table 4). Additionally, the two dilutions, R1‐W and R1‐E, significantly differed from each other for most attributes, except for caramel aroma, maple aroma, vanilla aroma, maple aroma‐by‐mouth, and vanilla aroma‐by‐mouth. R1‐W had a higher intensity of all attributes except silky mouthfeel. R1 and R1‐W were not significantly different from each other except for caramel aroma, maple aroma, vanilla aroma, and brown spice aftertaste. Selected significant attribute correlations for the R1 dilution series samples (Table 5) include those between astringent mouthfeel and roasted aroma, warming mouthfeel, and alcohol aroma‐by‐mouth, and a significant negative correlation existed between silky mouthfeel and roasted aroma, astringent mouthfeel, warming mouthfeel, and alcohol aroma‐by‐mouth.
Table 4.
Mean intensity rating for significant aroma, mouthfeel, taste, aftertaste, and aroma‐by‐mouth attributes of the rum 1 dilution series
| Modality | Attributes | R1* | R1‐W* | R1‐E* |
|---|---|---|---|---|
| Aroma | Alcohol | 9.44A | 7.94A | 5.19B |
| Caramel | 10.25A | 8.31B | 7.56B | |
| Maple | 9.63A | 7.81B | 7.94B | |
| Vanilla | 10.56A | 8.44B | 8.50B | |
| Roasted | 5.00A | 4.88A | 3.19B | |
| Woody | 6.38A | 5.75A | 4.19B | |
| Mouthfeel | Astringent | 9.81A | 9.31A | 5.56B |
| Silky | 6.63B | 6.94B | 10.44A | |
| Slick | 8.13A | 7.00A | 4.56B | |
| Warming | 9.19A | 9.06A | 3.81B | |
| Taste | Bitter | 8.25A | 8.50A | 4.69B |
| Aftertaste | Bitter | 9.38A | 9.71A | 5.69B |
| Brown Spice | 8.38A | 7.00B | 5.38C | |
| Aroma‐by‐mouth | Alcohol | 10.06A | 9.50A | 3.81B |
| Caramel | 9.75A | 8.75A | 6.94B | |
| Maple | 8.75A | 7.56A,B | 6.44B | |
| Vanilla | 10.19A | 9.06A,B | 8.38B | |
| Woody | 6.63A | 6.75A | 4.75B |
Superscripts of the same letter within an attribute indicate no significant difference by Fisher's least significant difference (LSD) test at α = .05. “R1” is rum 1, “R1‐W” is 1:2 dilution of rum 1 with water to achieve 20% ABV, “R1‐E” is 1:2 dilution of rum 1 with 40% ethanol to achieve 40% ABV.
Table 5.
Pearson correlation coefficients for significant attributes for rum 1 dilution series samples
| Attributes | Alcohol A | Caramel A | Maple A | Vanilla A | Roasted A | Woody A | Astringent MF | Silky MF | Slick MF | Warming MF |
|---|---|---|---|---|---|---|---|---|---|---|
| Alcohol_A | 1.000 | |||||||||
| Caramel_A | 0.914 | 1.000 | ||||||||
| Maple_A | 0.728 | 0.944 | 1.000 | |||||||
| Vanilla_A | 0.754 | 0.956 | 0.999* | 1.000 | ||||||
| Roasted_A | 0.956 | 0.756 | 0.496 | 0.530 | 1.000 | |||||
| Woody_A | 0.997* | 0.882 | 0.676 | 0.705 | 0.975 | 1.000 | ||||
| Astringent_MF | 0.970 | 0.786 | 0.537 | 0.570 | 0.999* | 0.985 | 1.000 | |||
| Silky_MF | −0.960 | −0.765 | −0.508 | −0.541 | −1.000** | −0.978 | −0.999* | 1.000 | ||
| Slick_MF | 0.999* | 0.897 | 0.699 | 0.727 | 0.968 | 1.000* | 0.979 | −0.971 | 1.000 | |
| Warming_MF | 0.945 | 0.730 | 0.462 | 0.497 | 0.999* | 0.966 | 0.996* | −0.999* | 0.957 | 1.000 |
| Bitter_Ta | 0.915 | 0.673 | 0.390 | 0.426 | 0.993 | 0.942 | 0.986 | −0.991 | 0.931 | 0.997 |
| Bitter_AT | 0.909 | 0.662 | 0.376 | 0.412 | 0.991 | 0.937 | 0.984 | −0.989 | 0.925 | 0.995 |
| BrownSpice_AT | 0.993 | 0.956 | 0.806 | 0.828 | 0.914 | 0.981 | 0.932 | −0.919 | 0.987 | 0.898 |
| Alcohol_ABM | 0.963 | 0.770 | 0.515 | 0.548 | 1.000* | 0.980 | 1.000* | −1.000** | 0.973 | 0.998* |
| Caramel_ABM | 1.000** | 0.915 | 0.730 | 0.756 | 0.956 | 0.997 | 0.969 | −0.960 | 0.999* | 0.944 |
| Maple_ABM | 0.983 | 0.973 | 0.842 | 0.862 | 0.886 | 0.967 | 0.908 | −0.893 | 0.975 | 0.868 |
| Vanilla_ABM | 0.952 | 0.994 | 0.903 | 0.919 | 0.821 | 0.928 | 0.848 | −0.829 | 0.939 | 0.799 |
| Woody_ABM | 0.917 | 0.675 | 0.393 | 0.429 | 0.993 | 0.943 | 0.987 | −0.992 | 0.932 | 0.997* |
| Attributes | Bitter T | Bitter AT | Brown Spice AT | Alcohol ABM | Caramel ABM | Maple ABM | Vanilla ABM | Woody ABM |
|---|---|---|---|---|---|---|---|---|
| Alcohol_A | ||||||||
| Caramel_A | ||||||||
| Maple_A | ||||||||
| Vanilla_A | ||||||||
| Roasted_A | ||||||||
| Woody_A | ||||||||
| Astringent_MF | ||||||||
| Silky_MF | ||||||||
| Slick_MF | ||||||||
| Warming_MF | ||||||||
| Bitter_Ta | 1 | |||||||
| Bitter_AT | 1.000** | 1 | ||||||
| BrownSpice_AT | 0.85969 | 0.85177 | 1 | |||||
| Alcohol_ABM | 0.99025 | 0.988 | 0.92246 | 1 | ||||
| Caramel_ABM | 0.91416 | 0.90784 | 0.99296 | 0.96171 | 1 | |||
| Maple_ABM | 0.82546 | 0.81672 | 0.998* | 0.89604 | 0.98341 | 1 | ||
| Vanilla_ABM | 0.7486 | 0.73836 | 0.98224 | 0.83365 | 0.9531 | 0.99219 | 1 | |
| Woody_ABM | 1.000** | 1.000* | 0.86116 | 0.99065 | 0.91532 | 0.82708 | 0.7505 | 1 |
*, **, *** stand for significance at p < 0.05, p < 0.01, and p < 0.001, respectively.
“A” is aroma, “ABM” is aroma‐by‐mouth, “AT” is aftertaste, “MF” is mouthfeel, “Ta” is taste.
For the R2 dilution series, all attributes were rated higher in R2 compared with R2‐W and R2‐E (Table 6). In addition, all attributes were rated higher in R2‐E than in R2‐W, except for vanilla aroma, vanilla aftertaste, and plastic aftertaste. R2 and R2‐W were significantly different from each other for alcohol aroma, dark fruit aroma, astringent mouthfeel, caramel aroma‐by‐mouth, maple aroma‐by‐mouth, and vanilla aroma‐by‐mouth attributes. Selected significant attribute correlations for the R2 dilution series (Table 7) include those between: bite vs aftertaste, warming mouthfeel vs alcohol aroma‐by‐mouth, slick mouthfeel vs brown spice aftertaste, plastic aftertaste vs alcohol aroma‐by‐mouth, and astringent mouthfeel vs slick mouthfeel, bitter, brown spice, and plastic aftertaste, and alcohol and maple aroma‐by‐mouth.
Table 6.
Mean intensity rating for significant aroma, mouthfeel, taste, aftertaste, and aroma‐by‐mouth attributes for R2, R2‐W and R2‐E
| Modality | Attribute | R2* | R2‐W | R2‐E |
|---|---|---|---|---|
| Aroma | Alcohol | 9.63A | 7.94B | 4.88C |
| Caramel | 8.13A | 7.31A | 5.81B | |
| Vanilla | 8.44A | 7.50A,B | 6.19B | |
| Dark Fruit | 7.13A | 5.13B | 5.50B | |
| Mouthfeel | Astringent | 10.25A | 8.81B | 4.75C |
| Slick | 6.63A | 5.75A | 3.13B | |
| Warming | 9.63A | 9.06A | 3.63B | |
| Taste | Bitter | 9.06A | 8.38A | 4.13B |
| Aftertaste | Bitter | 10.25A | 9.06A | 6.00B |
| Brown Spice | 7.56A | 7.13A | 5.63B | |
| Vanilla | 7.06A | 6.25A,B | 5.31B | |
| Plastic | 4.94A | 4.50A,B | 3.44B | |
| Aroma‐by‐mouth | Alcohol | 10.81A | 9.38A | 3.94B |
| Caramel | 8.44A | 7.06B | 5.06C | |
| Maple | 8.06A | 7.19B | 5.38C | |
| Vanilla | 8.63A | 7.19B | 5.75C |
Superscripts of the same letter within an attribute indicate no significant difference by Fisher's least significant difference (LSD) test at α = .05.
“R2” is rum 2, “R2‐W” is 1:2 dilution of rum 2 with water to achieve 20% ABV, “R2‐E” is 1:2 dilution of rum 1 with 40% ethanol to achieve 40% ABV.
Table 7.
Pearson correlation coefficients for significant attributes for R2, R2‐W and R2‐E
| Attributes | Alcohol A | Caramel A | Vanilla A | Dark Fruit A | Astringent MF | Slick MF | Warming MF | Bitter T | Bitter AT | BrownSpice AT |
|---|---|---|---|---|---|---|---|---|---|---|
| Alcohol_A | 1.000 | |||||||||
| Caramel_A | 1.000** | 1.000 | ||||||||
| Vanilla_A | 0.998* | 0.997* | 1.000 | |||||||
| DarkFruit_A | 0.650 | 0.648 | 0.702 | 1.000 | ||||||
| Astringent_MF | 0.995 | 0.995 | 0.985 | 0.568 | 1.000 | |||||
| Slick_MF | 0.993 | 0.994 | 0.983 | 0.559 | 1.000** | 1.000 | ||||
| Warming_MF | 0.963 | 0.964 | 0.942 | 0.421 | 0.986 | 0.988 | 1.000 | |||
| Bitter_Ta | 0.973 | 0.974 | 0.955 | 0.459 | 0.992 | 0.993 | 0.999* | 1.000 | ||
| Bitter_AT | 0.996 | 0.997 | 0.988 | 0.584 | 1.000* | 1.000 | 0.982 | 0.989 | 1.000 | |
| BrownSpice_AT | 0.990 | 0.990 | 0.977 | 0.533 | 0.999* | 1.000* | 0.992 | 0.996 | 0.998* | 1.000 |
| Vanilla_AT | 0.993 | 0.992 | 0.999* | 0.738 | 0.975 | 0.972 | 0.923 | 0.938 | 0.979 | 0.965 |
| Plastic_AT | 0.998* | 0.998* | 0.990 | 0.596 | 0.999* | 0.999* | 0.979 | 0.987 | 1.000** | 0.997* |
| Alcohol_ABM | 0.987 | 0.988 | 0.974 | 0.520 | 0.998* | 0.999* | 0.994 | 0.997* | 0.997* | 1.000** |
| Caramel_ABM | 0.998* | 0.998* | 1.000** | 0.694 | 0.987 | 0.985 | 0.945 | 0.958 | 0.990 | 0.979 |
| Maple_ABM | 0.999* | 0.999* | 0.994 | 0.623 | 0.998* | 0.997 | 0.972 | 0.981 | 0.999* | 0.994 |
| Vanilla_ABM | 0.986 | 0.986 | 0.996 | 0.766 | 0.964 | 0.961 | 0.906 | 0.923 | 0.969 | 0.952 |
| Attributes | Vanilla AT | Plastic AT | Alcohol ABM | Caramel ABM | Maple ABM | Vanilla ABM |
|---|---|---|---|---|---|---|
| Alcohol_A | ||||||
| Caramel_A | ||||||
| Vanilla_A | ||||||
| DarkFruit_A | ||||||
| Astringent_MF | ||||||
| Slick_MF | ||||||
| Warming_MF | ||||||
| Bitter_Ta | ||||||
| Bitter_AT | ||||||
| BrownSpice_AT | ||||||
| Vanilla_AT | 1.000 | |||||
| Plastic_AT | 0.982 | 1.000 | ||||
| Alcohol_ABM | 0.960 | 0.996 | 1.000 | |||
| Caramel_ABM | 0.998* | 0.992 | 0.976 | 1.000 | ||
| Maple_ABM | 0.988 | 0.999* | 0.992 | 0.996 | 1.000 | |
| Vanilla_ABM | 0.999* | 0.973 | 0.948 | 0.994 | 0.980 | 1.000 |
*, **, *** stand for significance at p < .05, p < .01, and p < .001, respectively.
“A” is aroma, “ABM” is aroma‐by‐mouth, “AT” is aftertaste, “MF” is mouthfeel, “Ta” is taste.
Interestingly, rums diluted with water possessed nearly the same sensory profiles as the original rums, with only slightly lower intensities for most attributes as shown in the constructed spider plots (Figure 1). In contrast, the results indicate that dilution with 40% ABV profoundly changed the sensory profiles of the rums, especially for the R2 series.
Figure 1.

Spider plot of mean significant attribute intensities for (a) R1, R1‐W and R1‐E and (b) R2, R2‐W and R2‐E rum 1. “R1” is rum 1, “R1‐W” is 1:2 (v/v) dilution of rum 1 with water to achieve 20% ABV, “R1‐E” is 1:2 (v/v) dilution of rum 1 with 40% ethanol to achieve 40% ABV. “R2” is rum 2, “R2‐W” is 1:2 dilution (v/v) of rum 2 with water to achieve 20% ABV, “R2‐E” is 1:2 (v/v) dilution of rum 1 with 40% ethanol to achieve 40% ABV. “A” is aroma, “ABM” is aroma‐by‐mouth, “AT” is aftertaste, “MF” is mouthfeel, “Ta” is taste
Principal component analysis was conducted to reduce the complexity of the data and gain a better visual representation of the results as shown in Figures 2 and 3 (Lawless & Heymann, 1999a,b). The covariance matrix was chosen for sample evaluation as the rums and rum dilutions were scored by a trained panel (Jolliffe, 2014). For the R1 dilution series (Figure 3), the first factor (PC1) contained the majority of the variation between samples (88.4%) and the second factor (PC2) contained the remaining sample variation (11.6%). PC1 contrasts samples high in brown sugar, caramel, maple, vanilla, coconut and chocolate aroma, brown spice and caramel aftertaste, caramel, maple, vanilla and coconut aroma‐by‐mouth, with samples high in alcohol, citrus, and phenolic aroma, warming mouthfeel, and bitter taste. PC2 was mainly defined by slick mouthfeel.
Figure 2.

Principal component analysis biplot of significant attributes present on principle component 1 (PC1) and 2 (PC2) by the correlation matrix of mean significant attribute intensity rating across R1, R1‐W, and R1‐E. “R1” is rum 1, “R1‐W” is 1:2 (v/v) dilution of rum 1 with water to achieve 20% ABV, “R1‐E” is 1:2 (v/v) dilution of rum 1 with 40% ethanol to achieve 40% ABV. “A” is aroma, “ABM” is aroma‐by‐mouth, “AT” is aftertaste, “MF” is mouthfeel, “Ta” is taste
Figure 3.
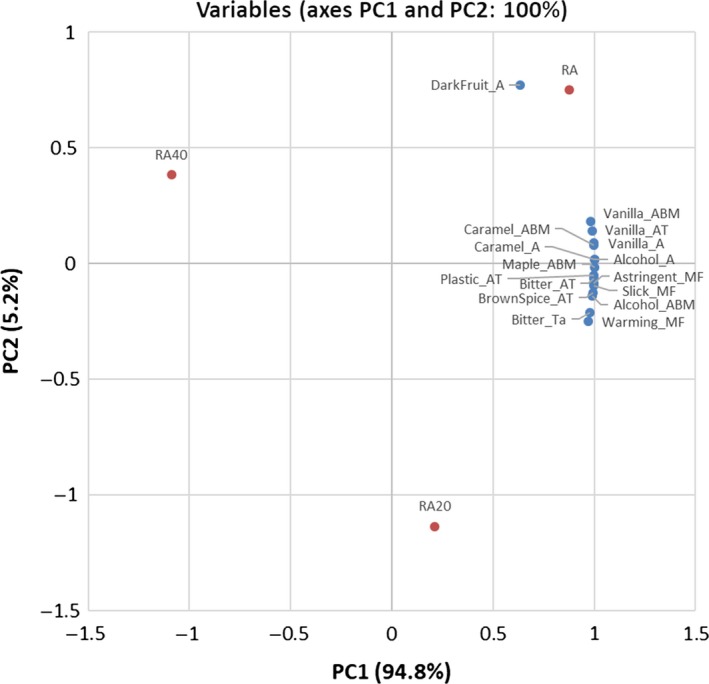
Principal component analysis biplot of significant attributes present on principle component 1 (PC1) and 2 (PC2) by the correlation matrix of mean significant attribute intensity rating across R2, R2‐W, and R2‐E. “R2” is rum 2, “R2‐W” is 1:2 (v/v) dilution of rum 2 with water to achieve 20% ABV, “R2‐E” is 1:2 (v/v) dilution of rum 1 with 40% ethanol to achieve 40% ABV. “A” is aroma, “ABM” is aroma‐by‐mouth, “AT” is aftertaste, “MF” is mouthfeel, “Ta” is taste
Focusing on the R2 dilution series (Figure 3) the first factor contained the majority of the variation as well (94.8%), with the second factor minimally loaded with the remaining variation (5.2%). PC1 contrasted samples that were high in all significant attributes with those that had lower intensities of those attributes. PC2 was defined by samples differentiated by dark fruit aroma.
These results validate the initial hypothesis that the dilution to a lower alcohol concentration would cause a decrease in attribute intensity, particularly regarding aroma. Previous analytical studies on dynamic systems showed that higher ethanol concentration had higher headspace concentrations of volatiles (Taylor et al., 2010; Tsachaki, Linforth, & Taylor, 2005; Tsachaki et al., 2008). In this study, all aroma attributes were highest in the original rums.
However, the size of the effect between dilutions was not as large as expected, especially since both the alcohol concentration and the flavor compound concentrations were cut in half in the case of R1‐W and R2‐W. No previous work related to the effects of ethanol on flavor perception has considered the dilution effect that occurs when a consumer dilutes the beverage with water. All previous studies have made replicate model solutions that are identical except for their alcohol concentration (Boothroyd et al., 2012; Tsachaki, Linforth, & Taylor, 2009; Tsachaki et al., 2005, 2006, 2008). Even studies that evaluated wine model systems at various ethanol concentrations spiked the solutions with the same concentration of volatiles after the ethanol dilutions were made (Tsachaki et al., 2009). It is likely that the decrease in ethanol concentration caused an increase in the polarity of the system. Additionally, the evaporation effect and subsequent stirring caused by the Marangoni effect and Rayleigh‐Bénard convection (Marangoni, 1865; Rayleigh, 1916) would still occur at 20% ABV, as it has been previously demonstrated in 12% ABV systems (Taylor et al., 2010), and this may explain why the aroma attribute intensities did not decrease as much as expected.
Alternatively, the similar aroma profiles observed between the straight rum and water dilution may be a result of reducing the suppressant effect of ethanol during dilution with water. Ethanol is known to have anesthetic qualities and stimulate trigeminal sensations (Taylor et al., 2010). It is possible that at high ethanol concentrations these qualities may suppress or mask the other odor‐active compounds in distilled beverages. When the ethanol concentration is reduced with water, the suppressant effect of ethanol as an antagonist may diminish. Therefore, in the water dilution, even though the concentration of the congeners is also reduced by half, the release of the suppressant effect of ethanol may compensate for the decrease in volatile concentration, resulting in a similar aroma profile. This is further demonstrated by the dilutions with ethanol. When the concentration and suppressant effects of ethanol were held constant and the concentration of the congeners was cut in half, we observed a significant decrease in the intensity of almost all attributes. More sensory studies are needed to confirm these results and gain a better understanding of how ethanol affects sensory perceptions at higher alcohol levels.
In mouth sensory perceptions, including mouthfeel and taste, also differed as a result of dilution. Regarding mouthfeel, the warming sensation was the same between the original rums and dilutions with water but significantly decreased in the ethanol dilution. This is surprising since previous research has demonstrated that increased ethanol concentration caused a higher rating of hotness or burning mouthfeel sensation (Demiglio & Pickering, 2008; Jones et al., 2008; Nolden & Hayes, 2015). It was expected that the ethanol dilutions would have had the highest warming sensation followed by the original rums and then the dilutions with water. It may be that ethanol, while one factor contributing to the warming sensation of spirits, may not be the only chemical contributing to that perception. These results are interesting as the ethanol used as the reference for warming mouthfeel was the same ethanol used to dilute the samples.
Additionally, previous research demonstrated that increased ethanol concentration causes a decrease in astringency (Demiglio & Pickering, 2008; Fontoin, Saucier, Teissedre, & Glories, 2008). In agreement, R1‐E and R2‐E had the lowest perception of astringency in both series. In the R2 series, the R2‐W was also significantly lower in astringency than R2. This difference could be attributed to the fact that previous studies focused on wines. The high concentration of tannins present in wines may alter the perception of astringency differently than distilled spirits, and in particular as function of ethanol concentration.
Bitter taste was also shown to be significantly lower for the ethanol dilutions in comparison with the original rums and water dilutions. Previous studies have shown increases in ethanol concentration can cause an increase in bitterness (Fontoin et al., 2008; Jones et al., 2008; Nolden & Hayes, 2015), which is contrary to our results. It is possible that other volatile and nonvolatile components dissolved in the rum matrix could account for these differences.
Sweetness was not shown to be significantly different among the rum dilutions; however, previous research has shown that sweetness perception increases with ethanol concentration in wines (Nurgel & Pickering, 2006; Zamora, Goldner, & Galmarini, 2006). It is possible that nonvolatile composition of the two beverages may affect how ethanol concentration impacts sweetness perception.
4. CONCLUSION
This was the first study to evaluate the sensory effects of ethanol on distilled spirits. Our results showed that the original rums and dilutions with water were more similar to one another than expected. The samples were only statistically different for several attributes in each series. These results support the age‐old industry tradition of diluting distilled spirits to 20% or 23% ABV for blending and evaluation purposes, and in essence demonstrating that while the intensity of the attributes decreased slightly in the dilutions, the overall flavor profiles were very similar. The results for the ethanol dilutions were not expected, and further research is needed to better understand how ethanol interacts with sensory perceptions at high ethanol concentrations.
ACKNOWLEDGMENTS
Partial support for this project was provided by the National Institute of Food and Agriculture, U.S. Department of Agriculture, under Project ILLU‐698‐366.
Ickes CM, Cadwallader KR. Effect of ethanol on flavor perception of Rum. Food Sci Nutr. 2018;6:912–924. https://doi.org/10.1002/fsn3.629
REFERENCES
- Athès, V. , Pena‐Lillo, M. , Bernard, C. , Perez‐Correa, R. , & Souchon, I. (2004). Comparison of experimental methods for measuring infinite dilution volatilities of aroma compounds in water/ethanol mixtures. Journal of Agriculture and Food Chemistry, 52, 2021–2027. https://doi.org/10.1021/jf0350257 [DOI] [PubMed] [Google Scholar]
- Aznar, M. , Tsachaki, M. , Linforth, R. S. T. , Ferreira, V. , & Taylor, A. J. (2004). Headspace analysis of volatile organic compounds from ethanolic systems by direct APCI‐MS. International Journal of Mass Spectrometry, 239, 17–25. https://doi.org/10.1016/j.ijms.2004.09.001 [Google Scholar]
- Boothroyd, E. L. , Linforth, R. S. T. , & Cook, D. J. (2012). Effects of ethanol and long‐chain ethyl ester concentrations on volatile partitioning in a whisky model system. Journal of Agriculture and Food Chemistry, 60, 9959–9966. https://doi.org/10.1021/jf3022892 [DOI] [PubMed] [Google Scholar]
- Cipiciani, A. , Onori, G. , & Savelli, G. (1988). Structural properties of water‐ethanol mixtures: A correlation with the formation of micellar aggregates. Chemical Physics Letters, 143, 505–509. https://doi.org/10.1016/0009-2614(88)87404-9 [Google Scholar]
- Conner, J. M. , Birkmyre, L. , Paterson, A. , & Piggott, J. R. (1998). Headspace concentrations of ethyl esters at different alcoholic strengths. Journal of the Science of Food and Agriculture, 77, 121–126. https://doi.org/10.1002/(ISSN)1097-0010 [Google Scholar]
- D'Angelo, M. , Onori, G. , & Santucci, A. (1994a). Self‐association of monohydric alcohols in water: Compressibility and infrared absorption measurements. J Chem Phys, 100, 3107–3113. https://doi.org/10.1063/1.466452 [Google Scholar]
- D'Angelo, M. , Onori, G. , & Santucci, A. (1994b). Self‐association behaviour of alcohols in diluted aqueous solutions. Nuovo Cim D, 16, 1499–1514. https://doi.org/10.1007/BF02462035 [Google Scholar]
- Demiglio, P. , & Pickering, G. J. (2008). The influence of ethanol and pH on the taste and mouthfeel sensations elicited by red wine. Journal of Food, Agriculture and Environment, 6, 143–150. [Google Scholar]
- Escalona‐Buendia, H. , Piggott, J. R. , Conner, J. M. , & Paterson, A. (1998). Effect of ethanol strength on the release of higher alcohols and aldehydes in model solutions In Contis E. T., Ho C. T., Mussinan C. J., Parliment T. H., Shaahidi F., & Spanier A. M. (Eds.), Developments in food science (pp. 615–620). Amsterdam: Elsevier Scientific. [Google Scholar]
- Escudero, A. , Campo, E. , Fariña, L. , Cacho, J. , & Ferreira, V. (2007). Analytical characterization of the aroma of five premium red wines. Insights into the role of odor families and the concept of fruitiness of wines. Journal of Agriculture and Food Chemistry, 55, 4501–4510. https://doi.org/10.1021/jf0636418 [DOI] [PubMed] [Google Scholar]
- Fontoin, H. , Saucier, C. , Teissedre, P. L. , & Glories, Y. (2008). Effect of pH, ethanol and acidity on astringency and bitterness of grape seed tannin oligomers in model wine solution. Food Quality and Preference, 19, 286–291. https://doi.org/10.1016/j.foodqual.2007.08.004 [Google Scholar]
- Franks, F. , & Ives, D. J. G . 1966. The structural properties of alcohol‐water mixtures. Quarterly Reviews of the Chemical Society, 20, 1–44. https://doi.org/10.1039/QR9662000001 [Google Scholar]
- Goldner, M. C. , Zamora, M. C. , Di Leo Lira, P. , Gianninoto, H. , & Bandoni, A. (2009). Effect of ethanol level in the perception of aroma attributes and the detection of volatile compounds in red wine. Journal of Sensory Studies, 24, 243–257. https://doi.org/10.1111/j.1745-459X.2009.00208.x [Google Scholar]
- Guth, H. (1998). Comparison of different white wine varieties in odor profiles by instrumental analysis and sensory studies In Waterhouse A. L., & Ebeler S. E. (Eds.), Chemistry of wine flavor (pp. 39–52). Washington, DC: American Chemical Society; https://doi.org/10.1021/symposium [Google Scholar]
- Ickes, C. M. , & Cadwallader, K. R. (2017a). Characterization of sensory differences in mixing and premium rums through the use of descriptive sensory analysis. Journal of Food Science, 82, 2679–2689. https://doi.org/10.1111/1750-3841.13936 [DOI] [PubMed] [Google Scholar]
- Ickes, C. M. , & Cadwallader, K. R. (2017b). Effects of ethanol on flavor perception in alcoholic beverages. Chemosensory Perception, 10, 119–134. https://doi.org/10.1007/s12078-017-9238-2 [Google Scholar]
- Ickes, C. M. , Lee, S.‐Y. , & Cadwallader, K. R. (2017). Novel creation of a rum flavor lexicon through the use of web‐based material. Journal of Food Science, 82, 1213–1223. [DOI] [PubMed] [Google Scholar]
- Jolliffe, I . (2014). Principal component analysis Wiley statsref: statistics reference online. p 1–5.
- Jones, P. R. , Gawel, R. , Francis, I. L. , & Waters, E. J. (2008). The influence of interactions between major white wine components on the aroma, flavour and texture of model white wine. Food Quality and Preference, 19, 596–607. https://doi.org/10.1016/j.foodqual.2008.03.005 [Google Scholar]
- King, E. S. , Dunn, R. L. , & Heymann, H. (2013). The influence of alcohol on the sensory perception of red wines. Food Quality and Preference, 28, 235–243. https://doi.org/10.1016/j.foodqual.2012.08.013 [Google Scholar]
- Lawless, H. T. , & Heymann, H . (1999a). Descriptive analysis In: Sensory evaluation of food: principles and practices (pp. 227–257). New York: Springer Science & Buiness Media, LLC. [Google Scholar]
- Lawless, H. T. , & Heymann, H . (1999b). Data relationships and multivariate applications In: Sensory evaluation of food: Principles and practices (pp. 585–601). New York: Springer Science+Business Media, LLC. [Google Scholar]
- Le Berre, E. , Atanasova, B. , Langlois, D. , Etiévant, P. , & Thomas‐Danguin, T. (2007). Impact of ethanol on the perception of wine odorant mixtures. Food Quality and Preference, 18, 901–908. https://doi.org/10.1016/j.foodqual.2007.02.004 [Google Scholar]
- Marangoni, C. (1865). On the expansion of a drop of liquid floating on the surface of another liquid. Pavia, Italy: University of Pavia. [Google Scholar]
- Meilgaard, M. , Civille, G. V. , & Carr, B. T. (2007). The spectrum descriptive analysis method Sensory evaluation techniques, 4th ed. (pp. 189–254). Boca Raton, FL: CRC Press/Taylor & Francis. [Google Scholar]
- Muñoz, A. M. , & Civille, G. V. (1992). The spectrum descriptive analysis method In Hootman R. C. (Ed.), Manual on descriptive analysis testing for sensory evaluation (pp. 22–34). Baltimore, MD: American Society for Testing and Materials. [Google Scholar]
- Nolden, A. A. , & Hayes, J. E. (2015). Perceptual qualities of ethanol depend on concentration, and variation in these percepts associates with drinking frequency. Chemosensory Perception, 8, 149–157. https://doi.org/10.1007/s12078-015-9196-5 [DOI] [PMC free article] [PubMed] [Google Scholar]
- Nurgel, C. , & Pickering, G. (2006). Modeling of sweet, bitter and irritant sensations and their interactions elicited by model ice wines. Journal of Sensory Studies, 21, 505–519. https://doi.org/10.1111/j.1745-459X.2006.00081.x [Google Scholar]
- Onori, G. , & Santucci, A. (1996). Dynamical and structural properties of water/alcohol mixtures. Journal of Molecular Liquids, 69, 161–181. https://doi.org/10.1016/S0167-7322(96)90012-4 [Google Scholar]
- Parke, S. A. , & Birch, G. G. (1999). Solution properties of ethanol in water. Food Chemistry, 67, 241–246. https://doi.org/10.1016/S0308-8146(99)00124-7 [Google Scholar]
- Petrillo, C. , Onori, G. , & Sacchetti, F. (1989). Hydration structure of ethanol water solution at low alcohol concentration. Molecular Physics, 67, 697–705. https://doi.org/10.1080/00268978900101381 [Google Scholar]
- Rayleigh, L . (1916). LIX. On convection currents in a horizontal layer of fluid, when the higher temperature is on the under side. Philos Mag Ser 6 32, 529–546. https://doi.org/10.1080/14786441608635602 [Google Scholar]
- Smith, G. D. , & Roskrow, D. (2012). Whiskeyopus. New York: DK Publishing. [Google Scholar]
- Stone, H. (1992). Quantitative descriptive analysis In Hootman R. C. (Ed.), Manual on descriptive analysis testing for sensory evaluation (pp. 15–21). Baltimore, MD: American Society for Testing and Materials; https://doi.org/10.1520/MNL13-EB [Google Scholar]
- Stone, H. , & Sidel, J. L. (1993). Descriptive analysis In Taylor S. L. (Ed.), Sensory evaluation practices, 2nd ed. (pp. 202–242). San Diego: Academic Press Inc; https://doi.org/10.1016/B978-0-12-672482-0.50013-7 [Google Scholar]
- Stone, H. , Sidel, J. L. , Oliver, S. , Woolsey, A. , & Singleton, R. (1974). Sensory evaluation by quantitative descriptive analysis. Food Science & Technology, 8, 24–32. [Google Scholar]
- Taylor, A. J. , Tsachaki, M. , Lopez, R. , Morris, C. , Ferreira, V. , & Wolf, B. (2010). Odorant release from alcoholic beverages. ACS Symposium Series, 1036, 161–175. [Google Scholar]
- Tsachaki, M. , Aznar, M. , Linforth, R. S. T. , & Taylor, A. J. (2006). Dynamics of flavour release from ethanolic solutions. Developments in Food Science, 43, 441–444. https://doi.org/10.1016/S0167-4501(06)80104-4 [Google Scholar]
- Tsachaki, M. , Gady, A. L. , Kalopesas, M. , Linforth, R. S. T. , Athès, V. , Marin, M. , & Taylor A. J. (2008). Effect of ethanol, temperature, and gas flow rate on volatile release from aqueous solutions under dynamic headspace dilution conditions. Journal of Agriculture and Food Chemistry, 56, 5308–5315. https://doi.org/10.1021/jf800225y [DOI] [PubMed] [Google Scholar]
- Tsachaki, M. , Linforth, R. S. T. , & Taylor, A. J. (2005). dynamic headspace analysis of the release of volatile organic compounds from ethanolic systems by direct APCI‐MS. Journal of Agriculture and Food Chemistry, 53, 8328–8333. https://doi.org/10.1021/jf051202n [DOI] [PubMed] [Google Scholar]
- Tsachaki, M. , Linforth, R. S. T. , & Taylor, A. J. (2009). Aroma release from wines under dynamic conditions. Journal of Agriculture and Food Chemistry, 57, 6976–6981. https://doi.org/10.1021/jf901174y [DOI] [PubMed] [Google Scholar]
- Wakisaka, A. , Komatsu, S. , & Usui, Y. (2001). Solute‐solvent and solvent‐solvent interactions evaluated through clusters isolated from solutions: Preferential solvation in water‐alcohol mixtures. Journal of Molecular Liquids, 90, 175–184. https://doi.org/10.1016/S0167-7322(01)00120-9 [Google Scholar]
- Williams, A. A. (1972). Flavour effects of ethanol in alcoholic beverages. Flavour Industry, 3, 604–607. [Google Scholar]
- Zamora, M. C. , Goldner, M. C. , & Galmarini, M. V. (2006). Sourness – sweetness interactions in different media: White wine, ethanol and water. Journal of Sensory Studies, 21, 601–611. https://doi.org/10.1111/j.1745-459X.2006.00085.x [Google Scholar]