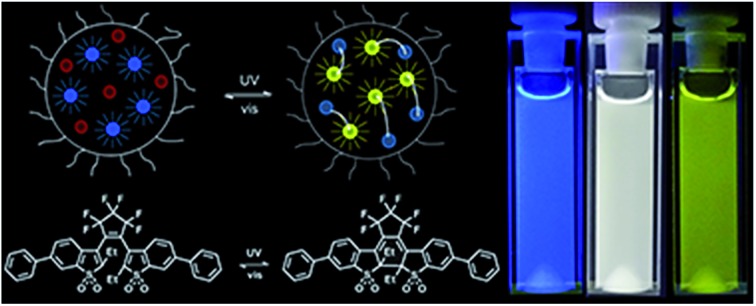
 An all-photonic FRET-based system with emission color reversibly changed from blue, via white, to yellow is devised.
Abstract
We encapsulate a fluorescent donor molecule and a photochromic acceptor unit (photoswitch) in polymer micelles and show that the color of the emitted fluorescence is continuously changed from blue to yellow upon light-induced isomerization of the acceptor. Interestingly, white-light generation is achieved in between. With the photoswitch in the colorless form, intense blue emission from the donor is observed, while UV-induced isomerization to the colored form induces an energy transfer reaction that quenches the donor emission and sensitizes the yellow emission from the colored photoswitch. The process is reversed by exposure to visible light, triggering isomerization to the colorless form.
Introduction
Molecular systems displaying stimuli-responsive emission color are attracting considerable attention, very often in the quest for white-light emitting materials.1–3 Emission color tuning and white-light generation (WLG) can be achieved by additive mixing, that is, combining two or more fluorophores in the correct proportion to generate the desired emission color.4–8 The major downside with this approach is that the addition of material requires physical access, preventing any kind of remote control of the color change. Moreover, the apparent simplicity of additive mixing using fluorescent molecular systems is misleading, as the resulting emission color is typically not the “sum” due to excited state communication between the fluorophores, e.g., energy transfer reactions. Several alternative strategies have therefore been devised and successfully demonstrated lately.9–28 One such approach is the use of molecular photoswitches (photochromic molecules), most often acting as acceptors in fluorescence resonance energy transfer (FRET) reactions together with a highly fluorescent donor chromophore.9,10,12,17,18,22,27–30 Due to the intrinsic ability of photoswitches to change color upon isomerization (both in absorption and emission),31 the FRET process and consequently, the overall emission color can be controlled by photonic means. Common downsides with the systems reported so far are: (i) very low fluorescence quantum yields of the photoswitch, resulting in a dramatically decreased emission intensity when the photoswitch is in the FRET-active fluorescent form; (ii) that the photoswitch cannot be fully converted to the respective isomeric form, limiting the extent of the emission color change; (iii) poor thermal stability of one of the isomeric forms, implying that the system will display emission color changes even in the absence of photoisomerization; and (iv) WLG is very rare.
Here, we present a self-assembled photochromic system where all the above mentioned downsides have been eliminated. We base the approach on 9,10-diphenylanthracene, DPA, as the FRET donor and a photochromic diarylethene derivative, DAE, as the acceptor photoswitch.
Results and discussion
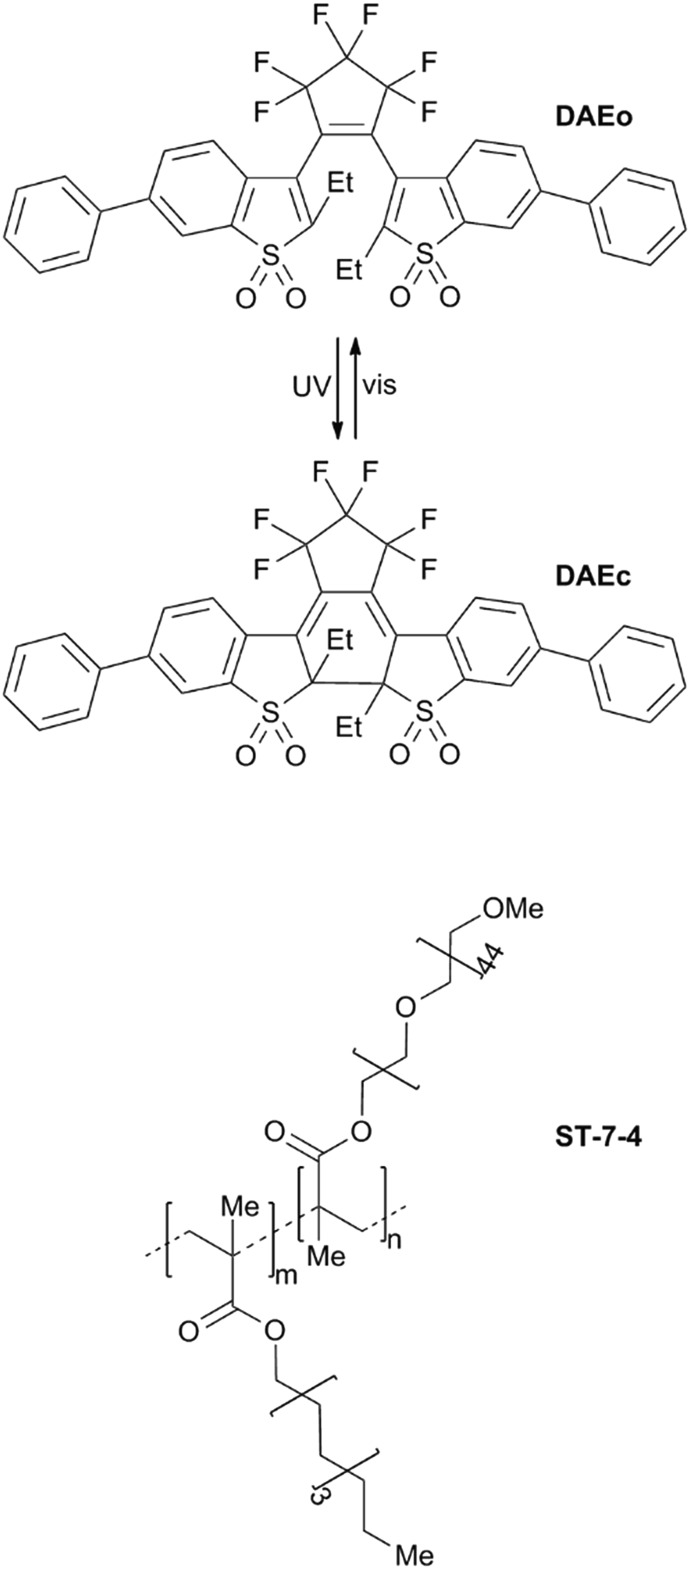
Scheme 1 shows the structures and the light-induced isomerizations of DAE. The open form (DAEo) is isomerized to the corresponding closed isomer (DAEc) by UV light exposure (365 nm used here, isomerization quantum yield = 0.42).32 The reverse reaction is triggered by visible light (523 nm used in this study, isomerization yield = 4.0 × 10⁻⁴).32 Both the UV- and the visible light-induced reactions enrich the sample to 100% of the respective isomeric form. The thermal reaction DAEc → DAEo is extremely slow (no absorption changes observed after 100 h at 80 °C.)32
Scheme 1. Isomerization scheme for the DAE derivative used in this study. Also shown is the structure of the ST-7-4 copolymer (m : n = 6 : 1).
DPA is a blue emitter with an emission spectrum centered between 400 nm and 450 nm and a fluorescent quantum yield of unity (see Fig. S1 in the ESI† for the spectra of all implicated species in acetonitrile). DAEo displays absorption only at wavelengths shorter than 400 nm. This implies that there is virtually no spectral overlap between DPA emission and DAEo absorption and, hence, that DAEo cannot quench the excited state of DPA by FRET. On the contrary, there is a substantial overlap between DPA emission and the absorption of DAEc. The R0-value for this FRET-pair in acetonitrile was determined to 52 Å, assuming κ2 = 2/3. The fluorescence of DAEc spans the wavelength region from 500 nm to 700 nm, with an emission maximum at 535 nm. The corresponding quantum yield was determined to be 0.75 in acetonitrile. This value is dramatically higher compared to all other photoswitches from the most common photochromic families, where the typical fluorescence quantum yields are below 0.05.33
From the above mentioned spectral features, we anticipated the following scenario upon UV-induced isomerization of DAEo to DAEc in the presence of DPA: with the photoswitch in the DAEo isomeric form, unquenched blue emission is observed from the DPA donor upon excitation. In the other extreme, UV induced isomerization DAEo → DAEc is extensive enough for DAEc to quench the excited DPA with unity efficiency, resulting in exclusively yellow emission from DAEc, sensitized in the FRET reaction. However, in all intermediate situations, that is, partial isomerization of DAEo to DAEc, the overall emission will be a mix between the blue emission from DPA and the yellow emission from DAEc. Here, the relative contributions depend on the degree of isomerization from DAEo to DAEc – the larger the isomerized fraction, the more yellow the emission appears.
Both DPA and DAE are essentially insoluble in water, but are effectively dissolved in the presence of the ST-7-4 copolymer34 in aqueous solution by encapsulation into polymer micelles. The structure of the copolymer is displayed in Scheme 1. This particular macromolecular construct incorporates hydrophobic decyl and hydrophilic oligo(ethylene glycol) side chains randomly distributed along a common poly(methacrylate) backbone. Such structural composition promotes the self-assembly of multiple macromolecules into single micelles in aqueous solution. The resulting supramolecular assemblies can encapsulate hydrophobic chromophores in their hydrophobic interior and force them to be in close proximity. As a result, this relatively simple and highly modular noncovalent strategy can be exploited to maintain the complementary components DPA and DAE at distances compatible with FRET without the need for the tedious synthetic procedures that would, otherwise, be required to constrain them covalently.35,36 From dynamic light scattering measurements, the average diameter of the micelles was determined to 15 nm. Compared to acetonitrile, both DPA and DAE retain their photophysical/spectral properties in the micelles, aside from a small overall bathochromic shift (see Fig. 1). Most importantly, the fluorescence quantum yields are not significantly affected, and the photochromic properties of the DAE photoswitch are preserved.
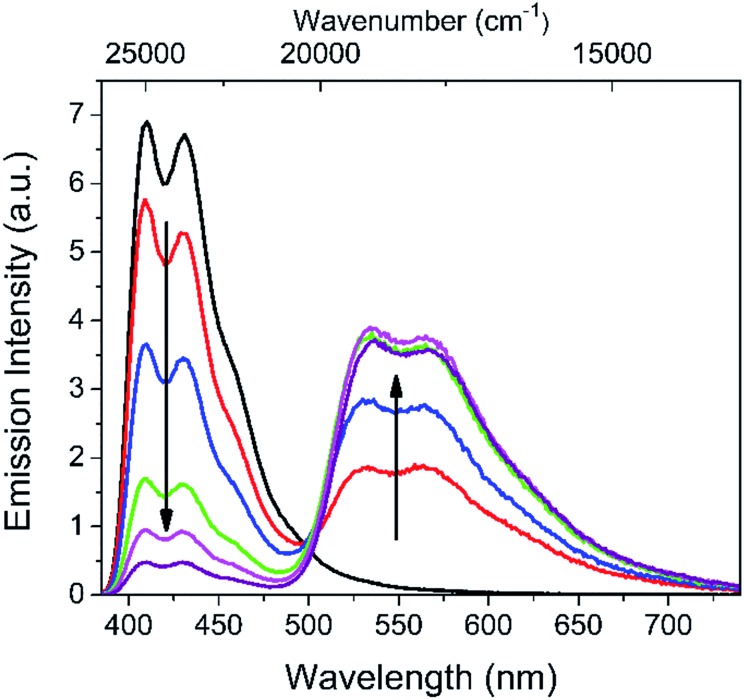
Fig. 1. Emission spectra (λexc = 375 nm) of a water dispersion of polymer micelles containing DPA (total concentration 3.5 μM) and DAE (total concentration 2 μM) at different degrees of UV-induced isomerization DAEo → DAEc (365 nm, 1.5 mW cm–2). The initial spectrum (black line) was excited at 415 nm to avoid any isomerization induced by the excitation light. The intensity was subsequently scaled to represent the corresponding intensity after excitation at 375 nm.
Fig. 1 shows the changes in the overall emission spectrum of a water dispersion of the polymer micelles (total micelle concentration ca. 1.35 μM) containing DPA (total concentration ca. 3.5 μM) and DAE (total concentration ca. 2 μM) upon gradual exposure to 365 nm UV light.37 It is obvious that the emission intensity of DAEc in the micellar “cocktail” does indeed increase with an increasing UV dose, at the expense of the DPA emission. It is also seen that the final DAEc population cannot quench DPA to 100%, as the emission intensity levels off at a non-zero value (see below for a comprehensive evaluation of the quenching efficiencies).
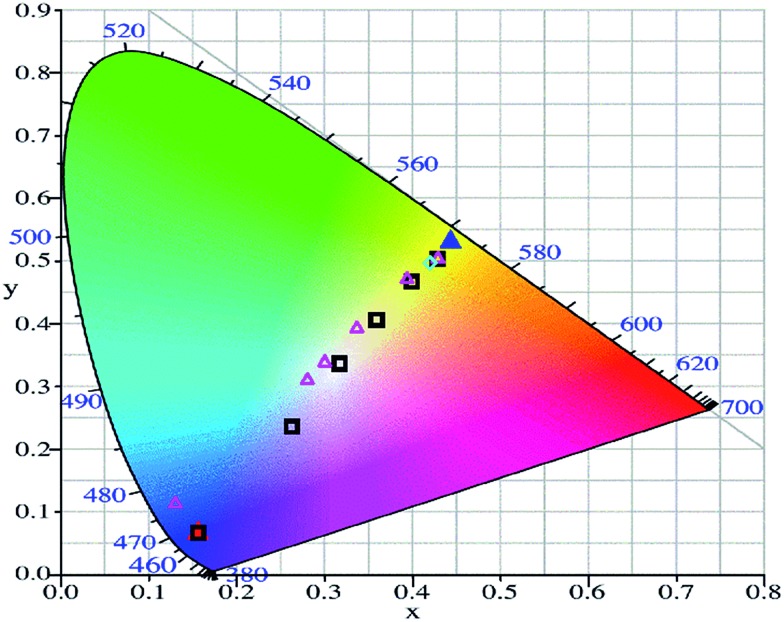
Judging from only the spectral evolution, the perceived color changes of the overall emission is by no means obvious. However, converting each spectrum to a CIE coordinate and mapping the coordinates in the corresponding CIE diagram are a straightforward means to depict the color changes. The result is shown in Fig. 2. Here it is seen that the emission color gradually changes from blue to yellow upon continuous UV-induced isomerization from DAEo to DAEc. In fact, the emission color of the cocktail virtually spans the entire region between what is observed for DPA alone and DAEc alone, which implies that the “dynamic range” of the color switching is close to being maximized.
Fig. 2. CIE diagram showing the trajectories of the color changes upon UV exposure (black hollow squares) and visible light exposure (magenta hollow triangles) of the micellar cocktail containing DPA and DAE. Also shown are the coordinates for DPA alone (red solid triangle), DAEc alone (blue solid triangle), and the cocktail after a second dose of UV light, again triggering isomerization to 100% DAEc (cyan hollow square).
Perfect white light corresponds to a CIE coordinate of (0.33, 0.33), and a common strategy of generating this type of light is to mix a blue emitter and a yellow emitter in adequate proportions. As mentioned above, this approach is “static”, in the sense that each system can only generate one emission color. Our approach, however, represents a means where one and the same cocktail of DPA and DAE can be used to generate emission colors from blue to yellow, and as we hit the coordinate (0.32, 0.33) along the way, we come very close to the generation of perfect white light. It is also very encouraging to see that the blue-to-yellow emission color change is reversible, by exposure to visible light (523 nm used here) that triggers the isomerization DAEc → DAEo. This process is illustrated in the CIE diagram in Fig. 2 by the magenta hollow triangles.38
Exposing the cocktail to another UV dose again shifts the CIE coordinate very close to that observed for DAEc (cyan hollow square in Fig. 2), proving that the emission color changes are indeed due to the reversible isomerization of the DAE photoswitch rather than the corresponding photodecomposition.
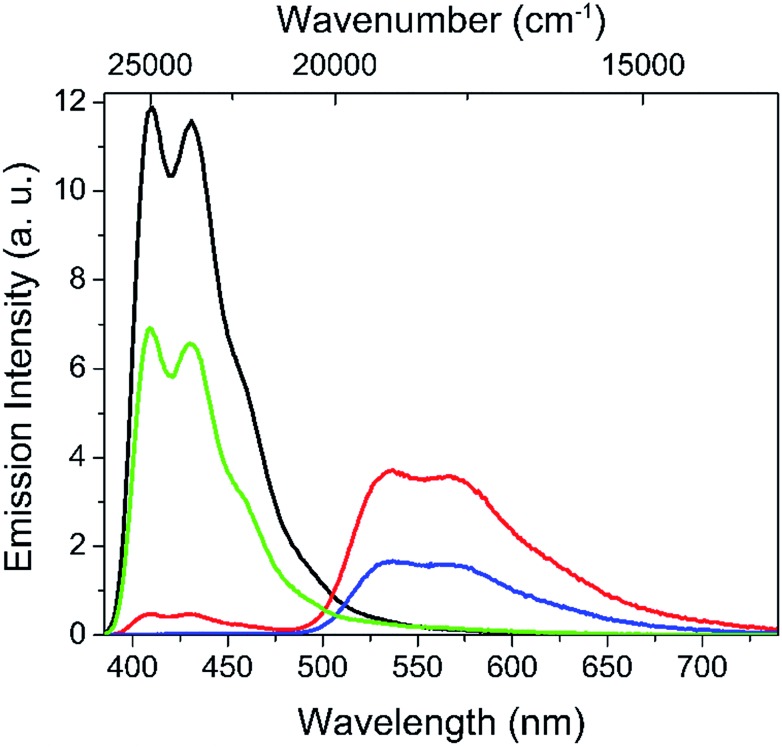
Fig. 3 compiles the spectra of the extreme situations (the cocktail with no isomerization and complete isomerization DAEo → DAEc) as well as the reference micelles with DPA and DAEc alone, each at the same concentration as in the cocktail. From this data, it is seen that the emission intensity of DPA is decreased by 43% and 96% with the cocktail in 100% DAEo and 100% DAEc, respectively. Hence, it is clear that DAEo is quenching DPA. As FRET quenching is excluded, likely explanations include the formation of a non-emissive ground state complex between DPA and DAEo (static quenching) or the introduction of dynamic quenching processes, e.g., photoinduced electron transfer (PET), a thermodynamically favorable process for this system (see ESI† for redox data). The results from time-resolved single photon counting (SPC) measurements are consistent with the latter, as the quenching is also reflected in the average fluorescence lifetime of DPA, decreasing from 7.5 ns to 4.2 ns by the introduction of DAEo. The formation of a non-emissive ground state complex would instead have no effect on the lifetime. It is also encouraging to note that the quenching efficiency judged by the decrease in the DPA average lifetime, 44%, agrees very well with the corresponding result from the steady-state emission measurements, 43%.
Fig. 3. Emission spectra of DPA alone (black line), DAEc alone (blue line), the cocktail DPA + DAEo (green line), and DPA + DAEc (red line), all in water dispersions of the polymer micelles. The concentration of the respective species was the same in all experiments (3.5 μM for DPA and 2 μM for DAE).
At the other extreme, where 100% of the DAE population is isomerized to DAEc, the overall emission from this species arises from direct excitation as well as sensitization via FRET from the excited state of DPA (DPA*). After compensation for the directly excited fraction (cf. blue line in Fig. 3) the FRET sensitization efficiency is estimated to 45%, that is, significantly lower than the corresponding quenching efficiency of DPA of 96%. Again, this discrepancy is ascribed to thermodynamically favorable PET processes originating from DPA*, rather than the corresponding processes from DAEc* (see below). The results from SPC agree well with the steady-state observations, as the quenching efficiency from the time-resolved data is determined to 91% (average DPA lifetime decreasing from 7.5 ns to 0.7 ns by the introduction of DAEc), which is close to the 96% from steady-state measurements. The subsequent decay of DAEc* is not affected by the presence of DPA (average lifetime of 2.5 ns for DAEc* alone and 2.5 ns in the cocktail). Hence, we can exclude PET processes contributing to the overall deactivation of DAEc*, fully consistent with the much less favorable driving force for these processes (see ESI† for a comprehensive evaluation of the SPC data and redox energies).
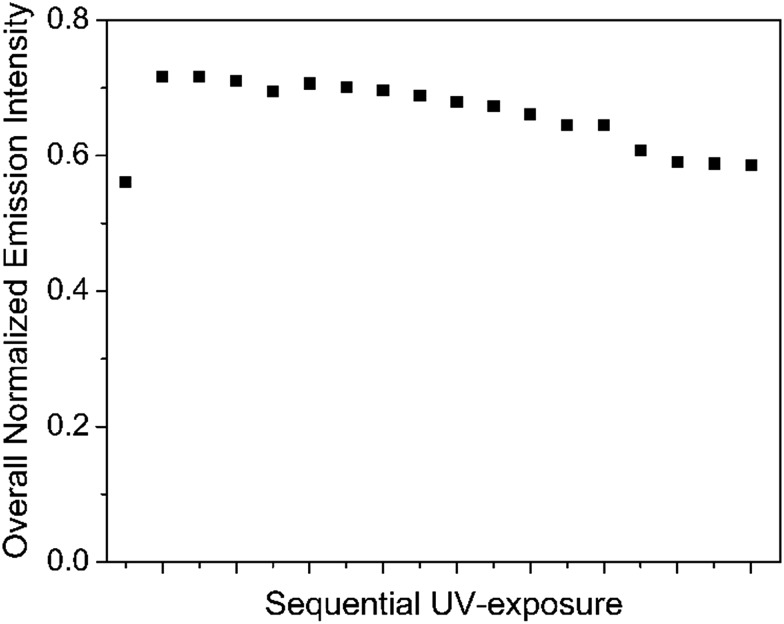
The variation of the overall emission intensity with increasing isomerization DAEo → DAEc is worth commenting on (see Fig. 4). Initially, the emission quantum yield is 0.57. Here, the emission is exclusively accounted for by the DPA fluorophore, quenched from the intrinsic quantum yield of unity by PET processes. Initial UV exposure results in a slight increase of the overall emission intensity. This is ascribed to activation of FRET sensitization, which in turn decreases the efficiency of non-radiative PET losses from DPA*. In addition, direct excitation of DAEc is also contributing to the increase. The subsequent minor decrease is explained by the onset of PET from DPA* to DAEc, competing with the FRET process.
Fig. 4. Variations of the overall emission intensity with increasing UV-induced isomerization DAEo → DAEc in the micellar cocktail. All emission spectra were converted to a wavenumber scale and intensity-corrected (I(wavenumber) = I(λ)λ2) before integration was performed.
Finally, choosing the DAE concentration implies a trade-off between the decreased overall emission intensity resulting from non-radiative losses from PET reactions, and maximizing the dynamic range of the CIE trajectory. At 2 μM DAE, the resulting initial emission intensity of DPA in the cocktail corresponds to a quantum yield of 0.57. We find this satisfactory, as it both allows for coverage of all emission colors between pure DPA and DAEc, as well as maintaining a relatively constant overall emission intensity irrespective of the degree of DAE isomerization.
Conclusions
We have presented a FRET-based self-assembled construct where the emission color is reversibly controlled by means of photonic stimuli. As the system exhibits the CIE coordinates (0.32, 0.33), we achieve virtually perfect white-light generation. Due to the strongly emissive nature of the photochromic acceptor, the resulting fluorescence output remains high throughout operation within the whole range of emission color.
Supplementary Material
Acknowledgments
This work was financed by the Swedish Research Council VR (grant 622-2010-280, JA), the National Science Foundation (CHE-1049860, FMR), and the Spanish Ministry of Economy and Competitiveness (MINECO Project CTQ2015-65439-R, JH and GG).
Footnotes
†Electronic supplementary information (ESI) available: Experimental section; absorption and emission spectra of DPA and DAE in acetonitrile; steady-state and SPC fluorescence measurements at varying concentrations; redox energies and driving forces for PET reactions; and simulations of the intermolecular donor–acceptor distances in the micelles. See DOI: 10.1039/c6sc01623e
References
- Li C. H., Liu S. Y. Chem. Commun. 2012;48:3262–3278. doi: 10.1039/c2cc17695e. [DOI] [PubMed] [Google Scholar]
- Mukherjee S., Thilagar P. Dyes Pigm. 2014;110:2–27. [Google Scholar]
- Praveen V. K., Ranjith C., Armaroli N. Angew. Chem., Int. Ed. 2014;53:365–368. doi: 10.1002/anie.201306787. [DOI] [PubMed] [Google Scholar]
- Hudson Z. M., Lunn D. J., Winnik M. A., Manners I. Nat. Commun. 2014;5:3372. doi: 10.1038/ncomms4372. [DOI] [PubMed] [Google Scholar]
- Jiang K., Sun S., Zhang L., Lu Y., Wu A. G., Cai C. Z., Lin H. W. Angew. Chem., Int. Ed. 2015;54:5360–5363. doi: 10.1002/anie.201501193. [DOI] [PubMed] [Google Scholar]
- Kim J. H., An B. K., Yoon S. J., Park S. K., Kwon J. E., Lim C. K., Park S. Y. Adv. Funct. Mater. 2014;24:2746–2753. [Google Scholar]
- Kwon J. E., Park S., Park S. Y. J. Am. Chem. Soc. 2013;135:11239–11246. doi: 10.1021/ja404256s. [DOI] [PubMed] [Google Scholar]
- Wang R., Peng J., Qui F., Yang Y. L., Xie Z. Y. Chem. Commun. 2009:6723–6725. doi: 10.1039/b915378k. [DOI] [PubMed] [Google Scholar]
- Chen J., Zhang P. S., Fang G., Yi P. G., Zeng F., Wu S. Z. J. Phys. Chem. B. 2012;116:4354–4362. doi: 10.1021/jp2110659. [DOI] [PubMed] [Google Scholar]
- Cheng H. B., Zhang H. Y., Liu Y. J. Am. Chem. Soc. 2013;135:10190–10193. doi: 10.1021/ja4018804. [DOI] [PubMed] [Google Scholar]
- Coppo P., Duati M., Kozhevnikov V. N., Hofstraat J. W., De Cola L. Angew. Chem., Int. Ed. 2005;44:1806–1810. doi: 10.1002/anie.200461953. [DOI] [PubMed] [Google Scholar]
- Díaz S. A., Giordano L., Jovin T. M., Jares-Erijman E. A. Nano Lett. 2012;12:3537–3544. doi: 10.1021/nl301093s. [DOI] [PubMed] [Google Scholar]
- Feng H. T., Xiong J. B., Zheng Y. S., Pan B. A., Zhang C., Wang L., Xie Y. S. Chem. Mater. 2015;27:7812–7819. [Google Scholar]
- Jiang B. P., Guo D. S., Liu Y. C., Wang K. P., Liu Y. ACS Nano. 2014;8:1609–1618. doi: 10.1021/nn405923b. [DOI] [PubMed] [Google Scholar]
- Karpiuk J., Karolak E., Nowacki J. Phys. Chem. Chem. Phys. 2010;12:8804–8809. doi: 10.1039/b927232a. [DOI] [PubMed] [Google Scholar]
- Kim H. J., Whang D. R., Gierschner J., Lee C. H., Park S. Y. Angew. Chem., Int. Ed. 2015;54:4330–4333. doi: 10.1002/anie.201411568. [DOI] [PubMed] [Google Scholar]
- Kim S., Yoon S. J., Park S. Y. J. Am. Chem. Soc. 2012;134:12091–12097. doi: 10.1021/ja3027295. [DOI] [PubMed] [Google Scholar]
- Li C. H., Zhang Y. X., Hu J. M., Cheng J. J., Liu S. Y. Angew. Chem., Int. Ed. 2010;49:5120–5124. doi: 10.1002/anie.201002203. [DOI] [PubMed] [Google Scholar]
- Montalti M., Battistelli G., Cantelli A., Genovese D. Chem. Commun. 2014;50:5326–5329. doi: 10.1039/c3cc48464e. [DOI] [PubMed] [Google Scholar]
- Nano A., Gullo M. P., Ventura B., Armaroli N., Barbieri A., Ziessel R. Chem. Commun. 2015;51:3351–3354. doi: 10.1039/c4cc09832c. [DOI] [PubMed] [Google Scholar]
- Park S., Kwon J. E., Kim S. H., Seo J., Chung K., Park S. Y., Jang D. J., Medina B. M., Gierschner J., Park S. Y. J. Am. Chem. Soc. 2009;131:14043–14049. doi: 10.1021/ja902533f. [DOI] [PubMed] [Google Scholar]
- Qi Q. K., Qian J. Y., Ma S. Q., Xu B., Zhang S. X. A., Tian W. J. Chem.–Eur. J. 2015;21:1149–1155. doi: 10.1002/chem.201405426. [DOI] [PubMed] [Google Scholar]
- Sanju K. S., Neelakandan P. P., Ramaiah D. Chem. Commun. 2011;47:1288–1290. doi: 10.1039/c0cc04173d. [DOI] [PubMed] [Google Scholar]
- Shiraishi Y., Ichimura C., Sumiya S., Hirai T. Chem.–Eur. J. 2011;17:8324–8332. doi: 10.1002/chem.201101048. [DOI] [PubMed] [Google Scholar]
- Yang Y. J., Lowry M., Schowalter C. M., Fakayode S. O., Escobedo J. O., Xu X. Y., Zhang H. T., Jensen T. J., Fronczek F. R., Warner I. M., Strongin R. M. J. Am. Chem. Soc. 2006;128:14081–14092. doi: 10.1021/ja0632207. [DOI] [PMC free article] [PubMed] [Google Scholar]
- Zhang Z. Y., Wu Y. S., Tang K. C., Chen C. L., Ho J. W., Su J. H., Tian H., Chou P. T. J. Am. Chem. Soc. 2015;137:8509–8520. doi: 10.1021/jacs.5b03491. [DOI] [PubMed] [Google Scholar]
- Zhu L. L., Li X., Zhang Q., Ma X., Li M. H., Zhang H. C., Luo Z., Ågren H., Zhao Y. L. J. Am. Chem. Soc. 2013;135:5175–5182. doi: 10.1021/ja400456h. [DOI] [PubMed] [Google Scholar]
- Zhu L. Y., Wu W. W., Zhu M. Q., Han J. J., Hurst J. K., Li A. D. Q. J. Am. Chem. Soc. 2007;129:3524–3526. doi: 10.1021/ja068452k. [DOI] [PMC free article] [PubMed] [Google Scholar]
- Chamberlayne C. F., Lepekhina E. A., Saar B. D., Peth K. A., Walk J. T., Harbron E. J. Langmuir. 2014;30:14658–14669. doi: 10.1021/la503823v. [DOI] [PubMed] [Google Scholar]
- Kozlow D. V., Castellano F. N. J. Phys. Chem. A. 2004;108:10619–10622. [Google Scholar]
- Gust D., Andréasson J., Pischel U., Moore T. A., Moore A. L. Chem. Commun. 2012;48:1947–1957. doi: 10.1039/c1cc15329c. [DOI] [PubMed] [Google Scholar]
- Uno K., Niikura H., Morimoto M., Ishibashi Y., Miyasaka H., Irie M. J. Am. Chem. Soc. 2011;133:13558–13564. doi: 10.1021/ja204583e. [DOI] [PubMed] [Google Scholar]
- Embedded in hydrophobic nanoparticles, the fluorescence quantum yield of photochromic molecules (e.g., spiropyran derivatives) may experience an increase up to ca. 0.2. See for example ref. 28
- Yildiz I., Impellizzeri S., Deniz E., McCaughan B., Callan J. F., Raymo F. M. J. Am. Chem. Soc. 2011;133:871–879. doi: 10.1021/ja107341f. [DOI] [PubMed] [Google Scholar]
- Rampazzo E., Bonacchi S., Juris R., Montalti M., Genovese D., Zaccheroni N., Prodi L., Rambaldi D. C., Zattoni A., Reschiglian P. J. Phys. Chem. B. 2010;114:14605–14613. doi: 10.1021/jp1023444. [DOI] [PubMed] [Google Scholar]
- Genovese D., Bonacchi S., Juris R., Montalti M., Prodi L., Rampazzo E., Zaccheroni N. Angew. Chem., Int. Ed. 2013;52:5965–5968. doi: 10.1002/anie.201301155. [DOI] [PubMed] [Google Scholar]
- The concentrations of DPA and DAE are significantly higher in the micelles compared to the apparent “bulk concentration” estimated from UV/vis absorption measurements. With a 1.35 μM concentration of the micelles in solution (see ESI), and the assumption that the diameter of the micellar hydrophobic core is 10 nm (cf. the hydrodynamic diameter of 15 nm), the intra-micellar concentrations of DPA and DAE are ca. 8 mM and 5 mM, respectively. This results in intermolecular donor–acceptor distances that allow for FRET reactions to occur with high efficiency. It should be stressed that there are no signs of self-quenching of the respective fluorophore in the micelles, despite the high effective concentrations. This is apparent from the steady-state intensities of the monomers, which scale linearly with the micellar concentrations of DPA and DAEc (see ESI for details). Moreover, the fluorescence quantum yields of DPA and DAEc are not significantly changed in the micelles compared to the corresponding numbers in acetonitrile at μM concentrations. We ascribe the absence of self-quenching to the limited diffusion of the fluorophores embedded in the decyl are not significantly changed in the micelles compared to the corresponding numbers in acetonitrile at μM concentrations. We ascribe the absence of self-quenching to the limited diffusion of the fluorophores embedded in the decyl side chains inside the micellesside chains inside the micelles
- The observed “hysteresis” is due to an increase of the weak emission from DAEo with time (maximum at around 500 nm). The reason for this increase is still unclear
Associated Data
This section collects any data citations, data availability statements, or supplementary materials included in this article.


