Abstract
Purpose
To fully quantify PET imaging outcome measures, a blood sampling pump is often used during the PET acquisition. With simultaneous PET/MR studies, a structural magnetization‐prepared rapid gradient‐echo (MP‐RAGE) may also be acquired while the pump is generating electromagnetic noise. This study investigated whether this noise contamination would be detrimental to the quantification of volume and cortical thickness measures obtained from automated segmentation of the MP‐RAGE image.
Methods
MP‐RAGE T1w structural images were acquired for a phantom and 10 healthy volunteers (five female, 27.2 ± 5.1 y old) with the blood sampling pump and without. The white matter signal‐to‐noise ratio (SNR) was computed for all images. Region‐wise cortical thickness and volume were extracted with Freesurfer 5.3.0.
Results
The phantom SNR and the white matter human subject SNR was degraded in the MP‐RAGE images acquired with the pump (P = 0.005; white matter SNR: 43.9 and 50.8 with the pump and without). Intrasession, region‐wise volume and cortical thickness estimates were significantly overestimated with the pump (percent difference: 1.14 ± 2.67% for volume (P = 0.0003) and 0.34 ± 1.59% (P = 0.02) for cortical thickness). Regions with percent differences greater than 5% between pump conditions were those close to tissue–air interfaces: entorhinal, frontal pole, parsorbitalis, temporal pole, and medial orbitofrontal. Synthetically adding Gaussian noise to the without pump MP‐RAGE images yielded similar, significant detriments to cortical morphometry compared to without the pump.
Conclusions
This study provides evidence that the use of PET blood sampling pumps may generate unstructured, Gaussian‐distributed noise in MP‐RAGE images that significantly alters the accuracy of Freesurfer‐derived volume and cortical thickness estimates. While many cortical regions showed a percent difference of less than 1% with the pump, regions close to tissue–air interfaces, subject to larger susceptibility artifacts, were significantly affected. This potential for decreased accuracy should be considered in PET/MR research studies utilizing blood sampling pumps, as well as any MRI study utilizing radiofrequency noise producing devices such as functional MRI task equipment and physiologic monitoring devices.
Keywords: automated blood sampling, cortical thickness, PET/MR , structural MRI , volume
1. Introduction
Simultaneous PET/MR attracted significant interest due to its capability of acquiring PET and MR data at the same time. Simultaneous acquisition allows for accurate coregistration between the structural MR image and the PET time series for attenuation correction and region of interest (ROI) placement, as well as opportunities for improved PET motion correction and both temporally and spatially aligned multimodal analyses. However, in optimizing PET quantification methods, sources of electromagnetic noise such as an automated blood sampling pump are often introduced that have the potential to interfere with the time‐variant radiofrequency (RF) signal necessary to generate MR images, potentially degrading the image quality of the MR images acquired. This study investigates the effect of a PET blood sampling pump on one of the most popular T1‐weighted structural sequences, 3D magnetization‐prepared rapid gradient‐echo (MP‐RAGE).1
To arrive at fully quantitative PET outcome measures, free from reference region assumptions, an input function of the radiotracer concentration must be obtained. This input function is measured from arterial blood sampled during the PET scan via arterial catheterization. Because rapid changes in radiotracer concentration occur in the short duration postinjection, it is necessary to obtain blood samples in rapid succession during this early phase. Therefore, automated arterial sampling pumps are often used in the first 5–10 min of PET acquisition to draw blood through a catheter for radioanalysis.2, 3, 4 Later samples are typically extracted manually, with longer time periods between draws due to slower tracer kinetics. In simultaneous brain PET/MR studies, the T1w MP‐RAGE is often the first sequence acquired as it is essential for anatomical delineation in region‐wise PET analyses and therefore, may be obtained in this postinjection window as well. Because the pump is powered by an electric motor (leads to electromagnetic noise), and is located close to the scanner (to cut down catheter dead volume), contamination of the MP‐RAGE sequence is possible.
Figure 1 is an example of the MP‐RAGE noise effect generated when the pump is on, compared to without the pump. While this effect has been observed qualitatively in practice, it is currently unknown how the baseline electromagnetic noise associated with running the blood sampling pump during MR sequences affects metrics such as signal‐to‐noise ratio (SNR) and intrasession reliability of derived outcomes.
Figure 1.
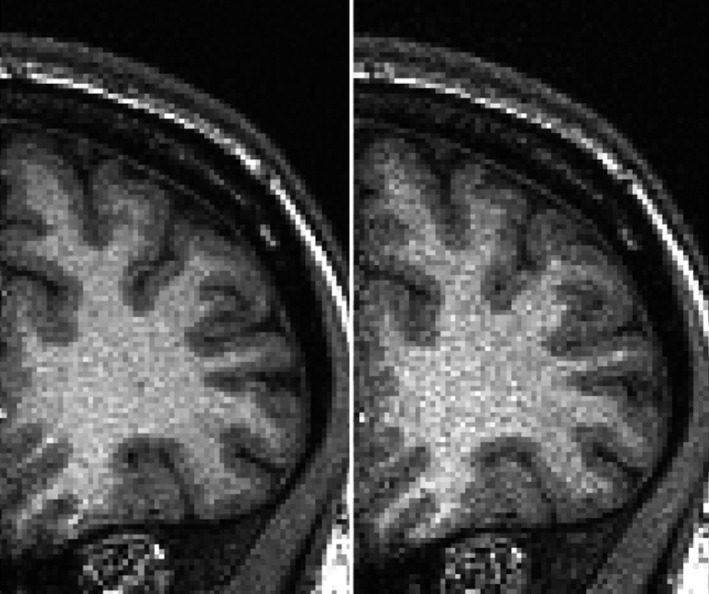
Sample image of an MP‐RAGE acquisition under standard conditions without the pump (LEFT) compared to MP‐RAGE acquisition with the pump on (RIGHT), where the intensity range is identical for both images.
Within any PET study, a structural MRI sequence, such as the MP‐RAGE allows for segmentation of accurate regions of interest. Whether these regions of interest are solely used for accurate PET quantification or structural information such as cortical thickness and volume are extracted for separate morphometric analyses, it is crucial to establish the accuracy of the segmentation of these regions. MP‐RAGE derived structural outcome measures have been used in a number of applications including investigating brain development,5 developing depression treatment response predictors,6 and assessing pathological structural alterations.7 Therefore, it is essential to assess the degree to which PET/MR associated sources of electromagnetic noise contaminate MP‐RAGE sequences, leading to potential inaccuracies and instabilities in cortical thickness and volume estimates. This investigation will further seek to deduce the nature and structure of the noise present in MP‐RAGE images with the pump on through simulation analyses.
2. Materials and methods
2.A. Subjects
Structural MRI acquisition was performed on (a) the standard Siemens 1900 ml saline water bottle phantom (model # 8624186; 3.75 g NISO4 × 6H2O + 5 g NACL) and (b) 10 healthy volunteers (five male, five female; 27.2 ± 5.1 y old). The study protocol was approved by the Stony Brook University IRB and written informed consent was obtained from all subjects who participated in this study.
2.B. MRI imaging protocol
MP‐RAGE images were acquired on a 3 T Siemens Biograph mMR at Stony Brook Medicine with a 20‐channel head coil and the following parameters: TR/TE/TI = 2300/2.98/900 ms, Flip Angle = 9°, IPAT = 2, and voxel resolution: 0.87 × 0.87 × 0.87 mm to detect if an automated blood sampling pump used for quantitative PET imaging would affect MP‐RAGE‐based estimates of cortical thickness and volume. The blood sampling pump used was the remote operated MRI‐compatible Harvard Apparatus syringe pump (PHD 22/2000; https://www.harvardapparatus.com/mri-compatible-syringe-pump.html), which was installed consistent with the apparatus instructions — to one side of the bore with the control box located in the PET/MR control room, connected with a shielded cable. MP‐RAGE images were acquired with the phantom under four conditions: (a) standard conditions without the pump — “P_out”, (b) with the blood sampling pump located next to the scanner — “P_in”, (c) with the pump next to the scanner and the shielded remote cable connected to the control room, but off, – “P_C_in” and (d) with the pump on — “P_on”. These four conditions were tested in the phantom in order to ensure that effects to the MP‐RAGE images are due to the function of the pump, rather than the installation. MP‐RAGE images were acquired under two conditions in the human subjects — with the automated blood sampling pump located next to the scanner and turned on ‐ “P_on”, as well as with the pump removed from the scanner room — “P_out”.
2.C. MRI image processing
2.C.1. SNR analysis
The SNR of each phantom MP‐RAGE image was calculated by (a) obtaining the mean signal in a 20 mm radius circle at the approximate isocenter of the phantom and (b) obtaining the standard deviation in a 20 mm radius circle placed in the image background, in close proximity to the phantom edge.
The SNR of each human subject MP‐RAGE image was calculated by (a) obtaining the mean signal in a 6 mm radius circle placed in the parietal lobe white matter — Sw, (see Fig. 2 for placement) and (b) obtaining the standard deviation in a 10 mm radius circle placed in the image background — σ b, (see Fig. 2 for placement). SNR for phantom and human subject images was then computed as SNR = 0.655*Sw/σ b.8 Circles were generated and applied with in‐house Matlab2014b scripts.
Figure 2.
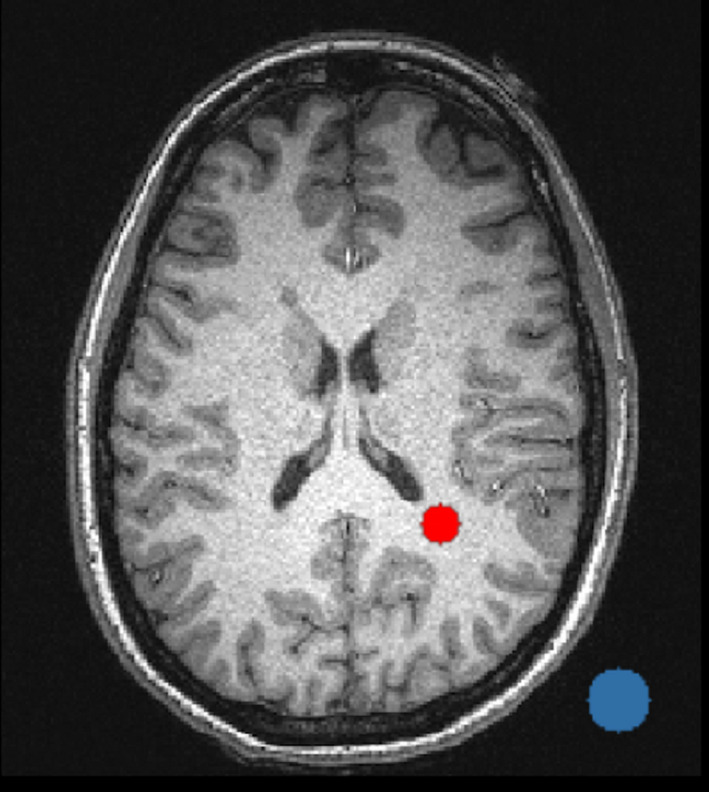
Sample SNR analysis ROI placement for white matter (red 6 mm radius circle) and background (blue 10 mm radius circle). [Color figure can be viewed at wileyonlinelibrary.com]
2.C.2. Freesurfer processing
For the two human subject condition — P_out and P_on — MP‐RAGE images, cortical thickness (CT) and volume were quantified for 34 left hemisphere and 34 right hemisphere Desikan–Killiany9 atlas regions using Freesurfer 5.3.0 (http://surfer.nmr.mgh.harvard.edu/). In brief, Freesurfer processing steps include skull‐stripping,10 Talairach transformation, subcortical gray/white matter segmentation,11 intensity normalization,12 gray/white matter tessellation, topology correction,13, 14 and intensity gradient‐based surface deformation to generate gray/white and gray/cerebrospinal fluid surface models.13, 14, 15 The resulting surface models were then inflated and registered to a spherical surface atlas, allowing parcellation of cortical regions of interest.16, 17, 18 The surface models (used to calculate volume and CT) then underwent manual inspection to ensure all scans in this analysis were free from large‐scale segmentation issues. The final P_out and P_on outcomes generated were regional cortical thickness and volume computed by averaging the white matter‐to‐pial surface distance at all vertices within the region (CT) or summing the total volume of the region.
2.C.3. Simulation analyses
In order to characterize the source of potential observed differences between cortical thickness and volume in the P_out and P_on conditions, random, white noise was simulated within the P_out human subject images (N = 10) — simulated noise images designated as “P_sim”. Because the noise in MRI images at moderate and high SNR levels, consistent with the images in this analysis, can be described by a Gaussian distribution (noise is known to be rician distributed at very low SNR values),19 Gaussian noise was selected for the simulation analyses. Gaussian noise was added at a level consistent with observed alterations in SNR in the P_on images as compared to the P_out images. A percent difference between the SNR of the P_on and P_sim images of less than 5% was desired.
2.C.4. Statistical analyses
Two‐tailed, paired t‐tests were used to examine the differences between the P_out and P_on human images and the P_out and P_sim human images. Pearson's correlations were used to examine potential within‐session biases generated in cortical thickness and volume (performed in Matlab 2014b; MathWorks, Natick, MA, USA). Two‐tailed, paired t‐tests were also used to examine the difference in cortical thickness and volume estimates across all Desikan–Killiany regions and subjects. Percent difference, calculated as the difference between the P_out and P_on human MP‐RAGE estimates or between the P_out and P_sim estimates, divided by the average, was also used to assess within‐session differences in each Freesurfer region (positive percent differences indicate larger volume or cortical thickness for P_on or P_sim compared to P_out). T‐tests and percent differences were computed in Microsoft Excel.
3. Results
3.A. Phantom MP‐RAGE
Within the phantom MP‐RAGE images, a decrease in SNR was observed between P_out and P_on of 4.64% (P_out SNR = 214.04; P_on SNR = 204.33). As compared to P_out, adding the pump — P_in — and then connecting the remote cable — P_C_in — decreased the SNR by 1.57% and 1.31%, respectively.
3.B. Human MP‐RAGE
The mean white matter SNR values across the human MP‐RAGE images were 41.95 ± 6.84 and 50.87 ± 7.68 (unitless) for P_on and P_out, respectively, corresponding to an average decrease in SNR of 19.2% across subjects when the pump is in the scanner room and turned on. In the P_on condition, the white matter SNR was significantly decreased as compared to P_out (P = 0.001). (Fig. 3).
Figure 3.
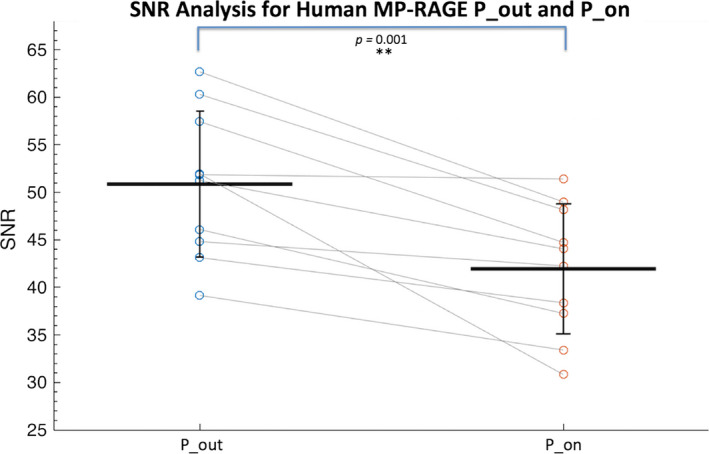
Human MP‐RAGE white matter signal‐to‐noise ratio (SNR) analysis of P_on (pump in the room and on) and P_out (no pump or cable in room) conditions (N = 10). The SNR values for each subject are connected with gray lines and the group mean and standard deviations are shown with black lines. [Color figure can be viewed at wileyonlinelibrary.com]
Across all subjects and Freesurfer regions, there were biases toward larger cortical volumes and thicknesses generated with P_on compared to P_out (volume: best fit slope = 0.993, Pearson's Rho = 0.997; cortical thickness: best fit slope = 0.916, Pearson's Rho = 0.949). (Fig. 4). These biases resulted in statistically significant differences between cortical volume and thickness estimates obtained with P_on compared to P_out (volume: P = 0.0003; cortical thickness: P = 0.02), where volumes and thicknesses were on average larger in the P_on condition than P_out (average volumes: 7563.88 ± 5729.78 and 7504.91 ± 5702.55 mm3 and cortical thicknesses: 2.54 ± 0.36 and 2.53 ± 0.35 mm for P_on and P_out, respectively).
Figure 4.
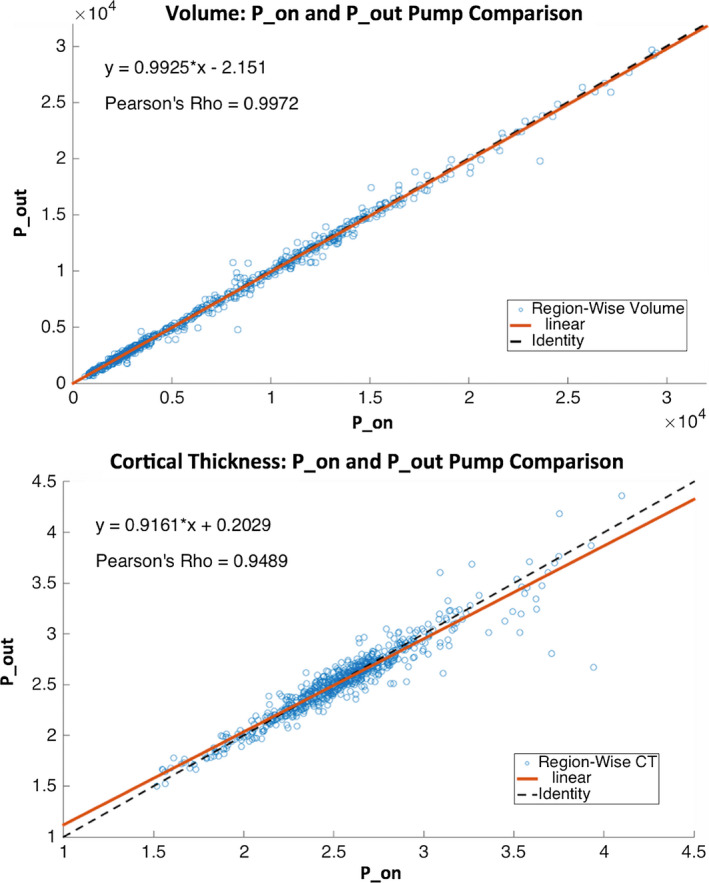
Human MP‐RAGE and Freesurfer‐derived volume (TOP) and cortical thickness (BOTTOM) estimates for P_on (pump in the room and on; x‐axis) and P_out (no pump or cable in room; y‐axis) (N = 10). Lines of best fit shown with solid orange lines and identity shown with dashed black lines. Equations of best fit lines and Pearson's Rho displayed. [Color figure can be viewed at wileyonlinelibrary.com]
Because we observed a bias in volume and cortical thickness estimates obtained with the pump (P_on), we examined nonabsolute value percent differences to examine directionality. Percent difference results between the P_on and P_out conditions are visualized on a brain as heat‐maps in Figs. 5 and 6 and shown in bar graph form in Fig. 7. The average percent differences between conditions, across all subjects and regions, were 1.14 ± 2.67% for volume and 0.34 ± 1.59% for cortical thickness. Regions with percent differences greater than 5% were: left entorhinal, left frontal pole, left and right medial orbitofrontal, left parsorbitalis, and left and right temporal pole for volume and left temporal pole for cortical thickness. Sample left entorhinal and left medial orbitofrontal cortex segmentations and MP‐RAGE images are shown in Fig. 8.
Figure 5.
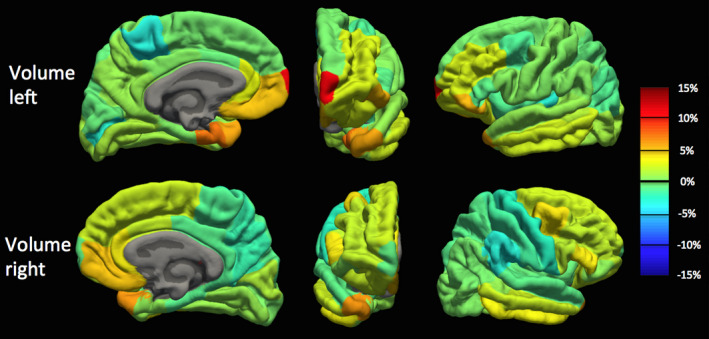
Volume percent difference map between human MP‐RAGE P_on (pump in the room and on) and P_out (no pump or cable in room) for the left hemisphere (TOP) and right hemisphere (BOTTOM) across all Desikan–Killiany atlas regions. Percent difference values averaged across the 10 subjects. Orange‐to‐red indicates a positive percent difference greater than approximately 5% (volume larger with P_on than P_out), while cyan‐to‐dark blue indicates a negative percent difference greater than approximately −5% (volume smaller with P_on than P_out). [Color figure can be viewed at wileyonlinelibrary.com]
Figure 6.
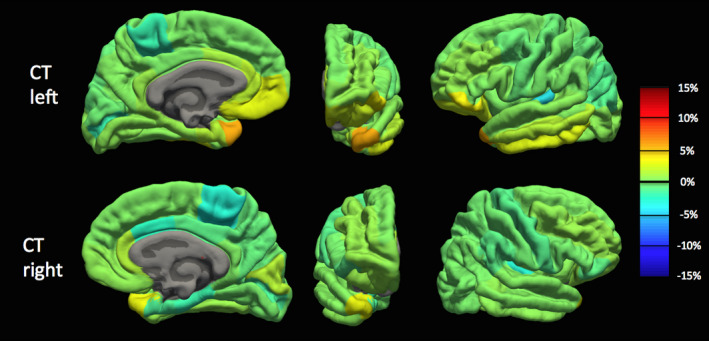
Cortical thickness percent difference map between human MP‐RAGE P_on (pump in the room and on) and P_out (no pump or cable in room) for the left hemisphere (TOP) and right hemisphere (BOTTOM) across all Desikan–Killiany atlas regions. Percent difference values averaged across the 10 subjects. Orange‐to‐red indicates a positive percent difference greater than approximately 5% (cortical thickness larger with P_on than P_out), while cyan‐to‐dark blue indicates a negative percent difference greater than approximately −5% (cortical thickness smaller with P_on than P_out). [Color figure can be viewed at wileyonlinelibrary.com]
Figure 7.
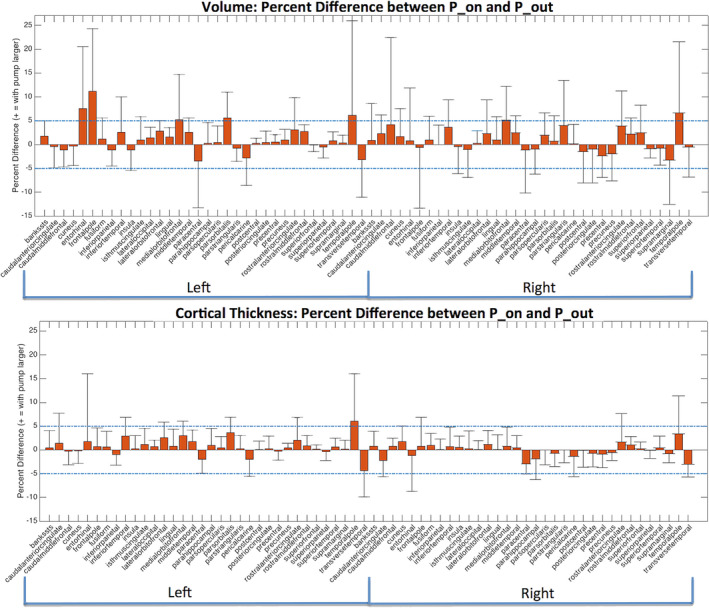
Region‐wise percent difference values for volume (TOP) and cortical thickness (BOTTOM) averaged across all 10 subjects for all Desikan–Killiany atlas regions. Error bars show the standard deviations across the 10 subjects for each region. 5% and −5% differences displayed with dashed blue lines. [Color figure can be viewed at wileyonlinelibrary.com]
Figure 8.
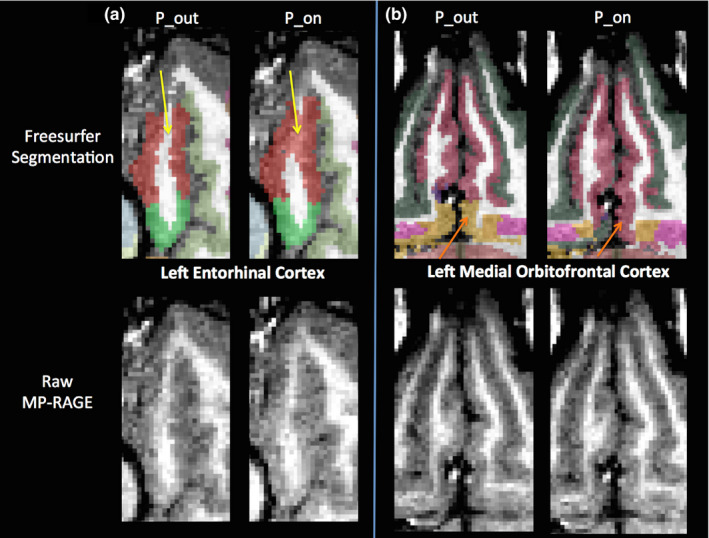
Segmentation differences between human MP‐RAGE P_on (pump in the room and on) and P_out (no pump or cable in room) for two regions with percentage differences in volume estimates greater than 5%, the left entorhinal cortex (a) and the left medial orbitofrontal cortex (b). Freesurfer segmentations shown in the top panes and raw MP‐RAGEs shown in the bottom panes. (a) Left entorhinal cortex (red): Yellow arrows indicate an area of white matter incorrectly segmented as left entorhinal cortex only in P_on. (b) Left medial orbitofrontal cortex (pink): Orange arrows indicate an area in P_on that is incorrectly segmented as left medial orbitofrontal cortex instead of left insula (yellow). [Color figure can be viewed at wileyonlinelibrary.com]
3.C. Simulation analyses
In order to determine the source of the difference in Freesurfer estimates between P_on and P_out conditions, Gaussian noise was added to the human MP‐RAGE P_out images distributed with a standard deviation of 4 (P_sim). Simulating noise in the P_out human MP‐RAGE images produced SNR estimates in the P_sim images within −4.55 ± 14.03% of the 10 human MP‐RAGE P_on images. A similar bias to the P_out and P_on conditions was observed when comparing P_sim to P_out in Freesurfer‐derived cortical thickness and volume, where morphometric estimates were larger in the P_sim images than P_out images (Table 1). Furthermore, consistent with the statistically significant bias in volume and cortical thickness between P_on and P_out pump conditions, there was a significant difference in volume and cortical thickness between the P_sim and P_out images (CT: P = 0.01, Volume: P = 0.009) (Table 1).
Table 1.
Volume and cortical thickness comparisons for P_out, P_on, and P_sim
| Volume | Cortical thickness | |||||
|---|---|---|---|---|---|---|
| Average | P‐value (comparing condition to without pump) | Pearson's rho | Average | P‐value (comparing condition to without pump) | Pearson's rho | |
| P_out | 7504.90 ± 5702.55 | – | – | 2.530 ± 0.351 | – | – |
| P_on | 7563.88 ± 7504.90 | 0.0003 | 0.9972 | 2.540 ± 0.364 | 0.020 | 0.9489 |
| P_sim | 7544.35 ± 5719.89 | 0.010 | 0.9976 | 2.538 ± 0.361 | 0.009 | 0.9738 |
P_out — no pump or cable in room; P_on — pump in the room and on; P_sim — Gaussian simulated noise added to P_out.
4. Discussion
To perform full PET quantification with arterial blood sampling, a pump is typically located in the scanner room. While MRI‐compatible syringe pumps, such as the Harvard Apparatus pump used in this investigation, are verified along MRI compatibility aspects such as patient safety and proper pump operation within the magnetic field, there is no documentation, to our knowledge, of studies examining effects of electromagnetic noise from the pump operation during MR acquisition on reliability of postprocessed outcome measures such as cortical morphometry. As simultaneous PET/MR imaging is becoming increasingly widespread, and MR data acquired during PET studies are often compared with data from MR‐only imaging sessions, it is critical to characterize these potential effects.
In this investigation, we found that the use of an automated blood pump yields a decrease in signal‐to‐noise ratio in MP‐RAGE structural images in a phantom and in human subjects compared to standard conditions without a pump. We note that there is a substantial deviation in SNR estimates within the human MP‐RAGE images, which may be due to potential bulk and physiological motion of the subjects. The observed decrease in SNR may contribute to the significant difference found between Freesurfer‐derived cortical thickness and volume estimates derived from MP‐RAGE images acquired with the pump as compared to without. In simulation analyses of the human MP‐RAGE structural images, we also provide evidence to support that the noise generated in the MP‐RAGE images from the pump is unstructured noise with a Gaussian distribution.
Globally, the within‐session percent differences reported between the with and without pump conditions are slightly smaller than, but consistent with, previous reports using standardized test–retest, intersession conditions with no added radiofrequency noise (compare 1.1% [volume] and 0.3% [cortical thickness] percent differences between pump conditions to intersession results by Iscan et al. of 1.7% [volume] and 1.0% [cortical thickness]).20 The trend that volume measurements are more susceptible to differences between conditions (either test–retest or pump changes) than cortical thickness holds consistent, most likely due to the narrow range of cortical thickness values as compared to volume.
Overall, we observed a statistically significant increase in cortical thickness and volume estimates generated with the pump on as compared to without. However, we observed that 35% of volume estimates and 34% of cortical thickness estimates were on average smaller with the pump on than without (negative percent difference — see Figs. 5, 6, and 7), with all of these regions having percent differences less than 5%. Because biases were observed in Fig. 4, we examined this directionality in the cortical thickness and volume differences. This directionality can be observed in the heat‐maps in Figs. 5 and 6 where orange‐to‐red regions represent larger volumes and thicknesses with the pump and cyan‐to‐blue regions represent smaller regions with the pump.
We attempted to understand why the pump‐related noise would introduce an overall positive bias to cortical volume and thickness estimates. In the Freesurfer surface‐based processing pipeline, after registration, bias field correction, and skull‐stripping, voxels are classified as either white matter or non‐white matter, based on intensity and neighbor constraints. A surface is then generated by tiling the outside of the white matter map. This surface is then refined following intensity gradients between white and gray matter to generate the white‐to‐gray matter final surface. To create the gray‐to‐pial surface, the white‐to‐gray surface is expanded outwards to follow intensity gradients between gray matter and cerebrospinal fluid. For more details, see Fischl and Dale 2000.21
Because the SNR of the MP‐RAGE phantom and human subject images were degraded with the blood sampling pump on, there was less contrast between the white matter, gray matter, and cerebrospinal fluid boundaries. Based on qualitative visual inspection, even in the most ideal cases, Freesurfer segmentations can extend slightly into the pial and meningeal layers due to similar T1‐weighted signal contrast in gray matter and meningeal layers. Furthermore, susceptibility artifacts near tissue–air interfaces can blur the white‐to‐gray matter boundary. Therefore, it is possible that the overestimation of cortical volume and thickness could be due to: (a) erosion of the white matter surface from the blur of gray matter signal intensities, (b) dilation of the gray‐to‐pial surface into the pial layers or (c) a combination of the two. It can be observed in Fig. 8 that at least in the case of the left entorhinal cortex, the discrepancy in volume estimates is due to a classification of entorhinal white matter as cortical gray matter, leading to an overestimation of gray matter volume.
It was hypothesized that regions close to tissue–air interfaces, such as in the inferior temporal and frontal lobes, that are already greatly affected by susceptibility artifacts, would suffer further losses to tissue contrast due to the added noise generated by the blood sampling pump. This degraded tissue contrast would lead to less accurate cortical thickness and volume estimates through inaccuracies in Freesurfer white‐to‐gray matter and gray‐to‐pial surface segmentations. Concordantly, all regions with percent differences greater than 5% were in close proximity to tissue–air interfaces (examples provided in Fig. 8). As summarized in the results, these regions were the entorhinal, temporal pole, parsorbitalis, medial orbitofrontal, and temporal pole (shown in orange‐to‐red colors on the heat‐maps in Figs. 5 and 6). All five of these regions are located in close proximity to tissue–air interfaces, namely the sphenoid, maxillary, and frontal sinuses and are relatively small regions. Conversely, cortical areas far from the large sinuses such as the lingual, precuneus, post‐central, and posterior cingulate were affected minimally by the noise generated by the automated blood sampling pump.
As expected, outlier points (six visually identified on Fig. 4) in the regression of cortical thickness estimates between the pump conditions were all from regions identified as having greater than a 5% difference between pump conditions; these six outliers were from the temporal pole and entorhinal regions. Interestingly, outlier points in the regression of volume estimates (four visually identified on Fig. 4) were from the right hemisphere regions: precentral, superior frontal, supramarginal, and caudal middle frontal. Overall, these regions were minimally affected by the pump, with percent differences less than 5%. However, a single subject in each of these regions had a percent difference ranging from −14.5 to 54.4%, while the rest of the subjects had minimal percent differences, thereby a low percent difference was maintained when averaged over all subjects.
Importantly, this intersubject variance, where some subjects’ cortical volume and thickness are altered by greater than 50%, while other subjects’ only change by < 1%, could have a large effect on statistical power‐based sample size calculations. With a larger variance in the outcome measure of interest with the blood sampling pump on, more subjects would be required to observe statistical differences between patient groups, such as multiple sclerosis patients vs. controls, or between treatments, such as antidepressant vs. placebo groups.
To better understand the source of the inaccurate Freesurfer segmentations observed with the blood sampling pump, we simulated Gaussian‐distributed noise in the without pump images, at a level generating consistent SNR decreases as when the pump was turned on. We found that Gaussian noise generated a significant positive bias in volume and cortical thickness estimates from the without pump condition. This suggests that the blood sampling pump generated unstructured, Gaussian‐distributed noise within the MP‐RAGE images. Furthermore, the detrimental effects of the automated blood sampling to Freesurfer‐derived morphometric estimates may arise from added Gaussian noise in the MP‐RAGE images.
While this study provides the first evidence, to our knowledge, of detectable differences in structural MR measures acquired during automated blood sampling, the study has some limitations. The modest sample size of 10 subjects limits the statistical power and the age range of 20–38 y old does not allow for us to address whether these structural quantification differences are constant across the lifespan. For example, the cortical atrophy seen in many elderly individuals may lead to even more pronounced segmentation inaccuracies with the additional radiofrequency noise. Further, the use of a single scanner, structural MR sequence, and blood sampling pump may limit the generalizability of this study as it is unknown how much radiofrequency contamination different automated sampling systems generate, how this type of noise affects MR systems of varying B0 and gradient strengths, and how different MR sequences may be affected. Testing across varying PET/MR platforms, blood sampling pumps, and sequences are critical next steps.
Therefore, we provide a few recommendations for researchers using an automated blood sampling pump in simultaneous PET/MR acquisition. First, perform a pilot study as outlined here to characterize the effect of radiofrequency interference on outcome measures derived from your sequence‐of‐interest. Second, do not acquire MR sequences while the blood sampling pump is in use (typically the first 5–10 min of the PET scan). Third, given that the noise generated in the images appears to be unstructured, time allowing, lengthening the MP‐RAGE acquisition time may help to recover SNR. While this may mitigate SNR losses, additional testing and optimization would be necessary in order to determine the effects of altering sequence parameters. Fourth, if none of these options or analyzing previously acquired data is feasible, avoid analysis of regions close to tissue–air interfaces found here to be highly influenced by the blood sampling pump, such as the entorhinal cortex, frontal pole, parsorbitalis, medial orbitofrontal cortex, and the temporal pole. With constant advances in MRI acquisition and analysis methods, accurately identifying and removing sources of noise from MR images is an increasingly important issue.
Lastly, researchers should keep in mind that any source of radiofrequency noise introduced to a simultaneous PET/MR or a standard MRI machine has the potential to influence outcome measures derived from MR acquisitions. These sources can include, but are not limited to, electronic motion detection systems, eye tracking devices, projectors to display movies or functional MRI tasks, and vital sign monitors (electrocardiogram, heart rate, pulse oximeters, electrodermal activity, etc.). Characterization of the impact of these noise‐generating systems on varying MRI sequences, such as functional MRI, diffusion MRI, arterial spin labeling, and magnetic resonance spectroscopy, could provide valuable information to ensure studies are adequately powered.
5. Conclusions
Overall, the accuracy of volume and cortical thickness estimates in Freesurfer Desikan–Killiany regions, as assessed by direct outcome measure and percent difference comparisons, were found to be significantly, negatively influenced by the electromagnetic noise generated by an automated PET blood sampling pump. This effect of altered Freesurfer‐derived cortical volume and thickness estimates may be driven by the significantly decreased white matter signal‐to‐noise ratio in MP‐RAGE images acquired with the pump. From simulation analyses, we further determined that adding Gaussian‐distributed noise to standard, without pump images causes a similar detriment to cortical thickness and volume estimates as the blood sampling pump. With many studies attempting to detect brain imaging differences on the order of 5%, characterization of the effect of added noise to MR acquisition from an automated blood sampling pump, or other sources such as vital sign monitors and functional task equipment, should be performed. If this characterization is not possible, considerations should be made when analyzing regions adjacent to tissue–air interfaces to prevent the introduction of a significant bias to neuroimaging analyses.
Conflicts of Interest
Ms. Bartlett, Dr. DeLorenzo, Dr. Parsey, and Dr. Huang have no relevant conflicts of interest to disclose.
Acknowledgments
We would like to acknowledge support provided by the NARSAD Young Investigator Award (PI: Huang).
References
- 1. Mugler JP 3rd, Brookeman JR. Three‐dimensional magnetization‐prepared rapid gradient‐echo imaging (3D MP RAGE). Magn Reson Med. 1990;15:152–157. [DOI] [PubMed] [Google Scholar]
- 2. Graham MM, Lewellen BL. High‐speed automated discrete blood sampling for positron emission tomography. J Nucl Med. 1993;341357–341360. [PubMed] [Google Scholar]
- 3. DeLorenzo C, DellaGioia N, Bloch M, et al. In vivo ketamine‐induced changes in [(1)(1)C]ABP688 binding to metabotropic glutamate receptor subtype 5. Biol Psych. 2015;77:266–275. [DOI] [PMC free article] [PubMed] [Google Scholar]
- 4. Parsey RV, Slifstein M, Hwang DR, et al. Validation and reproducibility of measurement of 5‐HT1A receptor parameters with [carbonyl‐11C]WAY‐100635 in humans: comparison of arterial and reference tisssue input functions. J Cereb Blood Flow Metab. 2000;20:1111–1133. [DOI] [PubMed] [Google Scholar]
- 5. Treit S, Lebel C, Baugh L, Rasmussen C, Andrew G, Beaulieu C. Longitudinal MRI reveals altered trajectory of brain development during childhood and adolescence in fetal alcohol spectrum disorders. J Neurosci. 2013;33:10098–10109. [DOI] [PMC free article] [PubMed] [Google Scholar]
- 6. Nordanskog P, Larsson MR, Larsson EM, Johanson A. Hippocampal volume in relation to clinical and cognitive outcome after electroconvulsive therapy in depression. Acta Psychiatr Scand. 2014;129:303–311. [DOI] [PMC free article] [PubMed] [Google Scholar]
- 7. Sastre‐Garriga J, Arevalo MJ, Renom M, et al. Brain volumetry counterparts of cognitive impairment in patients with multiple sclerosis. J Neurol Sci. 2009;282:120–124. [DOI] [PubMed] [Google Scholar]
- 8. Firbank MJ, Coulthard A, Harrison RM, Williams ED. A comparison of two methods for measuring the signal to noise ratio on MR images. Phys Med Biol. 1999;44:N261–264. [DOI] [PubMed] [Google Scholar]
- 9. Desikan RS, Segonne F, Fischl B, et al. An automated labeling system for subdividing the human cerebral cortex on MRI scans into gyral based regions of interest. NeuroImage. 2006;31:968–980. [DOI] [PubMed] [Google Scholar]
- 10. Segonne F, Dale AM, Busa E, et al. A hybrid approach to the skull stripping problem in MRI. NeuroImage. 2004;22:1060–1075. [DOI] [PubMed] [Google Scholar]
- 11. Fischl B, Salat DH, Busa E, et al. Whole brain segmentation: automated labeling of neuroanatomical structures in the human brain. Neuron. 2002;33:341–355. [DOI] [PubMed] [Google Scholar]
- 12. Sled JG, Zijdenbos AP, Evans AC. A nonparametric method for automatic correction of intensity nonuniformity in MRI data. IEEE Trans Med Imaging. 1998;17:87–97. [DOI] [PubMed] [Google Scholar]
- 13. Fischl B, Liu A, Dale AM. Automated manifold surgery: constructing geometrically accurate and topologically correct models of the human cerebral cortex. IEEE Trans Med Imaging. 2001;20:70–80. [DOI] [PubMed] [Google Scholar]
- 14. Segonne F, Pacheco J, Fischl B. Geometrically accurate topology‐correction of cortical surfaces using nonseparating loops. IEEE Trans Med Imaging. 2007;26:518–529. [DOI] [PubMed] [Google Scholar]
- 15. Dale AM, Fischl B, Sereno MI. Cortical surface‐based analysis. I. Segmentation and surface reconstruction. NeuroImage. 1999;9:179–194. [DOI] [PubMed] [Google Scholar]
- 16. Fischl B, Sereno MI, Dale AM. Cortical surface‐based analysis. II: inflation, flattening, and a surface‐based coordinate system. NeuroImage. 1999;9:195–207. [DOI] [PubMed] [Google Scholar]
- 17. Fischl B, Sereno MI, Tootell RB, Dale AM. High‐resolution intersubject averaging and a coordinate system for the cortical surface. Hum Brain Mapp. 1999;8:272–284. [DOI] [PMC free article] [PubMed] [Google Scholar]
- 18. Fischl B, van der Kouwe A, Destrieux C, et al. Automatically parcellating the human cerebral cortex. Cereb Cortex. 2004;14:11–22. [DOI] [PubMed] [Google Scholar]
- 19. Gudbjartsson H, Patz S. The Rician distribution of noisy MRI data. Magn Reson Med. 1995;34:910–914. [DOI] [PMC free article] [PubMed] [Google Scholar]
- 20. Iscan Z, Jin TB, Kendrick A, et al. Test‐retest reliability of freesurfer measurements within and between sites: effects of visual approval process. Hum Brain Mapp. 2015;36:3472–3485. [DOI] [PMC free article] [PubMed] [Google Scholar]
- 21. Fischl B, Dale AM. Measuring the thickness of the human cerebral cortex from magnetic resonance images. Proc Natl Acad Sci USA. 2000;97:11050–11055. [DOI] [PMC free article] [PubMed] [Google Scholar]


