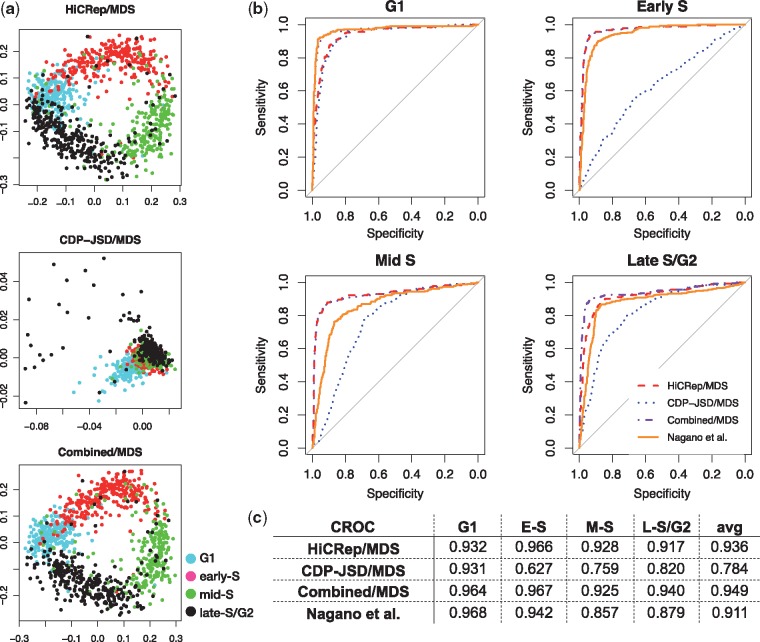
Fig. 2.
Comparison relative to the cell-cycle order from Nagano et al. (a) Projection of 1051 cells via HiCRep/MDS, CDP-JSD/MDS and combined/MDS. (b) CROC curves from HiCRep/MDS, CDP-JSD/MDS, combined/MDS and Nagano et al. for the four cell-cycle phases. (c) Area under CROC curves from four approaches in the four cell-cycle phases and the average CROC over the four cell-cycle phases

