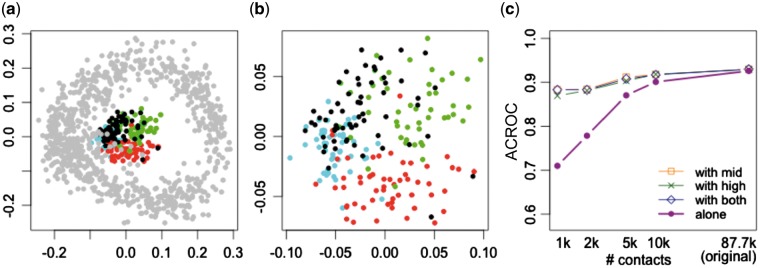
Fig. 4.
Joint projection of low quality cells with high quality cells. (a) Projection of the cells which are downsampled to 1k (colored by their cell-cycle phase) together with the original high-coverage cells (in gray). (b) Zoom-in view of the same projection of downsampled cells in (a). (c) The area under the circular ROC curves from different sets of downsampled cells. Projections are performed on the cells by themselves, and in conjunction with the set of ‘mid’ coverage cells, ‘high’ coverage cells, or both

