
Fig. 3.
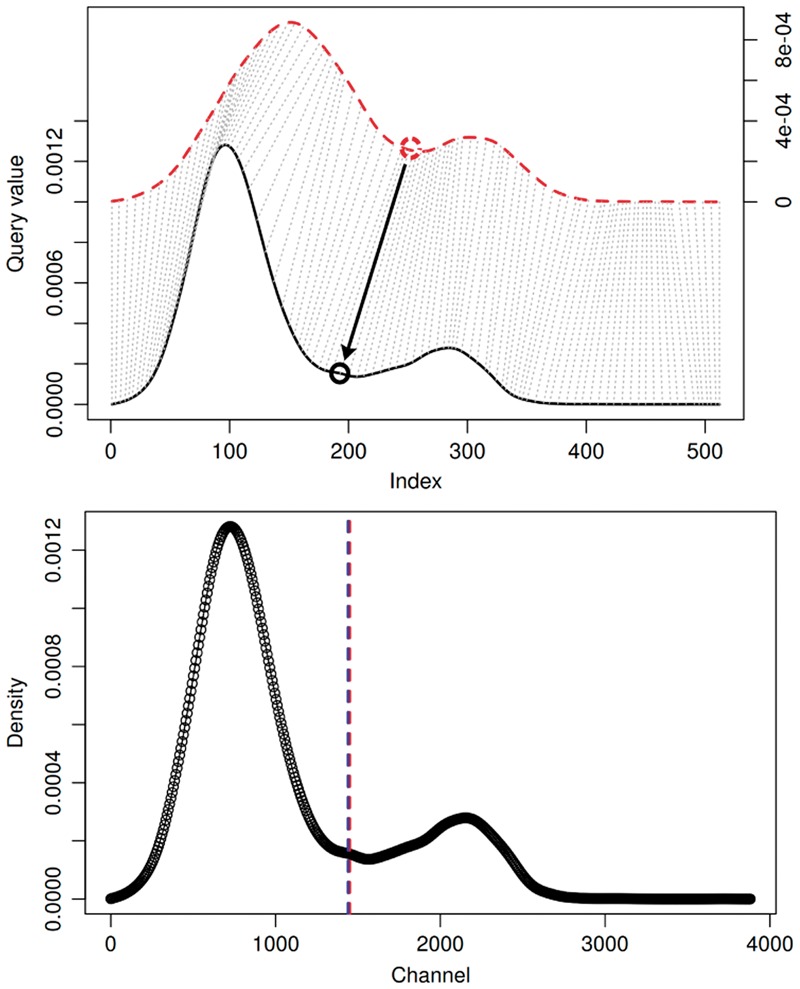
Example of how thresholds are transferred using DDTW alignments. Top: The red-dashed prototype density dp is aligned to the solid-black test density di. The transfer of threshold location is indicated by an arrow. Bottom: Test density di with predicted (blue) and true (red) thresholds, and ti, respectively. Both thresholds match up well (Color version of this figure is available at Bioinformatics online.)