
Fig. 5.
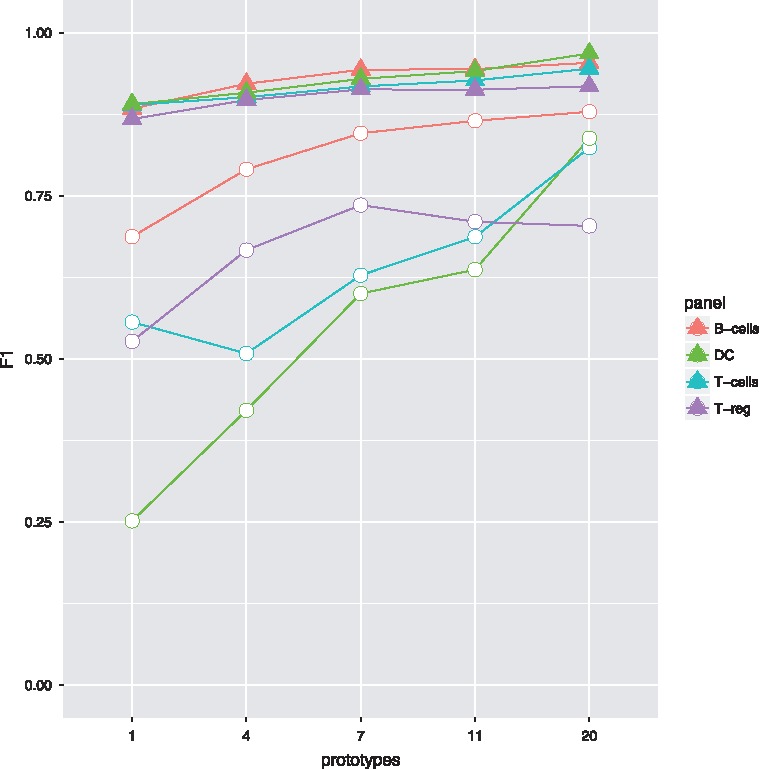
Results on the FlowCAP dataset, with minimum (circle) and mean (triangle) population performances for all four datasets, depending on the chosen number of prototypes
Official websites use .gov
A
.gov website belongs to an official
government organization in the United States.
Secure .gov websites use HTTPS
A lock (
) or https:// means you've safely
connected to the .gov website. Share sensitive
information only on official, secure websites.
Results on the FlowCAP dataset, with minimum (circle) and mean (triangle) population performances for all four datasets, depending on the chosen number of prototypes