

Abstract
Motivation
Reprogramming somatic cells into neurons holds great promise to model neuronal development and disease. The efficiency and success rate of neuronal reprogramming, however, may vary between different conversion platforms and cell types, thereby necessitating an unbiased, systematic approach to estimate neuronal identity of converted cells. Recent studies have demonstrated that long genes (>100 kb from transcription start to end) are highly enriched in neurons, which provides an opportunity to identify neurons based on the expression of these long genes.
Results
We have developed a versatile R package, LONGO, to analyze gene expression based on gene length. We propose a systematic analysis of long gene expression (LGE) with a metric termed the long gene quotient (LQ) that quantifies LGE in RNA-seq or microarray data to validate neuronal identity at the single-cell and population levels. This unique feature of neurons provides an opportunity to utilize measurements of LGE in transcriptome data to quickly and easily distinguish neurons from non-neuronal cells. By combining this conceptual advancement and statistical tool in a user-friendly and interactive software package, we intend to encourage and simplify further investigation into LGE, particularly as it applies to validating and improving neuronal differentiation and reprogramming methodologies.
Availability and implementation
LONGO is freely available for download at https://github.com/biohpc/longo.
Supplementary information
Supplementary data are available at Bioinformatics online.
1 Introduction
Both RNA microarray and RNA sequencing (RNA-seq) are well-matured techniques for the study of global and differential gene expression to infer underlying cellular regulatory networks in organisms. They have shown associated results for the same biological samples that have been analyzed using both technologies after normalizing the RNA-seq data into read counts per millions (CPM) (Malone and Oliver, 2011). Many algorithms have been developed to state the global and differential gene expression for both RNA microarray and RNA-seq techniques, but R Bioconductor packages are the most widely used tools for gene expression analysis (Love et al., 2015). Bioconductor provides well-developed suits including DESeq2 (Love et al., 2014), EdgeR (Robinson et al., 2010) and limma (Ritchie et al., 2015) for gene expression with the genome-wide detection of differentially expressed genes between samples from different conditions. Together with the growing popularity of deep-sequencing techniques, unbiased and high-throughput single-cell RNA-seq methods enable the transcriptome analysis of individual cells (Kolodziejczyk et al., 2015).
Non-neuronal somatic cells can be directly reprogrammed into functional neurons (Abernathy et al., 2017; Mertens et al., 2016), and there is a growing interest in innovating and improving neuronal reprogramming methods due in part to the promise of modeling human neurological disorders using patient cells. However, these efforts are hindered by the lack of reliable measures for neuronal identity. Electrical activity, one hallmark of neurons, can only be measured in a handful of cells in a given experiment and can be biased, as cells targeted for analysis may not be representative of the entire population. Expression of a small subset of neuronal proteins measured by immunocytochemistry (ICC) is also used to mark neuronal identity but is often subjective and highly variable. Furthermore, interpretation of ICC is unreliable, given that extrinsic factors used during neuronal reprogramming may selectively increase the expression of several neuronal genes without necessarily resulting in complete cell-fate transition. Whole transcriptome data has potential to overcome these limitations, and several complex computational approaches such as iterative principal component analysis (PCA) and iterative weighted gene co-expression network analysis (WGCNA) have been successful in classifying cell types (Tasic et al., 2016). However, these methods require a positive control and at least 15 samples for accuracy. A simpler and more easily assessable measure of neuronal identity at the transcriptome level would greatly facilitate the development and validation of neuronal reprogramming methods.
Recent studies have shown that long genes (>100 kb from transcription start to end) are selectively expressed in neurons (Gabel et al., 2015; King et al., 2013; Sugino et al., 2014). This unique feature of neurons may provide an opportunity to utilize measurements of long gene expression (LGE) in transcriptome data to quickly and easily distinguish neurons from non-neuronal cells. We therefore developed LONGO (https://github.com/biohpc/longo), an open source computational package based in R with the interactive web-supporting library, R-Shiny, that standardizes measurement of LGE within RNA-seq and microarray data formats. By providing an interactive and convenient analysis of LGE within transcriptome data, LONGO allows researchers to identify neurons, and to explore gene ontology (GO) terms associated with enriched neuronal genes.
2 Materials and methods
2.1 LONGO algorithm and framework
We developed LONGO, an R package that takes gene expression data from transcriptome experiments (e.g. RNA-seq or RNA microarray, as can be found on the Gene Expression Omnibus (GEO; Edgar et al., 2002)) as inputs from species represented on the ENSEMBL BioMart project (Smedley et al., 2015). Figure 1 shows an overview of the LONGO algorithm using Rat BodyMap data (Yu et al., 2014). The length of genes from the user-specified species is calculated from gene start and stop positions, which are retrieved automatically using the biomaRt package (Durinck et al., 2009). Gene-length dependent expression of samples is then calculated using a sliding window of genes sorted in ascending order by the length of the genes. LONGO quantile normalizes and filters input data (optional), calculates the median expression (or mean expression optionally) of genes binned by length (default genes per bin: 200), and then consecutively calculates the expression of the next bin (default step size: 40 genes). LONGO comes in two versions: one with a local HTML GUI for interactive work using the R Shiny package (LONGO) and one without a GUI for batch processing of data files (LONGOcmd). One strength of LONGO is provided through interactive plots—users have the option to modify parameters such as bin size, step size, sliding window mean or median, graph scales, as well as which samples are used as controls for downstream analyses. The significant difference of gene-length dependent expression is statistically tested by the Jensen-Shannon divergence (JSD) and the long gene quotient (LQ), which we develop herein. In addition, LONGO shows plot of p-values generated using the Wilcox test comparing the binned gene expression values to the control.
Fig. 1.
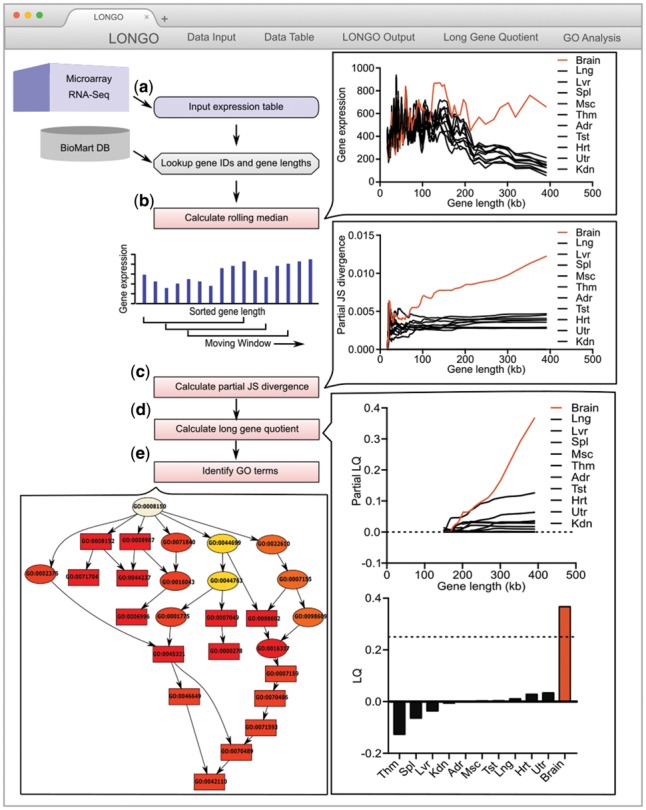
Illustration of LONGO output using Rat BodyMap data. RNA-seq of rat tissues from Rat BodyMap (Yu et al., 2014): non-neuronal tissues (black) and brain tissues (red). (a) User inputs gene expression table into LONGO, which associates gene lengths with each gene. (b) LONGO calculates rolling median per user-defined parameters (For this figure: 200 gene bins, 40 gene step). (c) LONGO calculates partial increasing JSD from short genes to long genes between each sample and a user-defined control sample. (d) LONGO calculates a partial LQ (left) and final LQ (right). (e) LONGO identifies GO term by gene set enrichment analysis
2.2 Measuring Jensen-Shannon divergence
The Kullback-Leibler divergence (KLD) is a non-commutative measure of the difference between two probability distributions P and Q, typically P representing the ‘true’ distribution and Q representing an arbitrary probability distribution. One symmetrized and smoothed version of the KLD is the JSD (Endres and Schindelin, 2003), defined as
where M = 0.5(P + Q) and the KLD is defined to be
where , and the summation is taken over histogram bins. Therefore, for gene expression data ordered by gene length, we set P as the distribution from the control sample, and Q the distribution obtained from each of the testing samples. Smaller values of KLD represent more similar distributions. LONGO first measures the JSD for the shortest genes in two samples, then iteratively re-computes the JSD after adding the next longest until all genes in respective datasets have been added. The final JSD is the JSD between all expressed genes.
2.3 Developing the long gene quotient
To systematically discover disproportionately elevated long versus short gene expression between two samples, we adapted the JS divergence to generate the long gene quotient. LONGO first removes all genes whose gene length is less than the median gene length (typically ∼30 kb) for the dataset, which allows a clearer assessment of differences in long gene expression. Then LONGO calculates the partial LQ (PLQ) for any testing sample (), which we define as
where P represents the distribution of the control sample and D’JS only considers long genes (>150 kb). The PLQ describes the relative change in JSD of each sample compared with the maximum changes of JSD across all samples, so its magnitude ranges from 0 to 1.
Because the underlying JSD does not distinguish the directionality of changes, we define the final LQ as LQ = S(PLQ), where S = −1 if mean(Q) < mean(P). This ensures that LQ is positive only if LGE is higher in the testing sample than in the control sample. The LQ is dependent on the control sample selected, as well as the sample with the most extensive LGE. Therefore, while LQ is effective at distinguishing neuronal from non-neuronal cells in the absence of a positive control, we strongly encourage including a positive control neuronal sample. The LQ is also dependent on the sliding window bin and step size; for the default of 200 genes per bin with a 40 gene-step, using the median, neuronal cells typically exceed an LQ of 0.25.
In addition to LQ, the correlation between binned gene expression and median length of bins (default genes per bin: 200; default step size: 40 genes) for genes longer than 100 kb also identifies neuronal sample when highly positive (Supplementary Fig. S1). Together with LQ, these metrics reliably distinguish neurons from non-neuronal samples.
2.4 Gene ontology (GO) analysis
Gene Ontology (GO) analysis allows understanding of the overall differences of gene expression among multiple samples. This is accomplished by utilizing the GO database. The GO database contains information that links genes to GO terms. These GO terms can be broad, encompassing a large variety of biological functions, or narrow, including only a few specific functions. This allows the overall expression patterns of the genes to be categorized and then quantitatively measured. The hierarchies of GO terms provide an overview of the intersection of genes to biological functions. This intersection provides an insight into to the different cellular mechanisms by simplifying the data. One problem with using GO analysis is that as new information is discovered the genes for GO terms can be changed. Using an up-to-date database of GO terms can be used to avoid this problem but may lead to different results over time. Since the GO terms are determined by previous knowledge it can limit the potential to discover new features of genes.
The LONGO package handles GO analysis by utilizing topGO (Alexa et al., 2006). LONGO allows multiple parameters in the GO analysis step. The main two are the statistical test and the method for graphing. The statistical test is used to determine the significance of the biological functions and the method for graphing is used to determine how the significant nodes should be graphed.
2.5 Cellular reprogramming and analyses
Human adult dermal fibroblasts from healthy individuals were acquired from the Coriell Institute for Medical Research: ND34769 (female, 68 years old at sampling; WT4) and AG04148 (male, 56 years old; WT2). Cells were reprogrammed as described in Victor et al. (2014) using a lentiviral cocktail of rtTA, pTight-9-124-BclxL, CTIP2, MYT1L, DLX1 and DLX2. Immunocytochemistry was also performed as described in Victor et al. (2014) using primary antibody of rabbit anti-β-III tubulin (BioLegend, 1:2000) and secondary antibody of anti-rabbit IgG conjugated with Alexa-488 (Invitrogen, 1: 1000). Images were captured using a Leica SP5X white light laser confocal system with Leica Application Suite Advanced Fluorescence 2.7.3.9723. RNA-seq raw data was recently published (Victor et al., 2018). Briefly, RNA was extracted from converted neurons and isolated with TRIzol reagent (Thermo Fisher Scientific) per manufacturer’s instructions. After treating samples with Ribo-Zero kit (Illumina), cDNA library was sequenced in Illumina HiSeq 2500. Sequence reads were aligned to the human genome (hg38) with STAR v2.4.2a. Gene counts were derived from the number of uniquely aligned unambiguous reads by Subread: featureCount, version 1.4.6, with GENCODE gene annotation (V23).
3 Results
3.1 LGE identifies neurons upon differentiation and maturation during development
To demonstrate LGE as an indicator of neuronal identity, we first analyzed RNA-seq gene expression profiles at the tissue level from the Rat BodyMap database (Yu et al., 2014), which profiled 32 rats across 10 different organs (i.e. adrenal gland, brain, heart, kidney, liver, lung, muscle, spleen, thymus and testis or uterus), using LONGO. Consistent with previous reports of LGE in brain tissues (Gabel et al., 2015), we found that LONGO clearly distinguishes the brain from all other non-neuronal tissues with an LQ of 0.31 (Fig. 1b). Additionally, by measuring the collective levels of long gene expression, neuronal samples become readily identifiable in a population of non-neuronal samples without depending on the individual expression levels of known neuronal markers (Supplementary Fig. S1).
To further evaluate LGE in assessing post-mitotic neurons during neural development, we used LONGO to analyze transcriptome datasets collected from distinct regions of the developing human cortex (Miller et al., 2014). Interestingly, LGE analysis distinguished cortical and subcortical regions (i.e. intermediate zone, subcortical plate, cortical plate, subpial granular zone and marginal zone; max LQ of 0.55) from other zones in which proliferative neural progenitors are prominent (i.e. ganglionic eminences, ventricular and sub-ventricular zones; max LQ of 0.13) (Fig. 2a). Our finding is consistent with the neuronal populations observed in cortical and subcortical regions (Miller et al., 2014), and the increase in LGE likely reflects the number of differentiated neurons within each layer. To further pinpoint the cellular source of differential LGE, we analyzed LGE in different cell types isolated by fluorescence activated cell sorting (FACS) from the cortex (Zhang et al., 2016), and found that only neurons displayed significantly enriched LGE in contrast to other cell types including astrocytes and oligodendrocytes, suggesting that increased LGE in whole cortex is likely due to neurons (Supplementary Fig. S2a). Similarly, LGE analysis of single-cell RNA-seq of mouse visual cortex (Tasic et al., 2016) identified increased LGE and LQ only for neurons, further validating LGE as a unique feature of neurons (Fig. 2b). Furthermore, by applying LONGO to data generated by Habib et al. (2016), where single-nucleus RNA-seq was combined with pulse-labeling of proliferating cells by EdU to track transcriptional dynamics of newborn neurons within the neurogenic niche of the adult hippocampus, we found that LGE increased as neural progenitor cells (NPCs) exited the cell cycle and continued to differentiate into neurons and mature in vivo (Fig. 2c), perfectly matching the maturation trajectory determined by Habib et al., and validating LGE as a reliable marker for post-mitotic mature neurons. In order to address whether increased LGE is also a feature of cultured neurons, we applied LONGO to the transcriptome data of motor neurons differentiated from mouse embryonic stem cells (ESCs) (Mahony et al., 2011). Although minor differences in LGE were observed between embryoid body formation and induction of NPCs by retinoic acid, the largest increase in LGE occurred when progenitors differentiated into post-mitotic motor neurons (Supplementary Fig. S2b). This finding is consistent with the notion that onset of LGE occurs during differentiation of NPCs to neurons, which is also apparent in tissue culture conditions. Together, our findings demonstrate LGE as a hallmark of neuronal development assayed at the single-cell and population levels.
Fig. 2.
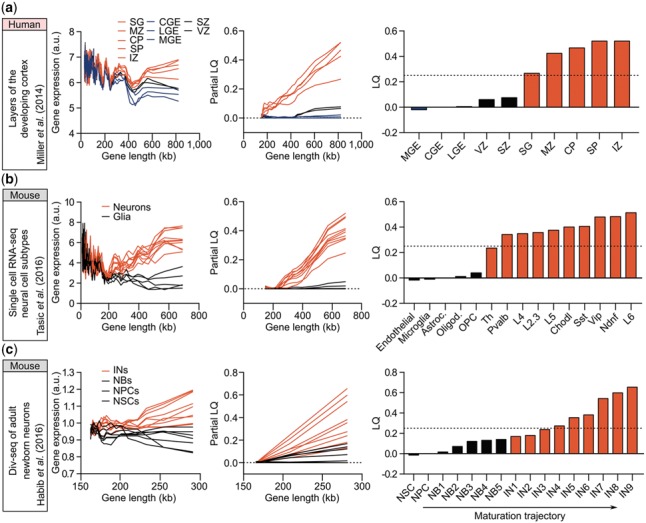
LONGO output of neuronal differentiation and maturation during development. From left to right, reference for input data, rolling media of gene expression versus length (200 gene bins, 40 gene step), partial LQ and final LQ. (a) Layers of the developing human cortex (Miller et al., 2014): ganglionic eminences (MGE, LGE, CGE; blue); ventricular zones (VZ and SVZ; black); and post-mitotic zones (SG, MZ, CP, SP and IZ; red). (b) scRNA-seq neural cell subtypes from mouse visual cortex (Tasic et al., 2016): glial cells (endothelial cells, microglia, astrocytes, oligodendrocytes and OPCs) shown in black; neuronal subtypes (Th, Pvalb, L4, L2.3, L5, Chodl, Sst, Vip, Ndnf and L6) shown in red. (c) Div-seq of adult newborn neurons in the neurogenic niche of mouse hippo-campus (Habib et al., 2016): neural stem cells (NSCs), neural progenitor cells (NPCs) and neuroblasts (NBs) shown in black; immature neurons (IN) shown in red. Samples are numbered according to their maturity (Habib et al., 2016)
3.2 LGE identifies neurons successfully reprogrammed from non-neuronal cells
Based on the authenticity of LGE as a transcriptomic feature of neurons both in vivo and in tissue culture, we applied LONGO to evaluate cells generated by neuronal conversion using datasets from transcription factor-based (Colasante et al., 2015; Treutlein et al., 2016), microRNA-based (Victor et al., 2014) and small molecule-based (Hu et al., 2015) approaches to convert mouse or human fibroblasts to neurons. Because we routinely observe LQ exceeding 0.25 in neurons (Fig. 2 and Supplementary Fig. S3), we use this value as the threshold to indicate successful neuronal conversion. First, we used a transcriptome dataset in which neuronal conversion of mouse embryonic fibroblasts (MEFs) was monitored at a single cell level (Treutlein et al., 2016) and applied LONGO to analyze differential LGE between successfully reprogrammed cells and cells that failed to convert (Fig. 3a). Only successfully converted neurons showed increased LGE and an LQ value substantially above 0.25, validating LGE analysis as a reliable approach to assess neuronal conversion. To test microRNA-based neuronal conversion (Victor et al., 2014), we prepared RNA from an unpurified population of human striatal medium spiny neurons (MSNs) converted from fibroblasts and performed RNA-seq. When we applied LONGO to converted MSNs, we observed a dramatic increase in LGE similar to ESC-derived human neurons (Fig. 3b), despite that samples were unpurified. Furthermore, we find that LONGO detects variable conversion efficiencies inherent in different fibroblast samples—one fibroblast cell line (HAF2) that we previously found to display a lower conversion efficiency (Supplementary Fig. S4) yielded an average LQ barely reaching 0.25, whereas the other fibroblast cell line (HAF1) yielded an average LQ of 0.67 (Fig. 3b). Analysis of direct neuronal reprogramming of human fibroblasts by small molecules (Hu et al., 2015) also revealed increased LGE approaching the levels obtained by ESC-derived neurons by prolonged treatment with small molecules (Supplementary Fig. S5a). However, knockdown of PTBP1, which reportedly generates neuronal-like cells from HAFs (Xue et al., 2016), does not increase LGE at the population level (Supplementary Fig. S5b). Under these conditions, Xue et al. reported little expression of neuronal markers, such as MAP2 and NeuN, and the absence of neuronal electrical activity (Xue et al., 2016), which is consistent with our finding of unaltered LGE. It will be interesting to apply LGE analysis to sequential knockdown of PTBP1 and PTBP2, which reportedly generated more functional neurons (Xue et al., 2016). Finally, we analyzed RNA-seq data from MEFs overexpressing neuronal transcription factors Foxg1, Sox2, Ascl1, Dlx5 and Lhx6, which has been previously reported to generate GABAergic interneurons (Colasante et al., 2015). Cells were purified by FACS based on the expression of GAD67, a marker for GABAergic interneurons, but were not electrically active at this time-point (Colassante et al. reported that cells became electrically active only after 4 weeks of co-culture with rat hippocampal neurons). Supporting LGE as a marker for mature neurons, we only detected increased LGE for control interneurons (GAD67), not for induced GABAergic interneurons (iGABA) in monoculture (Fig. 3c).
Fig. 3.

LONGO output of somatic cell direct neuronal reprogramming. From left to right, reference for input data, rolling median of gene expression versus length (200 gene bins, 40 gene step), partial LQ and final LQ. (a) Direct reprogramming of mouse embryonic fibroblasts (MEFs) to neurons by transcription factors (Treutlein et al., 2016): MEFs, myocytes, intermediate reprogramming (D2 and D5) and induced MEFs (D2) shown in black; failed reprogramming (D5 and D22) shown in purple; early (D5) and late (D22; dotted-line) successful reprogramming in red. (b) Direct reprogramming of human adult fibroblasts (HAFs) to striatal medium spiny neurons (MSNs) by microRNAs: HAFs from two different cell lines (black); MSNs derived from HAF2 (MSN2; purple); ESC-derived neurons(Gill et al., 2016) (dotted-line) and MSNs derived from HAF1 (MSN1) shown in red. (c) Direct reprogramming of MEFs to iGABA by Foxg1, Sox2, Ascl1, Dlx5 and Lhx6 (Colasante et al., 2015): MEFs (black); iGABA (dark purple); GAD67+ interneurons (red)
3.3 GO analysis of neuronal differentiation
GO enrichment analysis of mouse ESC differentiation to motor neurons in vitro (Mahony et al., 2011) is shown in Figure 4. The experiment has multiple GO terms identified as being significant. Rectangle color represents the relative significance, ranging from dark red (most significant) to bright yellow (least significant). The two lines show the GO identifier and a trimmed GO name.
Fig. 4.

LONGO interactive GO analysis snapshot using incorporated topGO R package. Enrichment analysis of mouse ESC differentiation to motor neurons in vitro (Mahony et al., 2011). Rectangle color represents the relative significance, ranging from dark red (most significant) to bright yellow (least significant). The two lines show the GO identifier and a trimmed GO name
The two categories identified are embryogenesis and neurogenesis. These results are in line with the source of the dataset that was an experimental differentiation of embryonic stem cells to neurons. As the cells differentiate, the genes they express are altered providing the enriched GO terms.
4 Discussion and conclusion
One of the known correlates of gene length is the levels of alternative splicing (McGuire et al., 2008), which is a feature also enriched in vertebrate and invertebrate nervous systems (Barbosa-Morais et al., 2012; Jelen et al., 2007; Merkin et al., 2012). Some of these long genes encode over 20 000 different protein isoforms, and are uniquely expressed in individual neurons, endowing each neuron with a unique molecular profile (Miura et al., 2013). So, while each neuron expresses copies of long genes, these copies are not identical to even neighboring neurons of the same tissue. This allows us to measure the expression of long genes collectively to determine if a cell or tissue is neuronal but does not typically provide the resolution to determine differences between one type of neuron versus another, or one type of neural tissue versus another.
For investigators interested in adopting an existing reprogramming technique in their research programs, LONGO provides a metric for evaluating the efficiency of different techniques. The robustness of LGE analysis provided by LONGO and the steadily declining cost of transcriptome analyses lead us to strongly advise investigators who perform neuronal reprogramming or differentiation to routinely generate transcriptome data and analyze LGE to confirm neuronal identity.
Secondary to the LGE feature, the gene ontology analysis provides another easily accessible view of the transcriptome data. LONGO contains a simplified point and click approach to predict neuronal identity and determination of differentially enriched genes. The ease of input options allowing multiple gene identifiers for multiple species to determine the gene length and the connected GO terms provides a low barrier of entry in using LONGO compared to other tools. The ability to simply alter the options for analyzing the data creates a simple, easy to use and flexible tool.
As interest in modeling neuronal cell fate acquisition and neurological diseases using reprogrammed neurons continues to grow, so will the need to validate and improve methodologies for neuronal reprogramming. Toward this end, we have proposed LGE as a simple and easily assessable metric of neuronal identity and have provided a computational package for its analysis in RNA-seq as well as RNA microarray data. This tool and conceptual advancement will greatly facilitate and expedite exploration of LGE in other systems and experimental conditions.
Supplementary Material
Acknowledgements
We thank A. Herbert for helpful discussions and editing.
Funding
M.J.M. was supported by the NIH-funded Ruth L. Kirschstein National Research Service Award (NRSA) Institutional Predoctoral Fellowship (T32GM081739; Barch, PI). A.S.Y. is supported by NIH Director’s Innovator Award (DP2NS083372), NIH RF1AG056296, Missouri Spinal Cord Injury/Disease Research Program (SCIDRP), Cure Alzheimer’s Fund and Presidential Early Career Award for Scientists and Engineers. T.-H.A is supported by NSF-1566292, NSF-1564894 and Saint Louis University President's Research Fund 2018.
Conflict of Interest: none declared.
References
- Abernathy D.G. et al. (2017) MicroRNAs induce a permissive chromatin environment that enables neuronal subtype-specific reprogramming of adult human fibroblasts. Cell Stem Cell, 21, 332–348. [DOI] [PMC free article] [PubMed] [Google Scholar]
- Alexa A. et al. (2006) Improved scoring of functional groups from gene expression data by decorrelating GO graph structure. Bioinformatics, 22, 1600–1607. [DOI] [PubMed] [Google Scholar]
- Barbosa-Morais N.L. et al. (2012) The evolutionary landscape of alternative splicing in vertebrate species. Science, 338, 1587. [DOI] [PubMed] [Google Scholar]
- Colasante G. et al. (2015) Rapid conversion of fibroblasts into functional forebrain GABAergic interneurons by direct genetic reprogramming. Cell Stem Cell, 17, 719–734. [DOI] [PubMed] [Google Scholar]
- Durinck S. et al. (2009) Mapping identifiers for the integration of genomic datasets with the R/Bioconductor package biomaRt. Nat. Protoc., 4, 1184–1191. [DOI] [PMC free article] [PubMed] [Google Scholar]
- Edgar R. et al. (2002) E. Gene Expression Omnibus: nCBI gene expression and hybridization array data repository. Nucleic Acids Res., 30, 207–210. [DOI] [PMC free article] [PubMed] [Google Scholar]
- Endres D.M., Schindelin J.E. (2003) A new metric for probability distributions. IEEE Trans. Inf. Theory, 49, 1858–1860. [Google Scholar]
- Gabel H.W. et al. (2015) Disruption of DNA-methylation-dependent long gene repression in Rett syndrome. Nature, 522, 89–93. [DOI] [PMC free article] [PubMed] [Google Scholar]
- Gill K.P. et al. (2016) Enriched retinal ganglion cells derived from human embryonic stem cells. Sci. Rep., 6, 30552. [DOI] [PMC free article] [PubMed] [Google Scholar]
- Habib N. et al. (2016) Div-Seq: single-nucleus RNA-Seq reveals dynamics of rare adult newborn neurons. Science, 353, 925–928. [DOI] [PMC free article] [PubMed] [Google Scholar]
- Hu W. et al. (2015) Direct conversion of normal and Alzheimer's Disease human fibroblasts into neuronal cells by small molecules. Cell Stem Cell, 17, 204–212. [DOI] [PubMed] [Google Scholar]
- Jelen N. et al. (2007) Evolution of Nova-dependent splicing regulation in the brain. PLoS Genet., 3, 1838–1847. [DOI] [PMC free article] [PubMed] [Google Scholar]
- King I.F. et al. (2013) Topoisomerases facilitate transcription of long genes linked to autism. Nature, 501, 58–62. [DOI] [PMC free article] [PubMed] [Google Scholar]
- Kolodziejczyk A.A. et al. (2015) The technology and biology of single-cell RNA sequencing. Mol. Cell, 58, 610–620. [DOI] [PubMed] [Google Scholar]
- Love M.I. et al. (2015) RNA-Seq workflow: gene-level exploratory analysis and differential expression. F1000Research, 4, 1070. [DOI] [PMC free article] [PubMed] [Google Scholar]
- Love M.I. et al. (2014) Moderated estimation of fold change and dispersion for RNA-seq data with DESeq2. Genome Biol., 15, 550.. [DOI] [PMC free article] [PubMed] [Google Scholar]
- Mahony S. et al. (2011) Ligand-dependent dynamics of retinoic acid receptor binding during early neurogenesis. Genome Biol., 12, R2. [DOI] [PMC free article] [PubMed] [Google Scholar]
- Malone J.H., Oliver B. (2011) Microarrays, deep sequencing and the true measure of the transcriptome. BMC Biol., 9, 34.. [DOI] [PMC free article] [PubMed] [Google Scholar]
- McGuire A.M. et al. (2008) Cross-kingdom patterns of alternative splicing and splice recognition. Genome Biol., 9, R50. [DOI] [PMC free article] [PubMed] [Google Scholar]
- Merkin J. et al. (2012) Evolutionary dynamics of gene and isoform regulation in mammalian tissues. Science, 338, 1593.. [DOI] [PMC free article] [PubMed] [Google Scholar]
- Mertens J. et al. (2016) Evaluating cell reprogramming, differentiation and conversion technologies in neuroscience. Nat. Rev. Neurosci., 17, 424–437. [DOI] [PMC free article] [PubMed] [Google Scholar]
- Miller J.A. et al. (2014) Transcriptional landscape of the prenatal human brain. Nature, 508, 199–206. [DOI] [PMC free article] [PubMed] [Google Scholar]
- Miura S.K. et al. (2013) Probabilistic splicing of Dscam1 establishes identity at the level of single neurons. Cell, 155, 1166–1177. [DOI] [PMC free article] [PubMed] [Google Scholar]
- Ritchie M.E. et al. (2015) limma powers differential expression analyses for RNA-sequencing and microarray studies. Nucleic Acids Res., 43, e47. [DOI] [PMC free article] [PubMed] [Google Scholar]
- Robinson M.D. et al. (2010) edgeR: a Bioconductor package for differential expression analysis of digital gene expression data. Bioinformatics, 26, 139–140. [DOI] [PMC free article] [PubMed] [Google Scholar]
- Smedley D. et al. (2015) The BioMart community portal: an innovative alternative to large, centralized data repositories. Nucleic Acids Res., 43, W589–W598. [DOI] [PMC free article] [PubMed] [Google Scholar]
- Sugino K. et al. (2014) Cell-type-specific repression by methyl-CpG-binding protein 2 is biased toward long genes. J. Neurosci., 34, 12877–12883. [DOI] [PMC free article] [PubMed] [Google Scholar]
- Tasic B. et al. (2016) Adult mouse cortical cell taxonomy revealed by single cell transcriptomics. Nat. Neurosci., 19, 335–346. [DOI] [PMC free article] [PubMed] [Google Scholar]
- Treutlein B. et al. (2016) Dissecting direct reprogramming from fibroblast to neuron using single-cell RNA-seq. Nature, 534, 391–395. [DOI] [PMC free article] [PubMed] [Google Scholar]
- Victor M.B. et al. (2014) Generation of human striatal neurons by microRNA-dependent direct conversion of fibroblasts. Neuron, 84, 311–323. [DOI] [PMC free article] [PubMed] [Google Scholar]
- Victor M.B. et al. (2018) Striatal neurons directly converted from Huntington’s disease patient fibroblasts recapitulate age-associated disease phenotypes. Nat. Neurosci., 21, 341–352. [DOI] [PMC free article] [PubMed] [Google Scholar]
- Xue Y. et al. (2016) Sequential regulatory loops as key gatekeepers for neuronal reprogramming in human cells. Nat. Neurosci., 19, 807–815. [DOI] [PMC free article] [PubMed] [Google Scholar]
- Yu Y. et al. (2014) A rat RNA-Seq transcriptomic BodyMap across 11 organs and 4 developmental stages. Nat. Commun., 5, 3230. [DOI] [PMC free article] [PubMed] [Google Scholar]
- Zhang Y. et al. (2016) Purification and characterization of progenitor and mature human astrocytes reveals transcriptional and functional differences with mouse. Neuron, 89, 37–53. [DOI] [PMC free article] [PubMed] [Google Scholar]
Associated Data
This section collects any data citations, data availability statements, or supplementary materials included in this article.