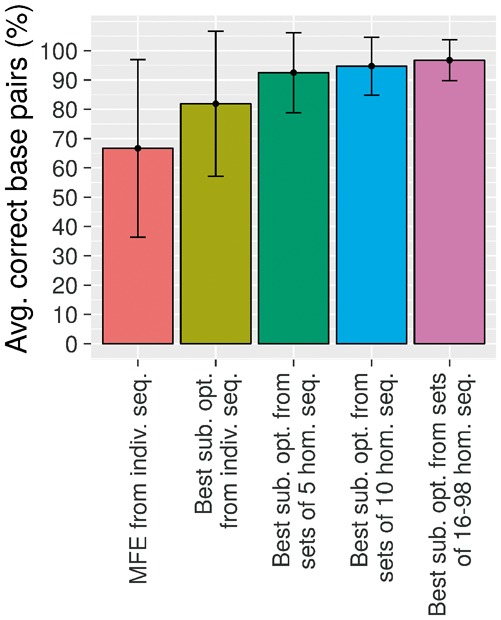
Fig. 2.

Average percentage of correct base pairs considering MFE structures and best structures of all sub-optimal structures from one (individual sequence), 5, 10 and 16–98 homologous sequences. The best sub-optimal structures are the sub-optimal structures maximizing the average percentage of correct base pairs represented by the PPV
